7280 State Route 61 · Candlewood Lake, OH
Flood risk 1/10 · Minimal
- FEMA flood zone
- X (unshaded)
- Chance of flooding over 30 yrs
- 0.0%
- Est. flood insurance / yr
- $507 – $1,088
Fire risk 1/10 · Minimal
- Est. fire insurance / yr
- $713 – $1,323
Heat risk 3/10 · Minor
- Hot days now (above 97°F)
- 7 days/yr
- Hot days in 30 yrs
- 17 days/yr
Wind risk 2/10 · Minimal
- Chance of severe wind over 30 yrs
- 1.0%
Air-quality risk 2/10 · Minimal
- Unhealthy air days now
- 1 days/yr
- Unhealthy air days in 30 yrs
- 1 days/yr
Risk factors via First Street. Map © Google.
Why this score? — see what drove the C grade
The composite is a weighted blend of 9 inputs, each scored 0–100. Each bar is that input's sub-score; the figure is the points it added to the 100-point composite (weight × sub-score).
- Cash flow +23.6/30.0
- DSCR +7.6/10.0
- ARV discount +7.5/15.0
- 1% rule +5.2/10.0
- Schools +4.9/10.0
- Livability +3.4/5.0
- Rent growth +2.5/5.0
- Condition / age +2.5/5.0
- Appreciation +0.0/10.0
$149,998
🖨 Deal sheet (PDF) 📄 Offer letter ✓ Due diligence
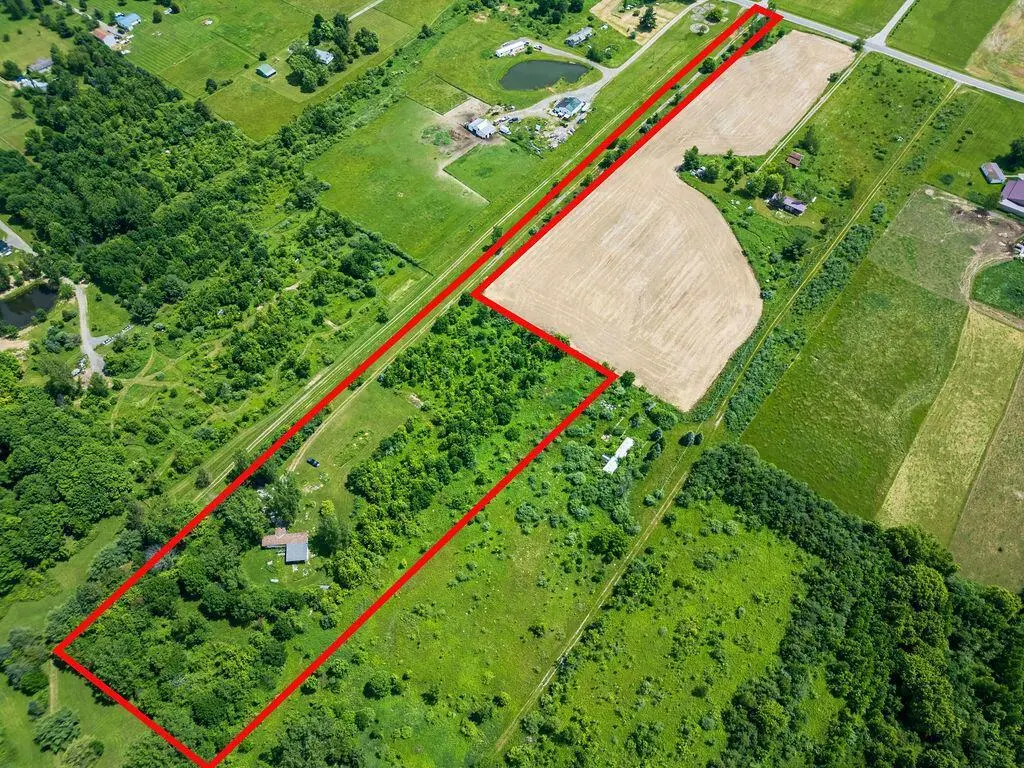
Listing remarks
Property back a private lane. No mailbox. Sign Out Front. See Aerial View. Property is an old manufactured home with ADD ON. Full basement under both sections. Property is being SOLD AS IS. Large Pole Barn (864 sq. ft) with Concrete Floor & Electric. Garage Door Opener. Utilities are on. Schilling Propane. Ohio Edison Electric. Well & Septic. Utilities have been on for the duration of the vacancy. Seller is requesting Highest & Best Offers by June 18, 2026 at 4pm. Please leave offers open until the next business day. See Agent to Agent Remarks. Cash or Conventional Buyers only.
Key facts
- Private lane
- Well
- Full basement
Tags
Property features AI
Exterior
- Parking: Detached 2-car garage with garage door opener
- Utilities: Private sewer; Well water
- Home design: Single-family residence; One story; Built in 1972; No shared/common walls
- Construction: Block foundation; Built in 1972
- Exterior features: Other exterior features; Block foundation
Interior
- Bedrooms: Three main-level bedrooms
- Flooring: Other flooring
- Bathrooms: One full bathroom
- Heating & cooling: Propane heating
- Interior features: Insulated and storm windows; Full basement
Neighborhood map
What this means for you Summary
Snapshot
- This is a 3-bed/1.0-bath other listed at $150k.
Deal economics
- At list price, monthly cash flow is $284 ($3k/yr) — positive.
- The deal already cash-flows at list — no discount required.
- Meets the 1% rule at list price ($2k rent vs $150k).
Location & tenants
- Location reads 67/100 on livability (#626 in OH) — a middle-class / working-renter tenant base. Strengths: employment A+, cost of living A+, housing A+; Watch: schools F, amenities F, commute F.
- Northmor Local (rural): math 54% / reading 60% proficiency, ranked #336 of 656 in OH (top 51%) — acceptable for families but not a draw, mixed tenant base, ~2y average lease.
- Market conditions: 87 active listings in the ZIP; 129 units permitted in Morrow County in 2024 (0 in 5+ unit buildings).
Forward outlook
- Local home prices are declining (-3.0%/yr); year-one equity from $1k of loan paydown is wiped out by about $4k of value loss. Plan a longer hold.
- Morrow County population projected at -10% by 2050 — secular population decline; favor cash flow + early exit over multi-decade hold.
Negotiation context
- Only 8 days on market — expect competitive offers; lowballing is unlikely to land.
- Current owner paid $10k; list at $150k implies a 1415% gain — meaningful room to come down on a strong offer.
Questions for the listing agent
- Built in 1972 — when were the roof, HVAC, electrical panel, plumbing, and water heater last replaced?
- Is there a deadline driving the sale (1031 exchange, divorce, estate, relocation)? That informs how much negotiation room exists.
- Schools are F-rated, which usually means shorter tenancies and higher turnover. Who's the typical renter profile here, and what's been the actual vacancy rate?
- What's the average days-on-market for RENTAL listings here right now (not sales)? A rising rental-DOM trend means longer vacancies and softer asking-rent achievability than the comps imply.
- What's the recent tenant-quality profile in this submarket — average credit score on applications, eviction rate, late-payment / NSF rate, and stable-employment percentage? A property-management company in the area should have these aggregated.
- How much new for-sale + rental construction is in the pipeline within 1–3 miles? Heavy new supply typically softens prices + rents 12–24 months out; constrained supply supports both.
Investment metrics
- 1% rule
- 1.02% ✓
- Cap rate
- 8.56%
- Cash-on-cash
- 8.10%
- DSCR
- 1.36
- GRM
- 8.2
CMA / ARV
No comps found within radius.
Projected returns pro-forma
-3.0% appreciation · 3.0% rent growth · sell at horizon
- IRR
- -4.0%
- Equity multiple
- 0.85×
- Total profit
- $-6,287
- Equity at exit
- $22,365
- IRR
- 5.7%
- Equity multiple
- 1.42×
- Total profit
- $17,597
- Equity at exit
- $12,969
Cash invested: $41,999 (down + closing). Projections, not guarantees.
Landlord ↔ Tenant lean methodology
- Overall (STATE)
- 73 Landlord-Friendly
- State Ohio
- 73 Landlord-Friendly · R+6
- County
- — inherits STATE
- City
- — inherits STATE
ZIP-level market 43338
- Home prices YoY
- -17.8%
- Active inventory
- 87
- Price-to-rent
- 8.2×
Monthly cashflow live
- Estimated rent
- $1,527 medium interval (Pro) →
- Mortgage (P&I)
- −$787
- Tax from tax record
- −$73 /mo · $880/yr
- Insurance
- −$62
- HOA
- −$0
- Vacancy / Maint / Mgmt
- −$321
- Net cashflow
- $284
Break-even live
Sensitivity live
| Price | -10% $369 | -5% $326 | +0% $284 | +5% $241 | +10% $199 |
|---|---|---|---|---|---|
| Rent | -10% $163 | -5% $223 | +0% $284 | +5% $344 | +10% $404 |
| Rate | -1.0pp $359 | -0.5pp $322 | base $284 | +0.5pp $245 | +1.0pp $205 |
UW: 25.0% down · 7.5% · 30yr · 1.5% tax · 5.0% vac · 8.0% maint · 8.0% mgmt
Financing live
Cash to close
- Down payment
- $37,500
- Closing costs
- $4,500
- Reserves months
- —
- Total cash needed
- —
Loan-product check · same deal, 3 products live
Conventional
25% down · 7.5% · 30yr
- Down + closing
- —
- Monthly P&I
- —
- Monthly cashflow
- —
- DSCR
- —
- Eligible?
- —
Personal DTI + credit; lowest rate.
DSCR
20% down · 8.5% · 30yr
- Down + closing
- —
- Monthly P&I
- —
- Monthly cashflow
- —
- DSCR
- —
- Eligible?
- —
No personal income docs; deal must DSCR.
Hard money
10% down · 12.0% · 12mo
- Down + closing
- —
- Monthly P&I
- —
- Monthly cashflow
- —
- DSCR
- —
- Eligible?
- —
Short-term bridge; refi at stabilization.
Listing history 8 events
-
2026-06-19days on market $149,998 Active 8 DOM
-
2026-06-18days on market $149,998 Active 7 DOM
-
2026-06-17days on market $149,998 Active 6 DOM
-
2026-06-16days on market $149,998 Active 5 DOM
-
2026-06-15days on market $149,998 Active 4 DOM
-
2026-06-14days on market $149,998 Active 2 DOM
-
2026-06-12remarks 590-char remark
-
2026-06-12$149,998 Active 1 DOM
ⓘ Source: listings_history table (triggers on properties + properties_extension) + one-shot
backfill from property_details.listing_events for pre-trigger history.
Tax reassessment forecast OH · Partial reset (capped growth)
- Current annual tax
- $880 · $73/mo
- Projected year-2 tax
- $1,610 · $134/mo
- Expected delta
- +$730/yr (+$61/mo · 82.9%)
ⓘ Screening estimate from a state-policy table — verify with the county assessor before closing.
Climate risk First Street
- Flood 1/10 Low FEMA zone X (unshaded) · 0% chance over 30 yrs
- Wildfire 1/10 Low
- Heat 3/10 Moderate 7 d/yr ≥97°F today · 17 d/yr by 30 yrs out
- Wind 2/10 Low 100% chance of damaging wind over 30 yrs
- Air quality 2/10 Low 1 unhealthy d/yr today · 1 by 30 yrs out
Nearby sold comps map
Loading sold comps map…
Walkable amenities ~0.75 mi
Loading nearby amenities…
Taxation est. · year 1
- Rental income
- $18,321
- − Mortgage interest
- −$8,402
- − Property taxes
- −$880
- − Insurance
- −$750
- − Repairs & maintenance
- −$1,466
- − Management
- −$1,466
- − Depreciation
- −$4,364
- Taxable income
- $993
- Est. tax owed @ 24.0%
- −$238
- After-tax cash flow
- $3,165/yr
For passive investors: Depreciation is non-cash, so a rental often shows a tax loss while cash-flowing — sheltering income. Rental losses are passive: they offset passive income freely, and up to $25,000/yr can offset ordinary (W-2) income if you actively participate and your MAGI is under $100k (phasing out to $0 by $150k); unused losses carry forward. On sale, claimed depreciation is recaptured at up to 25%, and gains may owe capital-gains tax (a 1031 exchange can defer both). Figures are a year-1 estimate at your 24.0% rate — not tax advice; consult a CPA.
Schools (NCES district)
- District
- Northmor Local
- NCES district ID
- 3904881
- Math proficiency
- 54% ▼ -7.00%
- Reading proficiency
- 60% ▼ -3.00%
- Median HH income
- $49,371
- Composite
- 48.51/100
- National rank
- #2120
- State rank
- #336 of 656 in OH
Livability — Candlewood Lake
- Score
- 67/100
- State rank
- #626
- US rank
- #10971
Category grades
Schools grade is shown separately in the Schools card above.
Census & demographics
- County
- Morrow · 41,908 people
- Metro
- Columbus, OH
- Population (ZIP)
- 10,394
- Household income
- $69,794
- Rent vs Own
Population outlook (Morrow County) Hauer SSP2
- Today (2025)
- 35,607 people
- By 2030
- 35,482 · -0.4%
- By 2040
- 34,369 · -3.5%
- By 2050
- 32,038 · -10.0%
- By 2075
- 25,090 · -29.5%
- By 2100
- 17,123 · -51.9%
Race, ethnicity, and origin ACS 2023
- Neighborhood character
- Predominantly White (94%)
- Race & ethnicity
- White 94% Two or more races 4% Hispanic / Latino 3%
- Common ancestry
- Slovak 4% Romanian 3% Serbian 1%
- Foreign-born
- 2%
- Languages at home
- 98% English-only · Tagalog/Filipino 1% Spanish 1%
Political lean MEDSL · Morrow
- 2024 margin
- Solid R (+55.7) · D 21.7% · R 77.5%
- 2008→2024 swing
- -32.4pp toward R · 2008: -23.4pp · 2024: -55.7pp
- All cycles
- 2024: R+55.7 2020: R+54.3 2016: R+49.5 2012: R+24.6 2008: R+23.4
Not yet ingested
- Civics
- —
Market trends
- HPI YoY
- ▼ -59.76%
- Current HPI
- 276.7152
- Rent YoY
- —
- Metro
- —
- State GDP YoY
- ▲ 1.98%
- F500 in state
- 48
Industry mix (Fortune 500 HQ in OH)
| Industry | F500 HQs | Revenue |
|---|---|---|
| Insurance | 3 | $145B |
|
||
| Industrial Machinery | 3 | $49B |
|
||
| Financial Services | 3 | $24B |
|
||
| Consumer Goods | 2 | $93B |
|
||
| Aerospace / Defense | 2 | $47B |
|
||
| Utilities | 2 | $33B |
|
||
Price history
+1415.1% since first listed2 events — show timeline
- 2026-06-11 Listed $149,998 CBRMLS
- 2002-08-15 Sold (Public Records) $9,900 Public Records
Property tax history
+7.0%/yrLatest (2025): $880 · -0.2% YoY. Source: county tax records.
Cash-flow waterfall
monthlySold comps — $/sqft
last 12 mo · ≤1 miLoading sold comps…