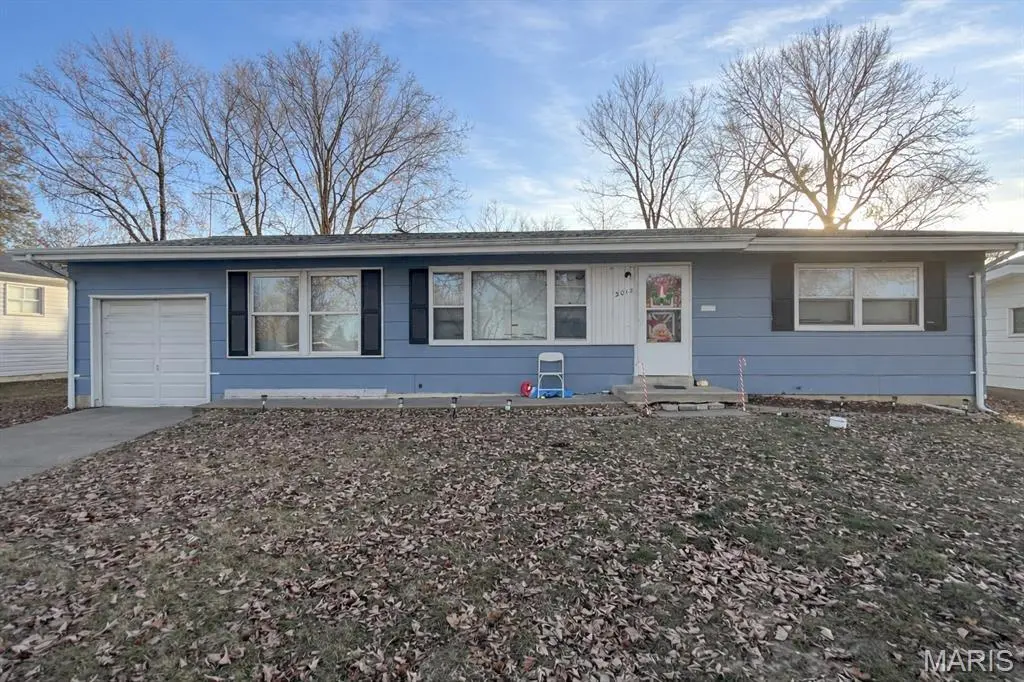
3012 Solway Ave · Jennings, MO
Flood risk 1/10 · Minimal
- FEMA flood zone
- X (unshaded)
- Chance of flooding over 30 yrs
- 0.0%
- Est. flood insurance / yr
- $473 – $860
Fire risk 1/10 · Minimal
- Est. fire insurance / yr
- $1,054 – $1,958
Heat risk 5/10 · Moderate
- Hot days now (above 107°F)
- 7 days/yr
- Hot days in 30 yrs
- 21 days/yr
Wind risk 2/10 · Minimal
- Chance of severe wind over 30 yrs
- 1.0%
Air-quality risk 4/10 · Minor
- Unhealthy air days now
- 4 days/yr
- Unhealthy air days in 30 yrs
- 5 days/yr
Risk factors via First Street. Map © Google.
Why this score? — see what drove the C+ grade
The composite is a weighted blend of 9 inputs, each scored 0–100. Each bar is that input's sub-score; the figure is the points it added to the 100-point composite (weight × sub-score).
- Cash flow +25.9/30.0
- DSCR +8.7/10.0
- Appreciation +6.9/10.0
- 1% rule +6.7/10.0
- Rent growth +3.7/5.0
- Livability +3.4/5.0
- Condition / age +2.5/5.0
- ARV discount +2.4/15.0
- Schools +1.1/10.0
$113,000
🖨 Deal sheet 📄 Offer letter ✓ Due diligence
Listing remarks MLS
Cash flowing rental opportunity with built in flexibility! This performing asset is currently generating $1,200 per month on a month-to-month lease, resident pays all utilities. Perfect for investors seeking immediate cash flow, lease flexibility for rent optimization and strong rental demand in a consistent St. Louis submarket. Buyer to perform due diligence.
Key facts
- 0.25 acre lot
- Garage
- Built 1956
Neighborhood map
What this means for you Summary
Snapshot
- This is a 3-bed/1.0-bath single-family listed at $113k.
Deal economics
- At list price, monthly cash flow is $276 ($3k/yr) — positive.
- The deal already cash-flows at list — no discount required.
- Meets the 1% rule at list price ($1k rent vs $113k).
- Recommended offer: $103k (9.0% below list) — sets the bar for market timing.
- Cap rate 9.2% vs local median 12.2% in Jennings — below-typical yield; the buyer is paying a premium for something (appreciation thesis, condition, location) that the cap rate doesn't capture.
Location & tenants
- Location reads 67/100 on livability (#208 in MO) — a middle-class / working-renter tenant base. Strengths: cost of living A+, commute A-, housing A-; Watch: schools D-, crime F, amenities F.
- Jennings (suburban): math 8% / reading 20% proficiency, ranked #315 of 324 in MO (top 97%) — low school quality limits family demand, transient renter base, plan for 1-2y turnover; 86% free/reduced lunch — lower-income household profile, screen leases tightly.
- Market conditions: Rents rising fast (+5.0%/yr); 372 active listings in the ZIP; 40 comparable units currently listed for rent nearby; rentals at typical pace (median 24d on market — plan ~3-4 weeks tenant-placement turnaround); 45% of comp listings sitting > 30 days — soft ceiling on asking rent; lower-income renter base — watch delinquency; 920 units permitted in St. Louis County in 2024 (250 in 5+ unit buildings).
- This rent runs 39% of the median local income ($41k/yr) — at the standard rent-burdened threshold; future hikes will face affordability resistance.
Forward outlook
- In year one you build about $5k of equity ($781 loan paydown + $4k appreciation (3.8% local appreciation)).
- At projected returns (3.8% appreciation + 5.0% rent growth), your $32k cash investment doubles in ~4 years — after that, you're playing with house money.
- By year 7, paydown + projected appreciation supports a ~$32k cash-out refi (75% LTV) — recoverable capital for the next deal without selling this one.
Negotiation context
- It's been on market 109 days — a 9% lower offer ($103k) is reasonable based on typical stale-listing flexibility.
- 2 sale attempts since 3y ago with the ask held roughly flat each time — persistent listings suggest the price (not the market) is what's stuck; bring a comps-based counter.
Risks & watch-outs
- Watch-outs: built in 1956 — expect roof / HVAC / electrical / plumbing capex.
- Climate carrying-cost: extreme-heat days projected 7→21/yr by 2055 (HVAC capex compounding) — expect insurance premiums to compound above CPI over the hold.
Questions for the listing agent
- It's been on market 109 days. Have you received any prior offers? Is the seller open to a 9% concession, seller financing, or rate buy-down credit?
- Built in 1956 — when were the roof, HVAC, electrical panel, plumbing, and water heater last replaced?
- Why hasn't it sold? Are there any deal-killer items the seller is aware of (foundation, flood, title, zoning, code violations)?
- Is there a deadline driving the sale (1031 exchange, divorce, estate, relocation)? That informs how much negotiation room exists.
- Schools are D-rated, which usually means shorter tenancies and higher turnover. Who's the typical renter profile here, and what's been the actual vacancy rate?
- Crime grade is F in this area — have there been break-ins, vandalism, or insurance claims at this property in the last 3 years? What carrier currently insures it and at what premium?
- What's the average days-on-market for RENTAL listings here right now (not sales)? A rising rental-DOM trend means longer vacancies and softer asking-rent achievability than the comps imply.
- What's the recent tenant-quality profile in this submarket — average credit score on applications, eviction rate, late-payment / NSF rate, and stable-employment percentage? A property-management company in the area should have these aggregated.
- How much new for-sale + rental construction is in the pipeline within 1–3 miles? Heavy new supply typically softens prices + rents 12–24 months out; constrained supply supports both.
Investment metrics
- 1% rule
- 1.17% ✓
- Cap rate
- 9.22%
- Cash-on-cash
- 10.47%
- DSCR
- 1.47
- GRM
- 7.1
CMA / ARV
- ARV (median comp)
- $101,438
- List price
- $113,000
- Delta
- 11.40%
- Verdict
- OVERPRICED
- Comps
- 20 within 1.0 mi
Show comp detail 12 sales within ~0.75 mi
| Address | Dist | Beds/Ba | Sqft | Sold | Price | $/sf | Match |
|---|---|---|---|---|---|---|---|
| 9305 Scottdale Ave | 0.43mi | 3/2.0 | 1,280 (-4%) | 3mo | $60,000 | $47 | 67 |
| 3021 Glade Ave | 0.13mi | 4/1.0 (+1) | 1,176 (-12%) | 6mo | $99,000 | $84 | 64 |
| 312 Ward Dr | 0.65mi | 3/2.0 | 1,375 (+3%) | 1mo | $145,000 | $105 | 60 |
| 2725 Solway Ave | 0.28mi | 3/1.5 | 1,216 (-9%) | 13mo | $39,900 | $33 | 59 |
| 7520 Calvin Ave | 0.67mi | 3/1.0 | 1,326 (-0%) | 14mo | $130,000 | $98 | 56 |
| 9307 Scottdale Ave | 0.43mi | 3/1.0 | 1,280 (-4%) | 22mo | $115,000 | $90 | 55 |
| 8721 College Ave | 0.73mi | 2/1.0 (-1) | 1,336 (+0%) | 8mo | $129,900 | $97 | 54 |
| 9706 Newton Dr | 0.73mi | 3/2.0 | 1,310 (-2%) | 9mo | $208,000 | $159 | 52 |
| 8346 Willett Ave | 0.62mi | 3/1.5 | 1,300 (-2%) | 21mo | $97,500 | $75 | 48 |
| 2538 Oepts Ave | 0.66mi | 3/1.5 | 1,144 (-14%) | 7mo | $40,000 | $35 | 38 |
| 2531 Oepts Ave | 0.66mi | 3/1.0 | 1,198 (-10%) | 17mo | $139,900 | $117 | 38 |
| 9713 Lorna Ln | 0.73mi | 4/1.0 (+1) | 1,212 (-9%) | 19mo | $50,000 | $41 | 30 |
Match score weights: distance 35% · size 25% · config 20% · recency 20%. Top-matched comps best support the ARV.
Projected returns pro-forma
3.79% appreciation · 4.97% rent growth · sell at horizon
- IRR
- 20.3%
- Equity multiple
- 2.22×
- Total profit
- $38,673
- Equity at exit
- $55,911
- IRR
- 21.9%
- Equity multiple
- 4.53×
- Total profit
- $111,568
- Equity at exit
- $90,362
Cash invested: $31,640 (down + closing). Projections, not guarantees.
Landlord ↔ Tenant lean methodology
- Overall (STATE)
- 81 Strongly Landlord-Friendly
- State Missouri
- 81 Strongly Landlord-Friendly · R+10
- County
- — inherits STATE
- City
- — inherits STATE
ZIP-level market 63136
- Home prices YoY
- 0.9%
- Rents YoY
- 5.0%
- Active inventory
- 372
- Price-to-rent
- 7.1×
Monthly cashflow live
- Estimated rent
- $1,323 high interval (Pro) →
- Mortgage (P&I)
- −$593
- Tax from tax record
- −$129 /mo · $1,554/yr
- Insurance
- −$47
- HOA
- −$0
- Vacancy / Maint / Mgmt
- −$278
- Net cashflow
- $276
Break-even live
UW: 25.0% down · 7.5% · 30yr · 1.5% tax · 5.0% vac · 8.0% maint · 8.0% mgmt
Financing live
Cash to close
- Down payment
- $28,250
- Closing costs
- $3,390
- Reserves months
- —
- Total cash needed
- —
Loan-product check · same deal, 3 products live
Conventional
25% down · 7.5% · 30yr
- Down + closing
- —
- Monthly P&I
- —
- Monthly cashflow
- —
- DSCR
- —
- Eligible?
- —
Personal DTI + credit; lowest rate.
DSCR
20% down · 8.5% · 30yr
- Down + closing
- —
- Monthly P&I
- —
- Monthly cashflow
- —
- DSCR
- —
- Eligible?
- —
No personal income docs; deal must DSCR.
Hard money
10% down · 12.0% · 12mo
- Down + closing
- —
- Monthly P&I
- —
- Monthly cashflow
- —
- DSCR
- —
- Eligible?
- —
Short-term bridge; refi at stabilization.
Rent comps 40 comps
| Address | Beds | Baths | Sqft | Rent | $/sqft | DOM | Units | Dist |
|---|---|---|---|---|---|---|---|---|
| 8824 Huiskamp Ave Saint Louis, MO | 4.0 | 1.0 | 1548 | $1,200 | $0.78 | 23d | 1 | 0.30mi |
| 2646 Terrace Ln Saint Louis, MO | 3.0 | 2.0 | 1565 | $1,275 | $0.81 | 23d | 1 | 0.48mi |
| 1550 Northwinds Estates Dr St. Louis, MO | 1.0–2.0 | 1.0–1.5 | 877 | $1,050 | $1.20 | 43d | 1 | 0.51mi |
| 2623 Avie Dr Saint Louis, MO | 3.0 | 2.0 | 921 | $1,350 | $1.47 | 43d | 1 | 0.54mi |
| 9547 Glen Owen Dr Saint Louis, MO | 2.0 | 1.0 | 923 | $985 | $1.07 | 23d | 1 | 0.55mi |
| 9717 Dennis Dr Saint Louis, MO | 3.0 | 1.0 | 1056 | $1,323 | $1.25 | 43d | 1 | 0.66mi |
| 2546 Main St Saint Louis, MO | 4.0 | 1.0 | 984 | $1,269 | $1.29 | 43d | 1 | 0.69mi |
| 2527 Switzer Ave Saint Louis, MO | 3.0 | 1.0 | 888 | $1,135 | $1.28 | 16d | 1 | 0.73mi |
| 7441 Calvin Ave Saint Louis, MO | 3.0 | 1.0 | 1068 | $1,350 | $1.26 | 12d | 1 | 0.75mi |
| 9725 Medford Dr Saint Louis, MO | 3.0 | 1.0 | 912 | $1,485 | $1.63 | 43d | 1 | 0.78mi |
| 7426 Calvin Ave Saint Louis, MO | 2.0 | 1.0 | 1100 | $1,125 | $1.02 | 17d | 1 | 0.79mi |
| 9750 Lorna Ln Saint Louis, MO | 3.0 | 1.0 | 1032 | $1,100 | $1.07 | 43d | 1 | 0.82mi |
| 2427 Switzer Ave Saint Louis, MO | 3.0 | 1.0 | 1008 | $1,300 | $1.29 | 43d | 1 | 0.83mi |
| 7 Lamar Dr Saint Louis, MO | 3.0 | 1.0 | 894 | $1,200 | $1.34 | 17d | 1 | 0.83mi |
| 2415 Shirley Ave Saint Louis, MO | 3.0 | 1.0 | 990 | $1,450 | $1.46 | 23d | 1 | 0.86mi |
| 8720 Akins Dr Saint Louis, MO | 2.0 | 1.0 | 1012 | $1,150 | $1.14 | 23d | 1 | 0.88mi |
| 9709 Balboa Dr Saint Louis, MO | 3.0 | 1.0 | 1000 | $1,600 | $1.60 | 43d | 1 | 0.92mi |
| 8883 Saint Cyr Dr Saint Louis, MO | 2.0 | 1.0 | 1632 | $1,200 | $0.74 | 43d | 1 | 0.94mi |
| 6188 Dupree Ave Saint Louis, MO | 3.0 | 1.5 | 972 | $1,300 | $1.34 | 43d | 1 | 0.95mi |
| 44 Jendale Ct Saint Louis, MO | 2.0 | 2.0 | 1820 | $1,350 | $0.74 | 23d | 1 | 0.96mi |
| 7420 Pleaseway Dr Saint Louis, MO | 2.0 | 1.0 | 952 | $1,250 | $1.31 | 21d | 1 | 0.96mi |
| 1733 Kappel Ave Saint Louis, MO | 3.0 | 1.0 | 912 | $1,250 | $1.37 | 23d | 1 | 0.97mi |
| 9839 Medford Dr Saint Louis, MO | 3.0 | 1.0 | 912 | $1,095 | $1.20 | 43d | 1 | 1.00mi |
| 5640 Sapphire Ave Saint Louis, MO | 2.0 | 1.0 | 900 | $1,100 | $1.22 | 43d | 1 | 1.00mi |
| 6170 Emerald Ave Saint Louis, MO | 3.0 | 1.0 | 1286 | $1,425 | $1.11 | 1d | 1 | 1.01mi |
| 6170 Emerald Ave Saint Louis, MO | 3.0 | 1.0 | 1286 | $1,500 | $1.17 | 14d | 1 | 1.01mi |
| 9845 Dennis Dr Saint Louis, MO | 3.0 | 1.0 | 960 | $1,550 | $1.61 | 12d | 1 | 1.02mi |
| 9812 Balboa Dr Saint Louis, MO | 4.0 | 2.0 | 1500 | $1,495 | $1.00 | 21d | 1 | 1.02mi |
| 296 Meadowcrest Dr Saint Louis, MO | 3.0 | 1.0 | 960 | $1,550 | $1.61 | 14d | 1 | 1.03mi |
| 9840 Medford Dr Saint Louis, MO | 3.0 | 1.0 | 912 | $1,095 | $1.20 | 43d | 1 | 1.03mi |
| 9850 Dennis Dr Saint Louis, MO | 2.0 | 1.0 | 1032 | $1,175 | $1.14 | 43d | 1 | 1.04mi |
| 945 Edgehill Dr Saint Louis, MO | 3.0 | 1.0 | 1110 | $1,575 | $1.42 | 43d | 1 | 1.06mi |
| 9868 Lorna Ln Saint Louis, MO | 3.0 | 1.0 | 1032 | $1,175 | $1.14 | 43d | 1 | 1.10mi |
| 8817 Shady Grove Ave Saint Louis, MO | 2.0 | 1.0 | 1085 | $1,075 | $0.99 | 23d | 1 | 1.11mi |
| 104 Fenwick Dr Saint Louis, MO | 3.0 | 1.0 | 960 | $1,250 | $1.30 | 23d | 1 | 1.13mi |
| 7315 Albright Ave Saint Louis, MO | 3.0 | 1.0 | 888 | $1,150 | $1.30 | 43d | 1 | 1.13mi |
| 5830 Bermuda Dr Unit 30B St. Louis, MO | 2.0 | 1.0 | 900 | $895 | $0.99 | 23d | 1 | 1.13mi |
| 227 Meadowcrest Dr Saint Louis, MO | 3.0 | 1.0 | 960 | $1,500 | $1.56 | 43d | 1 | 1.16mi |
| 249 S Hartnett Ave Saint Louis, MO | 3.0 | 1.0 | 960 | $1,220 | $1.27 | 23d | 1 | 1.17mi |
| 7218 Albright Ave Saint Louis, MO | 2.0 | 1.0 | 1100 | $980 | $0.89 | 23d | 1 | 1.20mi |
Listing history 7 events
-
2026-05-31days on market $113,000 Active 109 DOM
-
2026-04-13price $113,000 362-char remark
Show marketing remark (362 chars)
Cash flowing rental opportunity with built in flexibility! This performing asset is currently generating $1,200 per month on a month-to-month lease, resident pays all utilities. Perfect for investors seeking immediate cash flow, lease flexibility for rent optimization and strong rental demand in a consistent St. Louis submarket. Buyer to perform due diligence.
-
2026-02-11$118,000 Active 362-char remark
Show marketing remark (362 chars)
Cash flowing rental opportunity with built in flexibility! This performing asset is currently generating $1,200 per month on a month-to-month lease, resident pays all utilities. Perfect for investors seeking immediate cash flow, lease flexibility for rent optimization and strong rental demand in a consistent St. Louis submarket. Buyer to perform due diligence.
-
2024-04-05soldstatus Closed 635-char remark
Show marketing remark (635 chars)
This property is part of a 7-single family home portfolio - 1695 Crowder Dr. Florissant MO 63031; 324 N. Floridale Ave, St. Louis MO 63135; 330 N. Floridale Ave. St. Louis MO 63135, 1917 Hildred Ave. St. Louis MO 63136, 11043 Landseer Dr. St. Louis MO 63136, 836 Marias Dr. St. Louis MO 63137, 3012 Solway Ave. St. Louis MO 63136. Each home has its own list price or list price for the entire bundle is $612,000. No sign in yard. Please do not disturb tenants. No showings permitted prior to accepted contract. Home is being sold As Is; seller to do no repairs or inspections of any kind. Must submit offers on Special Sales Contract.
-
2024-02-08status Pending 635-char remark
Show marketing remark (635 chars)
This property is part of a 7-single family home portfolio - 1695 Crowder Dr. Florissant MO 63031; 324 N. Floridale Ave, St. Louis MO 63135; 330 N. Floridale Ave. St. Louis MO 63135, 1917 Hildred Ave. St. Louis MO 63136, 11043 Landseer Dr. St. Louis MO 63136, 836 Marias Dr. St. Louis MO 63137, 3012 Solway Ave. St. Louis MO 63136. Each home has its own list price or list price for the entire bundle is $612,000. No sign in yard. Please do not disturb tenants. No showings permitted prior to accepted contract. Home is being sold As Is; seller to do no repairs or inspections of any kind. Must submit offers on Special Sales Contract.
-
2023-08-09$118,000 Active 635-char remark
Show marketing remark (635 chars)
This property is part of a 7-single family home portfolio - 1695 Crowder Dr. Florissant MO 63031; 324 N. Floridale Ave, St. Louis MO 63135; 330 N. Floridale Ave. St. Louis MO 63135, 1917 Hildred Ave. St. Louis MO 63136, 11043 Landseer Dr. St. Louis MO 63136, 836 Marias Dr. St. Louis MO 63137, 3012 Solway Ave. St. Louis MO 63136. Each home has its own list price or list price for the entire bundle is $612,000. No sign in yard. Please do not disturb tenants. No showings permitted prior to accepted contract. Home is being sold As Is; seller to do no repairs or inspections of any kind. Must submit offers on Special Sales Contract.
-
1990-06-01soldstatus
ⓘ Source: listings_history table (triggers on properties + properties_extension) + one-shot
backfill from property_details.listing_events for pre-trigger history.
Tax reassessment forecast MO · Resets to sale price
- Current annual tax
- $1,554 · $129/mo
- Projected year-2 tax
- $1,554 · $129/mo
- Expected delta
- $0/yr ($0/mo · 0.0%)
ⓘ Screening estimate from a state-policy table — verify with the county assessor before closing.
Climate risk First Street
- Flood 1/10 Low FEMA zone X (unshaded) · 0% chance over 30 yrs
- Wildfire 1/10 Low
- Heat 5/10 Major 7 d/yr ≥107°F today · 21 d/yr by 30 yrs out
- Wind 2/10 Low 100% chance of damaging wind over 30 yrs
- Air quality 4/10 Moderate 4 unhealthy d/yr today · 5 by 30 yrs out
Nearby sold comps map
Loading sold comps map…
Walkable amenities ~0.75 mi
Loading nearby amenities…
Taxation est. · year 1
- Rental income
- $15,876
- − Mortgage interest
- −$6,330
- − Property taxes
- −$1,554
- − Insurance
- −$565
- − Repairs & maintenance
- −$1,270
- − Management
- −$1,270
- − Depreciation
- −$3,287
- Taxable income
- $1,600
- Est. tax owed @ 24.0%
- −$384
- After-tax cash flow
- $2,928/yr
For passive investors: Depreciation is non-cash, so a rental often shows a tax loss while cash-flowing — sheltering income. Rental losses are passive: they offset passive income freely, and up to $25,000/yr can offset ordinary (W-2) income if you actively participate and your MAGI is under $100k (phasing out to $0 by $150k); unused losses carry forward. On sale, claimed depreciation is recaptured at up to 25%, and gains may owe capital-gains tax (a 1031 exchange can defer both). Figures are a year-1 estimate at your 24.0% rate — not tax advice; consult a CPA.
Schools (NCES district)
- District
- Jennings
- NCES district ID
- 2916290
- Math proficiency
- 8% ▼ -16.00%
- Reading proficiency
- 20% ▼ -4.00%
- Median HH income
- $30,595
- Composite
- 11.04/100
- National rank
- #9739
- State rank
- #315 of 324 in MO
Livability — Jennings
- Score
- 67/100
- State rank
- #208
- US rank
- #10499
Category grades
Schools grade is shown separately in the Schools card above.
Census & demographics
- Census place
- Jennings, MO
- County
- Saint Louis County · 888,823 people
- Metro
- St. Louis, MO-IL
- Population (ZIP)
- 40,929
- Household income
- $41,154
- Rent vs Own
- Severe rent burden
- 3085.0
Population outlook (St. Louis County) Hauer SSP2
- Today (2025)
- 1,025,227 people
- By 2030
- 1,028,023 · +0.3%
- By 2040
- 1,020,940 · -0.4%
- By 2050
- 1,007,280 · -1.8%
- By 2075
- 987,277 · -3.7%
- By 2100
- 921,984 · -10.1%
Race, ethnicity, and origin ACS 2023
- Neighborhood character
- Predominantly Black (90%)
- Race & ethnicity
- Black 90% White 5% Two or more races 3%
- Foreign-born
- 1% · Canada
Political lean MEDSL · St. Louis
- 2024 margin
- Strong D (+23.4) · D 60.8% · R 37.4% · Other 1.7%
- 2008→2024 swing
- +3.5pp toward D · 2008: 19.9pp · 2024: 23.4pp
- All cycles
- 2024: D+23.4 2020: D+24.0 2016: D+16.2 2012: D+13.7 2008: D+19.9
Not yet ingested
- Civics
- —
Market trends
- HPI YoY
- ▲ 3.79%
- Current HPI
- 420.28
- Rent YoY
- ▲ 4.97%
- Metro
- St. Louis, MO-IL
- State GDP YoY
- ▲ 1.84%
- F500 in state
- 20
Industry mix (Fortune 500 HQ in MO)
| Industry | F500 HQs | Revenue |
|---|---|---|
| Healthcare | 1 | $163B |
|
||
| Insurance | 1 | $21B |
|
||
| Industrial Technology | 1 | $17B |
|
||
| Retail | 1 | $16B |
|
||
| Industrial Distribution | 1 | $10B |
|
||
| Utilities | 1 | $9B |
|
||
Price history
-4.2% since first listed6 events — show timeline
- 2026-04-13 Price Changed $113,000 MARIS as Distributed by MLS Grid
- 2026-02-11 Listed $118,000 MARIS as Distributed by MLS Grid
- 2024-04-05 Sold (MLS) — MARIS as Distributed by MLS Grid
- 2024-02-08 Pending — MARIS as Distributed by MLS Grid
- 2023-08-09 Listed $118,000 MARIS as Distributed by MLS Grid
- 1990-06-01 Sold (Public Records) — Public Records
Property tax history
+1.6%/yrLatest (2022): $1,554 · +1.5% YoY. Source: county tax records.
Cash-flow waterfall
monthlySold comps — $/sqft
last 12 mo · ≤1 miLoading sold comps…