 🏗️ New Construction
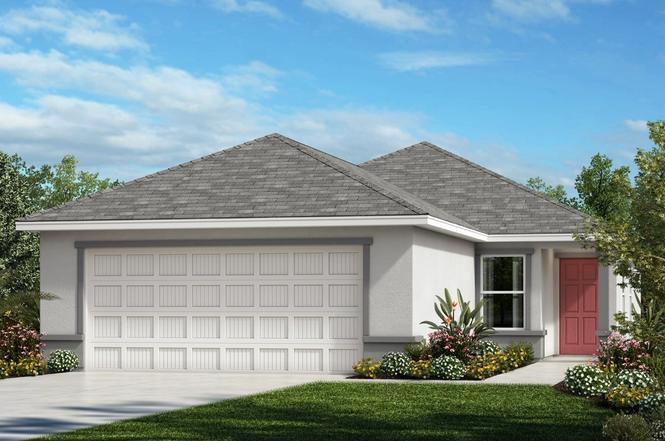
Plan 1346 Plan · Memphis, FL
Flood risk 1/10 · Minimal
- FEMA flood zone
- X (unshaded)
- Chance of flooding over 30 yrs
- 0.0%
- Est. flood insurance / yr
- $507 – $1,088
Fire risk 3/10 · Minor
- Est. fire insurance / yr
- $947 – $1,759
Heat risk 10/10 · Severe
- Hot days now (above 107°F)
- 7 days/yr
- Hot days in 30 yrs
- 26 days/yr
Wind risk 10/10 · Severe
- Chance of severe wind over 30 yrs
- 99.0%
Air-quality risk 3/10 · Minor
- Unhealthy air days now
- 3 days/yr
- Unhealthy air days in 30 yrs
- 3 days/yr
Risk factors via First Street. Map © Google.
Why this score? — see what drove the D- grade
The composite is a weighted blend of 9 inputs, each scored 0–100. Each bar is that input's sub-score; the figure is the points it added to the 100-point composite (weight × sub-score).
- Cash flow +11.1/30.0
- ARV discount +7.5/15.0
- Schools +4.4/10.0
- 1% rule +3.2/10.0
- DSCR +3.2/10.0
- Livability +3.2/5.0
- Condition / age +2.5/5.0
- Rent growth +1.8/5.0
- Appreciation +0.0/10.0
$275,990
🖨 Deal sheet 📄 Offer letter ✓ Due diligence
Listing remarks
* Smart thermostat * Kitchen USB charging port * Extended dual-sink vanity at primary bath * Primary bedroom at rear of home for added privacy * Tile flooring at entry, kitchen, baths and laundry room * Stainless steel appliance package * Open floor plan * Spacious great room * Kitchen breakfast bar * Dedicated laundry room * Low-E windows * ENERGY STAR® certified home * Commuter-friendly location * Close to family friendly parks * Close to popular restaurants * Great shopping nearby * Pond * Hiking trails nearby
Key facts
- Low-e windows
- Tile flooring
- Smart thermostat
Tags
Property features AI
Finance
- Other: Listing status: Active; Inventory type: Plan (new construction inventory)
- Financial info: List price $267,990
Exterior
- Parking: 2 total parking spaces; 2-car garage
- Home design: Single-family plan (Plan 1346); Located in Palmetto, FL
- Exterior features: Living area of 1,346 (plan)
Interior
- Bedrooms: 3 bedrooms
- Bathrooms: 2 full bathrooms
- Interior features: Plan 1346 model
Neighborhood map
What this means for you Summary
Snapshot
- This is a 3-bed/2.0-bath single-family listed at $276k.
Deal economics
- At list price, monthly cash flow is $-119 ($-1k/yr) — negative.
- To cash-flow at today's rent, offer at most $275k (0.4% below list).
- To meet the 1% rule (rent ≥ 1% of price), the offer needs to be $240k (12.9% below list).
- Recommended offer: $240k (12.9% below list) — sets the bar for 1% rule.
- Cap rate 5.8% vs local median 4.5% in Memphis — meaningfully above typical; check what's discounted (condition, days-on-market, listing class) to confirm the premium yield is real.
Location & tenants
- Location reads 63/100 on livability (#745 in FL) — a middle-class / working-renter tenant base. Strengths: cost of living A+, housing A+; Watch: employment D+, schools F, amenities F.
- Manatee (suburban): math 54% / reading 50% proficiency, ranked #26 of 73 in FL (top 36%) — acceptable for families but not a draw, mixed tenant base, ~2y average lease.
- Market conditions: Rents soft (-3.0%/yr); 1160 active listings in the ZIP; 8 comparable units currently listed for rent nearby; rentals at typical pace (median 21d on market — plan ~3-4 weeks tenant-placement turnaround); solid renter incomes; 7,472 units permitted in Manatee County in 2024 (1,782 in 5+ unit buildings).
- This rent runs 37% of the median local income ($78k/yr) — at the standard rent-burdened threshold; future hikes will face affordability resistance.
Forward outlook
- Local home prices are declining (-3.0%/yr); year-one equity from $2k of loan paydown is wiped out by about $9k of value loss. Plan a longer hold.
- Manatee County population projected at +43% by 2050 — long-run rental-demand tailwind backs the buy-and-hold thesis.
Negotiation context
- It's been on market 284 days — a 12% lower offer ($243k) is reasonable based on typical stale-listing flexibility.
Risks & watch-outs
- Climate carrying-cost: severe wind risk, 99% chance of damaging wind over 30y; extreme-heat days projected 7→26/yr by 2055 (HVAC capex compounding) — expect insurance premiums to compound above CPI over the hold.
Questions for the listing agent
- What do current leases actually rent for vs. the listed asking? Can we see a recent rent roll and the last 12 months of T-12 income?
- It's been on market 284 days. Have you received any prior offers? Is the seller open to a 13% concession, seller financing, or rate buy-down credit?
- Why hasn't it sold? Are there any deal-killer items the seller is aware of (foundation, flood, title, zoning, code violations)?
- Is there a deadline driving the sale (1031 exchange, divorce, estate, relocation)? That informs how much negotiation room exists.
- Schools are F-rated, which usually means shorter tenancies and higher turnover. Who's the typical renter profile here, and what's been the actual vacancy rate?
- The area grade is low — what's the realistic commute time and amenity access for the typical tenant pool here? Any planned neighborhood developments (good or bad) we should know about?
- This sits on a lake — are riparian / water-frontage rights deeded with the parcel? Any dock permits, shoreline easements, or HOA water-use restrictions?
- What's the documented flood / surge / shoreline-erosion history here (FEMA AND non-FEMA — e.g., storm surge, creek backup, septic-field saturation)?
- Any water-quality or seasonal algae-bloom issues that affect tenant satisfaction or short-term-rental demand?
- What's the average days-on-market for RENTAL listings here right now (not sales)? A rising rental-DOM trend means longer vacancies and softer asking-rent achievability than the comps imply.
- What's the recent tenant-quality profile in this submarket — average credit score on applications, eviction rate, late-payment / NSF rate, and stable-employment percentage? A property-management company in the area should have these aggregated.
- How much new for-sale + rental construction is in the pipeline within 1–3 miles? Heavy new supply typically softens prices + rents 12–24 months out; constrained supply supports both.
Investment metrics
- 1% rule
- 0.82% ✗
- Cap rate
- 5.80%
- Cash-on-cash
- -1.75%
- DSCR
- 0.92
- GRM
- 10.1
CMA / ARV
- ARV (on-the-fly)
- $292,082
- Comps found
- 12
Show comp detail 12 sales within ~0.75 mi
| Address | Dist | Beds/Ba | Sqft | Sold | Price | $/sf | Match |
|---|---|---|---|---|---|---|---|
| 8761 Royal Acacia Ave | 0.10mi | 3/2.0 | 1,511 (+12%) | 4mo | $327,839 | $217 | 72 |
| 3208 Osteen Cv | 0.07mi | 3/2.0 | 1,511 (+12%) | 7mo | $313,850 | $208 | 70 |
| 9409 29th Ave E | 0.50mi | 3/2.0 | 1,305 (-3%) | 4mo | $280,000 | $215 | 68 |
| 2702 94th St E | 0.53mi | 3/2.0 | 1,343 (-0%) | 16mo | $320,000 | $238 | 61 |
| 3432 97th Ln E | 0.74mi | 3/2.0 | 1,405 (+4%) | 6mo | $290,000 | $206 | 53 |
| 2807 94th St E | 0.48mi | 3/2.0 | 1,425 (+6%) | 18mo | $390,000 | $274 | 53 |
| 4015 86th St E | 0.57mi | 3/2.0 | 1,540 (+14%) | 5mo | $315,447 | $205 | 45 |
| 9207 Optimist Way | 0.75mi | 3/2.0 | 1,489 (+11%) | 3mo | $289,999 | $195 | 45 |
| 8547 40th Cir E | 0.54mi | 3/2.0 | 1,540 (+14%) | 12mo | $430,000 | $279 | 41 |
| 9117 Optimist Way | 0.73mi | 2/2.0 (-1) | 1,489 (+11%) | 3mo | $279,999 | $188 | 41 |
| 3429 97th Ln E | 0.70mi | 3/2.0 | 1,148 (-15%) | 10mo | $280,000 | $244 | 34 |
| 3421 97th Ln E | 0.69mi | 3/2.0 | 1,148 (-15%) | 18mo | $305,000 | $266 | 28 |
Match score weights: distance 35% · size 25% · config 20% · recency 20%. Top-matched comps best support the ARV.
Projected returns pro-forma
-3.0% appreciation · 0.0% rent growth · sell at horizon
- IRR
- -22.6%
- Equity multiple
- 0.24×
- Total profit
- $-61,928
- Equity at exit
- $43,550
- IRR
- -27.1%
- Equity multiple
- -0.11×
- Total profit
- $-90,780
- Equity at exit
- $25,254
Cash invested: $81,783 (down + closing). Projections, not guarantees.
Landlord ↔ Tenant lean methodology
- Overall (STATE)
- 87 Strongly Landlord-Friendly
- State Florida
- 87 Strongly Landlord-Friendly · R+3
- County
- — inherits STATE
- City
- — inherits STATE
ZIP-level market 34221
- Rents YoY
- -3.0%
- Active inventory
- 1160
- Price-to-rent
- 9.6×
Monthly cashflow live
- Estimated rent
- $2,404 high interval (Pro) →
- Mortgage (P&I)
- −$1,532
- Tax est. 1.5%
- −$365 /mo · $4,381/yr
- Insurance
- −$122
- HOA
- −$0
- Vacancy / Maint / Mgmt
- −$505
- Net cashflow
- $-119
Break-even live
UW: 25.0% down · 7.5% · 30yr · 1.5% tax · 5.0% vac · 8.0% maint · 8.0% mgmt
Financing live
Cash to close
- Down payment
- $73,020
- Closing costs
- $8,762
- Reserves months
- —
- Total cash needed
- —
Loan-product check · same deal, 3 products live
Conventional
25% down · 7.5% · 30yr
- Down + closing
- —
- Monthly P&I
- —
- Monthly cashflow
- —
- DSCR
- —
- Eligible?
- —
Personal DTI + credit; lowest rate.
DSCR
20% down · 8.5% · 30yr
- Down + closing
- —
- Monthly P&I
- —
- Monthly cashflow
- —
- DSCR
- —
- Eligible?
- —
No personal income docs; deal must DSCR.
Hard money
10% down · 12.0% · 12mo
- Down + closing
- —
- Monthly P&I
- —
- Monthly cashflow
- —
- DSCR
- —
- Eligible?
- —
Short-term bridge; refi at stabilization.
Rent comps 8 comps
| Address | Beds | Baths | Sqft | Rent | $/sqft | DOM | Units | Dist |
|---|---|---|---|---|---|---|---|---|
| 9204 34th Ave E Palmetto, FL | 3.0 | 2.0 | 1100 | $1,800 | $1.64 | 11d | 1 | 0.33mi |
| 4014 84th Ct E Palmetto, FL | 3.0 | 2.0 | 1555 | $2,516 | $1.62 | 21d | 1 | 0.60mi |
| 4117 84th Ct E Palmetto, FL | 3.0 | 2.0 | 1448 | $2,466 | $1.70 | 21d | 1 | 0.67mi |
| 9117 Optimist Way Palmetto, FL | 2.0 | 2.0 | 1489 | $2,200 | $1.48 | 23d | 1 | 0.72mi |
| 9940 Mahaffey DR Palmetto, FL | 1.0–3.0 | 1.0–3.0 | 1106 | $2,044 | $1.85 | 23d | 1 | 1.04mi |
| 6045 Bird Key Pl Palmetto, FL | 1.0–3.0 | 1.0–2.0 | 986 | $2,445 | $2.48 | 3d | 220 | 1.04mi |
| 5020 Cedar Leaf Cir Palmetto, FL | 1.0–2.0 | 1.0–2.0 | 873 | $2,491 | $2.85 | 1d | 21 | 1.42mi |
| 9650 52nd Ave E Palmetto, FL | 1.0–3.0 | 1.0–2.0 | 1050 | $2,342 | $2.23 | 23d | 99 | 1.44mi |
Listing history 14 events
-
2026-06-18days on market $275,990 Active 284 DOM
-
2026-06-17pricedays on market $275,990 Active 283 DOM
-
2026-06-16days on market $270,990 Active 282 DOM
-
2026-06-15days on market $270,990 Active 281 DOM
-
2026-06-13days on market $270,990 Active 279 DOM
-
2026-06-13days on market $270,990 Active 278 DOM
-
2026-06-10days on market $270,990 Active 276 DOM
-
2026-06-09days on market $270,990 Active 275 DOM
-
2026-06-08days on market $270,990 Active 274 DOM
-
2026-06-08days on market $270,990 Active 273 DOM
-
2026-06-03days on market $270,990 Active 269 DOM
-
2026-06-02days on market $270,990 Active 268 DOM
-
2026-06-01days on market $270,990 Active 267 DOM
-
2026-05-31pricedays on market $270,990 Active 266 DOM
ⓘ Source: listings_history table (triggers on properties + properties_extension) + one-shot
backfill from property_details.listing_events for pre-trigger history.
Climate risk First Street
- Flood 1/10 Low FEMA zone X (unshaded) · 0% chance over 30 yrs
- Wildfire 3/10 Moderate
- Heat 10/10 Extreme 7 d/yr ≥107°F today · 26 d/yr by 30 yrs out
- Wind 10/10 Extreme 99% chance of damaging wind over 30 yrs
- Air quality 3/10 Moderate 3 unhealthy d/yr today · 3 by 30 yrs out
Nearby sold comps map
Loading sold comps map…
Walkable amenities ~0.75 mi
Loading nearby amenities…
Taxation est. · year 1
- Rental income
- $28,851
- − Mortgage interest
- −$16,361
- − Property taxes
- −$4,381
- − Insurance
- −$1,460
- − Repairs & maintenance
- −$2,308
- − Management
- −$2,308
- − Depreciation
- −$8,497
- Taxable loss
- −$6,465
- Est. tax savings @ 24.0%
- +$1,552
- After-tax cash flow
- $122/yr
For passive investors: Depreciation is non-cash, so a rental often shows a tax loss while cash-flowing — sheltering income. Rental losses are passive: they offset passive income freely, and up to $25,000/yr can offset ordinary (W-2) income if you actively participate and your MAGI is under $100k (phasing out to $0 by $150k); unused losses carry forward. On sale, claimed depreciation is recaptured at up to 25%, and gains may owe capital-gains tax (a 1031 exchange can defer both). Figures are a year-1 estimate at your 24.0% rate — not tax advice; consult a CPA.
Schools (NCES district)
- District
- Manatee
- NCES district ID
- 1201230
- Math proficiency
- 54% ▼ -6.00%
- Reading proficiency
- 50% ▼ -2.00%
- Median HH income
- $49,607
- Composite
- 44.43/100
- National rank
- #2806
- State rank
- #26 of 73 in FL
Livability — Memphis
- Score
- 63/100
- State rank
- #745
- US rank
- #16072
Category grades
Schools grade is shown separately in the Schools card above.
Census & demographics
- County
- Manatee County · 416,364 people
- Metro
- North Port-Sarasota-Bradenton, FL
- Population (ZIP)
- 56,208
- Household income
- $77,712
- Rent vs Own
- Severe rent burden
- 1193.0
Population outlook (Manatee County) Hauer SSP2
- Today (2025)
- 447,342 people
- By 2030
- 488,911 · +9.3%
- By 2040
- 567,934 · +27.0%
- By 2050
- 637,995 · +42.6%
- By 2075
- 781,970 · +74.8%
- By 2100
- 848,272 · +89.6%
Race, ethnicity, and origin ACS 2023
- Neighborhood character
- Diverse neighborhood (Simpson 0.58)
- Race & ethnicity
- White 59% Hispanic / Latino 22% Black 14% Two or more races 11%
- Hispanic origin (detail)
- Mexican 14% Puerto Rican 3%
- Common ancestry
- Romanian 2% Lithuanian 2% Italian 2%
- Foreign-born
- 10% · Canada, Dominican Republic, Jamaica
- Languages at home
- 81% English-only · Spanish 16% Other Indo-European 1%
Political lean MEDSL · Manatee
- 2024 margin
- Strong R (+23.5) · D 37.9% · R 61.4%
- 2008→2024 swing
- -16.5pp toward R · 2008: -7.0pp · 2024: -23.5pp
- All cycles
- 2024: R+23.5 2020: R+16.1 2016: R+17.1 2012: R+12.5 2008: R+7.0
Not yet ingested
- Civics
- —
Market trends
- HPI YoY
- ▼ -383.53%
- Current HPI
- 302.1458
- Rent YoY
- ▼ -2.98%
- Metro
- North Port-Sarasota-Bradenton, FL
- State GDP YoY
- ▲ 3.28%
- F500 in state
- 36
Industry mix (Fortune 500 HQ in FL)
| Industry | F500 HQs | Revenue |
|---|---|---|
| Industrial Technology | 2 | $29B |
|
||
| Insurance | 2 | $17B |
|
||
| Retail | 1 | $60B |
|
||
| Technology Distribution | 1 | $58B |
|
||
| Homebuilding | 1 | $35B |
|
||
| Technology Manufacturing | 1 | $35B |
|
||
Cash-flow waterfall
monthlySold comps — $/sqft
last 12 mo · ≤1 miLoading sold comps…