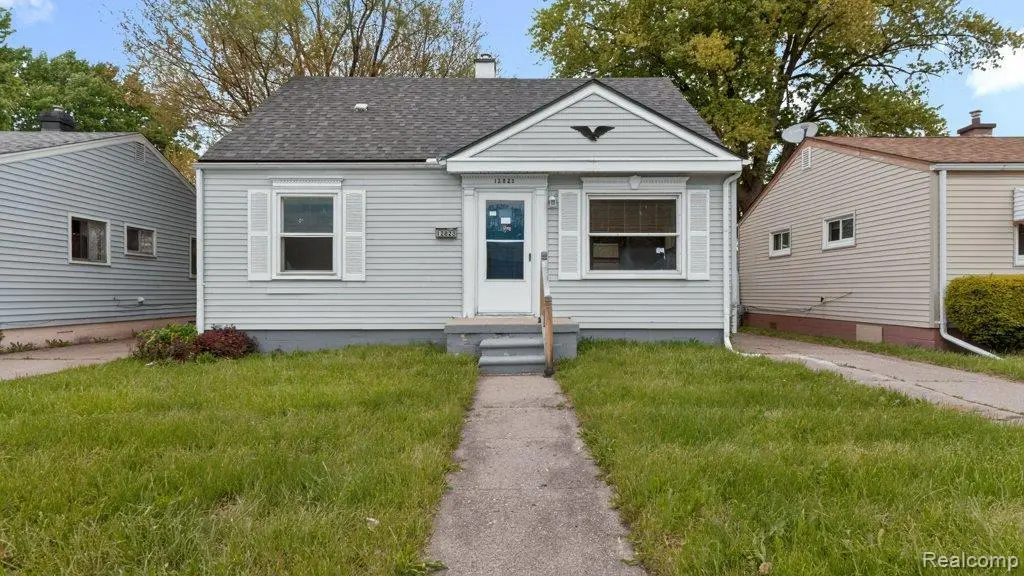
12823 Sherman Ave · Warren, MI
Flood risk 1/10 · Minimal
- FEMA flood zone
- X (unshaded)
- Chance of flooding over 30 yrs
- 0.0%
- Est. flood insurance / yr
- $507 – $1,088
Fire risk 1/10 · Minimal
- Est. fire insurance / yr
- $784 – $1,456
Heat risk 3/10 · Minor
- Hot days now (above 96°F)
- 7 days/yr
- Hot days in 30 yrs
- 15 days/yr
Wind risk 1/10 · Minimal
- Chance of severe wind over 30 yrs
- —
Air-quality risk 3/10 · Minor
- Unhealthy air days now
- 3 days/yr
- Unhealthy air days in 30 yrs
- 4 days/yr
Risk factors via First Street. Map © Google.
Why this score? — see what drove the C- grade
The composite is a weighted blend of 9 inputs, each scored 0–100. Each bar is that input's sub-score; the figure is the points it added to the 100-point composite (weight × sub-score).
- Cash flow +22.3/30.0
- ARV discount +7.5/15.0
- DSCR +7.2/10.0
- 1% rule +6.7/10.0
- Livability +3.7/5.0
- Rent growth +3.2/5.0
- Condition / age +2.5/5.0
- Schools +1.0/10.0
- Appreciation +0.0/10.0
$125,000
🖨 Deal sheet 📄 Offer letter ✓ Due diligence
Listing remarks MLS
Welcome to 12823 Sherman in Warren - a beautifully remodeled home offering the perfect blend of modern updates and everyday comfort. This move-in ready property features fresh paint throughout, updated fixtures, and stylish finishes that give the home a clean, contemporary feel. The kitchen stands out with granite countertops, ample cabinet space. Step outside to a sizable yard with plenty of room for gatherings, gardening, or relaxing evenings. Conveniently located near shopping, dining, parks, and major roadways, this home makes commuting and daily errands easy. Perfect for first-time buyers, growing families, or investors, 12823 Sherman offers exceptional value with thoughtful updates already completed. Don't miss this turnkey opportunity!
Key facts
- Sizable yard
- Ample cabinet space
- Granite countertops
Tags
Property features AI
Exterior
- Parking: Detached garage; Approximately 1.5 garage spaces
- Utilities: Public water; Public sewer; Electric with circuit breakers
- Home design: Single-family residence; One and one-half stories; Ground-level entry with steps
- Construction: Vinyl siding
- Exterior features: Asphalt roof; Paved road access; Lot approximately 0.1 acre (40 x 106)
Interior
- Kitchen: Gas range; Refrigerator
- Bedrooms: Total of 7 rooms (bedroom count not specified)
- Bathrooms: 1 full bathroom
- Heating & cooling: Forced air heating (natural gas); No cooling
- Interior features: Gas water heater; Free-standing gas range; Free-standing refrigerator
- Laundry & utility: Washer; Dryer
Neighborhood map
What this means for you Summary
Snapshot
- This is a 4-bed/1.0-bath single-family listed at $125k.
Deal economics
- At list price, monthly cash flow is $207 ($2k/yr) — positive.
- The deal already cash-flows at list — no discount required.
- Meets the 1% rule at list price ($1k rent vs $125k).
- Cap rate 8.3% vs local median 5.3% in Warren — top-decile yield for the area; either an underpriced asset or a hidden risk that comps aren't pricing in. Stress-test before assuming the spread holds.
Location & tenants
- Location reads 74/100 on livability (#171 in MI, #4,491 nationally) — a middle-class / working-renter tenant base. Strengths: commute A+, cost of living A+, housing A+; Watch: schools D, amenities D, employment D.
- Van Dyke Public Schools (urban): math 7% / reading 19% proficiency, ranked #512 of 540 in MI (top 95%) — low school quality limits family demand, transient renter base, plan for 1-2y turnover; 80% free/reduced lunch — lower-income household profile, screen leases tightly.
- Market conditions: Rents rising (+2.9%/yr); 160 active listings in the ZIP; 31 comparable units currently listed for rent nearby; rentals at typical pace (median 22d on market — plan ~3-4 weeks tenant-placement turnaround); 1,321 units permitted in Macomb County in 2024 (86 in 5+ unit buildings).
- This rent runs 33% of the median local income ($52k/yr) — at the standard rent-burdened threshold; future hikes will face affordability resistance.
Forward outlook
- Local home prices are declining (-3.0%/yr); year-one equity from $864 of loan paydown is wiped out by about $4k of value loss. Plan a longer hold.
- Macomb County population projected at +9% by 2050 — modest demand growth; plan on rents tracking national, not racing it.
Negotiation context
- Only 5 days on market — expect competitive offers; lowballing is unlikely to land.
- 5 sale attempts since 20y ago with the ask held roughly flat each time — persistent listings suggest the price (not the market) is what's stuck; bring a comps-based counter.
- Current owner paid $44k; list at $125k implies a 184% gain — meaningful room to come down on a strong offer.
Risks & watch-outs
- Watch-outs: built in 1953 — expect roof / HVAC / electrical / plumbing capex.
Questions for the listing agent
- Built in 1953 — when were the roof, HVAC, electrical panel, plumbing, and water heater last replaced?
- Is there a deadline driving the sale (1031 exchange, divorce, estate, relocation)? That informs how much negotiation room exists.
- Schools are D-rated, which usually means shorter tenancies and higher turnover. Who's the typical renter profile here, and what's been the actual vacancy rate?
- Crime grade is D in this area — have there been break-ins, vandalism, or insurance claims at this property in the last 3 years? What carrier currently insures it and at what premium?
- What's the average days-on-market for RENTAL listings here right now (not sales)? A rising rental-DOM trend means longer vacancies and softer asking-rent achievability than the comps imply.
- What's the recent tenant-quality profile in this submarket — average credit score on applications, eviction rate, late-payment / NSF rate, and stable-employment percentage? A property-management company in the area should have these aggregated.
- How much new for-sale + rental construction is in the pipeline within 1–3 miles? Heavy new supply typically softens prices + rents 12–24 months out; constrained supply supports both.
Investment metrics
- 1% rule
- 1.17% ✓
- Cap rate
- 8.28%
- Cash-on-cash
- 7.08%
- DSCR
- 1.32
- GRM
- 7.1
CMA / ARV
- ARV (on-the-fly)
- $52,200
- Comps found
- 12
Show comp detail 12 sales within ~0.75 mi
| Address | Dist | Beds/Ba | Sqft | Sold | Price | $/sf | Match |
|---|---|---|---|---|---|---|---|
| 13046 Sherman Ave | 0.12mi | 4/1.0 | 870 (0%) | 1mo | $120,000 | $138 | 94 |
| 12753 Georgiana Ave | 0.17mi | 3/1.0 (-1) | 888 (+2%) | 2mo | $120,000 | $135 | 82 |
| 20543 Waltham St | 0.39mi | 3/1.0 (-1) | 890 (+2%) | 1mo | $50,000 | $56 | 73 |
| 12416 Vernon Ave | 0.24mi | 3/1.0 (-1) | 944 (+8%) | 2mo | $128,000 | $136 | 68 |
| 20300 Hickory St | 0.52mi | 3/1.0 (-1) | 918 (+6%) | 1mo | $31,000 | $34 | 61 |
| 20200 Alcoy St | 0.57mi | 3/1.0 (-1) | 917 (+5%) | 2mo | $55,100 | $60 | 58 |
| 20075 Strasburg St | 0.66mi | 3/1.5 (-1) | 876 (+1%) | 5mo | $43,500 | $50 | 57 |
| 20218 Hickory St | 0.59mi | 3/1.0 (-1) | 930 (+7%) | 1mo | $26,000 | $28 | 55 |
| 20051 Alcoy St | 0.64mi | 3/1.0 (-1) | 910 (+5%) | 5mo | $20,000 | $22 | 53 |
| 20218 Goulburn St | 0.52mi | 3/1.0 (-1) | 965 (+11%) | 1mo | $12,000 | $12 | 52 |
| 13881 Carlisle St | 0.69mi | 3/1.0 (-1) | 940 (+8%) | 3mo | $59,200 | $63 | 47 |
| 20259 Bradford St | 0.64mi | 4/1.0 | 979 (+12%) | 4mo | $68,000 | $69 | 46 |
Match score weights: distance 35% · size 25% · config 20% · recency 20%. Top-matched comps best support the ARV.
Projected returns pro-forma
-3.0% appreciation · 2.94% rent growth · sell at horizon
- IRR
- -5.5%
- Equity multiple
- 0.80×
- Total profit
- $-7,113
- Equity at exit
- $18,638
- IRR
- 4.2%
- Equity multiple
- 1.31×
- Total profit
- $10,683
- Equity at exit
- $10,808
Cash invested: $35,000 (down + closing). Projections, not guarantees.
Landlord ↔ Tenant lean methodology
- Overall (STATE)
- 62 Landlord-Friendly
- State Michigan
- 62 Landlord-Friendly · EVEN
- County
- — inherits STATE
- City
- — inherits STATE
ZIP-level market 48089
- Rents YoY
- 2.9%
- Active inventory
- 160
- Price-to-rent
- 7.1×
Monthly cashflow live
- Estimated rent
- $1,458 high interval (Pro) →
- Mortgage (P&I)
- −$656
- Tax from tax record
- −$238 /mo · $2,854/yr
- Insurance
- −$52
- HOA
- −$0
- Vacancy / Maint / Mgmt
- −$306
- Net cashflow
- $207
Break-even live
UW: 25.0% down · 7.5% · 30yr · 1.5% tax · 5.0% vac · 8.0% maint · 8.0% mgmt
Financing live
Cash to close
- Down payment
- $31,250
- Closing costs
- $3,750
- Reserves months
- —
- Total cash needed
- —
Loan-product check · same deal, 3 products live
Conventional
25% down · 7.5% · 30yr
- Down + closing
- —
- Monthly P&I
- —
- Monthly cashflow
- —
- DSCR
- —
- Eligible?
- —
Personal DTI + credit; lowest rate.
DSCR
20% down · 8.5% · 30yr
- Down + closing
- —
- Monthly P&I
- —
- Monthly cashflow
- —
- DSCR
- —
- Eligible?
- —
No personal income docs; deal must DSCR.
Hard money
10% down · 12.0% · 12mo
- Down + closing
- —
- Monthly P&I
- —
- Monthly cashflow
- —
- DSCR
- —
- Eligible?
- —
Short-term bridge; refi at stabilization.
Rent comps 31 comps
| Address | Beds | Baths | Sqft | Rent | $/sqft | DOM | Units | Dist |
|---|---|---|---|---|---|---|---|---|
| 12846 Georgiana Ave Warren, MI | 3.0 | 1.0 | 912 | $1,300 | $1.43 | 24d | 1 | 0.18mi |
| 12807 Coleen Ave Warren, MI | 3.0 | 1.0 | 1080 | $1,250 | $1.16 | 24d | 1 | 0.19mi |
| 13050 Couwlier Ave Warren, MI | 3.0 | 1.0 | 850 | $1,350 | $1.59 | 24d | 1 | 0.22mi |
| 20553 Hamburg St Detroit, MI | 3.0 | 1.0 | 1074 | $1,300 | $1.21 | 3d | 1 | 0.40mi |
| 20296 Waltham St Detroit, MI | 3.0 | 1.5 | 986 | $1,300 | $1.32 | 17d | 1 | 0.42mi |
| 20242 Hickory St Detroit, MI | 3.0 | 1.0 | 747 | $1,300 | $1.74 | 11d | 1 | 0.55mi |
| 20091 Barlow St Detroit, MI | 3.0 | 1.0 | 930 | $1,300 | $1.40 | 17d | 1 | 0.57mi |
| 20227 Pelkey St Detroit, MI | 3.0 | 1.0 | 968 | $1,350 | $1.39 | 17d | 1 | 0.59mi |
| 20027 Alcoy St Detroit, MI | 3.0 | 1.0 | 1000 | $1,349 | $1.35 | 17d | 1 | 0.64mi |
| 22852 Sharrow Ave Warren, MI | 3.0 | 1.0 | 1000 | $1,400 | $1.40 | 4d | 1 | 0.72mi |
| 14068 Carlisle St Detroit, MI | 3.0 | 1.0 | 1020 | $1,300 | $1.27 | 24d | 1 | 0.84mi |
| 11319 Chalmers Ave Warren, MI | 3.0 | 1.0 | 975 | $1,500 | $1.54 | 24d | 1 | 0.91mi |
| 11076 Hudson Ave Warren, MI | 3.0 | 1.0 | 936 | $1,395 | $1.49 | 3d | 1 | 1.08mi |
| 13669 Pfent St Detroit, MI | 3.0 | 2.0 | 1031 | $1,374 | $1.33 | 17d | 1 | 1.16mi |
| 19220 Alcoy St Detroit, MI | 3.0 | 1.0 | 1023 | $1,350 | $1.32 | 17d | 1 | 1.17mi |
| 19170 Joann St Detroit, MI | 4.0 | 1.0 | 1020 | $1,400 | $1.37 | 43d | 1 | 1.20mi |
| 19143 Fairport St Detroit, MI | 3.0 | 1.0 | 1070 | $1,225 | $1.14 | 17d | 1 | 1.22mi |
| 8640 Chalmers Ave Warren, MI | 3.0 | 1.0 | 804 | $1,423 | $1.77 | 24d | 1 | 1.23mi |
| 8632 Studebaker Ave Warren, MI | 3.0 | 1.0 | 761 | $1,300 | $1.71 | 3d | 1 | 1.24mi |
| 8285 Rivard Ave Warren, MI | 3.0 | 1.0 | 902 | $1,549 | $1.72 | 24d | 1 | 1.39mi |
| 8693 Paige Ave Warren, MI | 3.0 | 1.0 | 900 | $1,300 | $1.44 | 24d | 1 | 1.40mi |
| 8242 Jackson Ave Warren, MI | 3.0 | 1.0 | 840 | $1,198 | $1.43 | 43d | 1 | 1.42mi |
| 8707 Continental Ave Warren, MI | 3.0 | 1.0 | 1100 | $1,200 | $1.09 | 4d | 1 | 1.42mi |
| 8707 Continental Ave Warren, MI | 3.0 | 1.0 | 968 | $1,200 | $1.24 | 17d | 1 | 1.42mi |
| 18681 Barlow St Detroit, MI | 3.0 | 1.0 | 1041 | $1,400 | $1.34 | 24d | 1 | 1.44mi |
| 11076 Essex Ave Warren, MI | 4.0 | 1.0 | 1072 | $1,400 | $1.31 | 43d | 1 | 1.46mi |
| 18624 Fairport St Unit NA Detroit, MI | 3.0 | 1.0 | 924 | $1,450 | $1.57 | 24d | 1 | 1.49mi |
| 18624 Fairport St Detroit, MI | 3.0 | 1.0 | 874 | $1,450 | $1.66 | 21d | 1 | 1.49mi |
| 14461 Lappin St Detroit, MI | 3.0 | 1.5 | 989 | $1,150 | $1.16 | 17d | 1 | 1.49mi |
| 8716 Timken Ave Warren, MI | 3.0 | 1.0 | 1008 | $1,400 | $1.39 | 24d | 1 | 1.49mi |
| 8251 Hudson Ave Warren, MI | 3.0 | 1.0 | 908 | $1,400 | $1.54 | 24d | 1 | 1.50mi |
Listing history 12 events
-
2026-05-21$125,000 Active
Show marketing remark (754 chars)
Welcome to 12823 Sherman in Warren - a beautifully remodeled home offering the perfect blend of modern updates and everyday comfort. This move-in ready property features fresh paint throughout, updated fixtures, and stylish finishes that give the home a clean, contemporary feel. The kitchen stands out with granite countertops, ample cabinet space. Step outside to a sizable yard with plenty of room for gatherings, gardening, or relaxing evenings. Conveniently located near shopping, dining, parks, and major roadways, this home makes commuting and daily errands easy. Perfect for first-time buyers, growing families, or investors, 12823 Sherman offers exceptional value with thoughtful updates already completed. Don't miss this turnkey opportunity!
-
2026-05-21$125,000 Active 754-char remark
Show marketing remark (754 chars)
Welcome to 12823 Sherman in Warren - a beautifully remodeled home offering the perfect blend of modern updates and everyday comfort. This move-in ready property features fresh paint throughout, updated fixtures, and stylish finishes that give the home a clean, contemporary feel. The kitchen stands out with granite countertops, ample cabinet space. Step outside to a sizable yard with plenty of room for gatherings, gardening, or relaxing evenings. Conveniently located near shopping, dining, parks, and major roadways, this home makes commuting and daily errands easy. Perfect for first-time buyers, growing families, or investors, 12823 Sherman offers exceptional value with thoughtful updates already completed. Don't miss this turnkey opportunity!
-
2025-03-30historical $1,499
-
2025-01-02price $1,499
-
2024-12-10$1,449
-
2006-08-30historical
-
2006-08-30historical
-
2006-05-01$80,000
-
2006-05-01$80,000
-
1991-05-13soldstatus $44,000
-
1989-12-08soldstatus $25,000
-
1989-12-08soldstatus $45,000
ⓘ Source: listings_history table (triggers on properties + properties_extension) + one-shot
backfill from property_details.listing_events for pre-trigger history.
Tax reassessment forecast MI · Partial reset (capped growth)
- Current annual tax
- $2,854 · $238/mo
- Projected year-2 tax
- $2,854 · $238/mo
- Expected delta
- $0/yr ($0/mo · 0.0%)
ⓘ Screening estimate from a state-policy table — verify with the county assessor before closing.
Climate risk First Street
- Flood 1/10 Low FEMA zone X (unshaded) · 0% chance over 30 yrs
- Wildfire 1/10 Low
- Heat 3/10 Moderate 7 d/yr ≥96°F today · 15 d/yr by 30 yrs out
- Wind 1/10 Low
- Air quality 3/10 Moderate 3 unhealthy d/yr today · 4 by 30 yrs out
Nearby sold comps map
Loading sold comps map…
Walkable amenities ~0.75 mi
Loading nearby amenities…
Taxation est. · year 1
- Rental income
- $17,500
- − Mortgage interest
- −$7,002
- − Property taxes
- −$2,854
- − Insurance
- −$625
- − Repairs & maintenance
- −$1,400
- − Management
- −$1,400
- − Depreciation
- −$3,636
- Taxable income
- $582
- Est. tax owed @ 24.0%
- −$140
- After-tax cash flow
- $2,340/yr
For passive investors: Depreciation is non-cash, so a rental often shows a tax loss while cash-flowing — sheltering income. Rental losses are passive: they offset passive income freely, and up to $25,000/yr can offset ordinary (W-2) income if you actively participate and your MAGI is under $100k (phasing out to $0 by $150k); unused losses carry forward. On sale, claimed depreciation is recaptured at up to 25%, and gains may owe capital-gains tax (a 1031 exchange can defer both). Figures are a year-1 estimate at your 24.0% rate — not tax advice; consult a CPA.
Schools (NCES district)
- District
- Van Dyke Public Schools
- NCES district ID
- 2634680
- Math proficiency
- 7% ▼ -11.00%
- Reading proficiency
- 19% ▼ -5.00%
- Median HH income
- $33,231
- Composite
- 10.46/100
- National rank
- #9784
- State rank
- #512 of 540 in MI
Livability — Warren
- Score
- 74/100
- State rank
- #171
- US rank
- #4491
Category grades
Schools grade is shown separately in the Schools card above.
Census & demographics
- Census place
- Warren, MI
- County
- Macomb County · 638,552 people
- City population
- 114,937
- Metro
- Detroit-Warren-Dearborn, MI
- Population (ZIP)
- 31,853
- Household income
- $52,366
- Rent vs Own
- Severe rent burden
- 1754.0
Population outlook (Macomb County) Hauer SSP2
- Today (2025)
- 925,296 people
- By 2030
- 948,226 · +2.5%
- By 2040
- 983,961 · +6.3%
- By 2050
- 1,010,200 · +9.2%
- By 2075
- 1,076,222 · +16.3%
- By 2100
- 1,077,065 · +16.4%
Race, ethnicity, and origin ACS 2023
- Neighborhood character
- Diverse neighborhood (Simpson 0.61)
- Race & ethnicity
- White 53% Black 31% Asian 7% Two or more races 6% Hispanic / Latino 3%
- Common ancestry
- Romanian 11% Lithuanian 3% Slovak 2%
- Foreign-born
- 5% · Canada
- Languages at home
- 92% English-only · Other Asian/Pacific 3% Other Indo-European 2% Arabic 1%
Political lean MEDSL · Macomb
- 2024 margin
- R (+13.7) · D 42.2% · R 55.9% · Other 1.9%
- 2008→2024 swing
- -22.3pp toward R · 2008: 8.6pp · 2024: -13.7pp
- All cycles
- 2024: R+13.7 2020: R+8.1 2016: R+11.6 2012: D+4.0 2008: D+8.6
Not yet ingested
- Civics
- —
Market trends
- HPI YoY
- ▼ -211.46%
- Current HPI
- 154.8325
- Rent YoY
- ▲ 2.94%
- Metro
- Detroit-Warren-Dearborn, MI
- State GDP YoY
- ▲ 1.37%
- F500 in state
- 28
Industry mix (Fortune 500 HQ in MI)
| Industry | F500 HQs | Revenue |
|---|---|---|
| Automotive Parts | 3 | $48B |
|
||
| Automotive | 2 | $372B |
|
||
| Chemicals | 1 | $45B |
|
||
| Automotive Retail | 1 | $29B |
|
||
| Healthcare / Medical Devices | 1 | $23B |
|
||
| Automotive Technology | 1 | $20B |
|
||
Price history
+400.0% since first listed12 events — show timeline
- 2026-05-21 Listed $125,000 MiRealSource-MiMLS
- 2026-05-21 Listed $125,000 REALCOMP
- 2025-03-30 Rental Removed $1,499 SHOWMOJO
- 2025-01-02 Price Changed $1,499 SHOWMOJO
- 2024-12-10 Listed for Rent $1,449 SHOWMOJO
- 2006-08-30 Listing Removed — REALCOMP
- 2006-08-30 Listing Removed — MiRealSource-MiMLS
- 2006-05-01 Listed $80,000 REALCOMP
- 2006-05-01 Listed $80,000 MiRealSource-MiMLS
- 1991-05-13 Sold (Public Records) $44,000 Public Records
- 1989-12-08 Sold (Public Records) $45,000 Public Records
- 1989-12-08 Sold (Public Records) $25,000 Public Records
Property tax history
+10.7%/yrLatest (2025): $2,854 · +4.3% YoY. Source: county tax records.
Cash-flow waterfall
monthlySold comps — $/sqft
last 12 mo · ≤1 miLoading sold comps…