126 Berry Hill Rd · South Pittsburg, TN
Flood risk 6/10 · Moderate
- FEMA flood zone
- X (unshaded)
- Chance of flooding over 30 yrs
- 0.74%
- Est. flood insurance / yr
- $507 – $1,088
Fire risk 4/10 · Minor
- Est. fire insurance / yr
- $949 – $1,763
Heat risk 5/10 · Moderate
- Hot days now (above 106°F)
- 7 days/yr
- Hot days in 30 yrs
- 19 days/yr
Wind risk 4/10 · Minor
- Chance of severe wind over 30 yrs
- 12.0%
Air-quality risk 3/10 · Minor
- Unhealthy air days now
- 2 days/yr
- Unhealthy air days in 30 yrs
- 2 days/yr
Risk factors via First Street. Map © Google.
Why this score? — see what drove the B- grade
The composite is a weighted blend of 9 inputs, each scored 0–100. Each bar is that input's sub-score; the figure is the points it added to the 100-point composite (weight × sub-score).
- Cash flow +30.0/30.0
- 1% rule +10.0/10.0
- DSCR +10.0/10.0
- ARV discount +7.5/15.0
- Livability +3.1/5.0
- Schools +2.7/10.0
- Rent growth +2.5/5.0
- Condition / age +2.5/5.0
- Appreciation +0.0/10.0
$75,000
🖨 Deal sheet 📄 Offer letter ✓ Due diligence
Listing remarks MLS
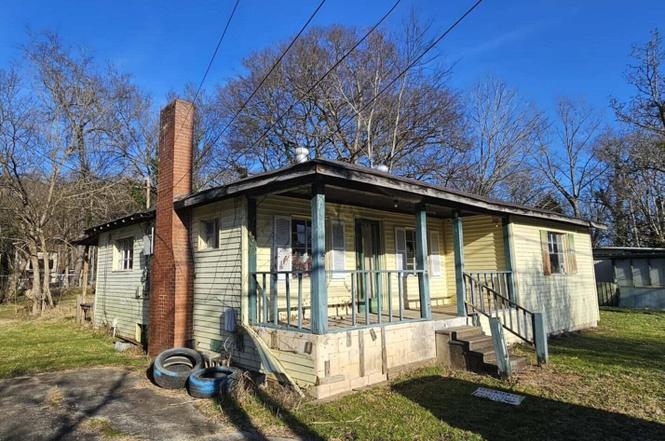
Calling all investors! With beautiful mountain views from its rocking chair front porch, a large lot surrounded by mature trees, & only minutes to the historic downtown of South Pittsburg shopping, businesses, & schools, this investment home provides a canvas for a fresh take on southern living. There is a separate-standing home built in 1920 on the property. Contractor or Investor special! Two properties for the price of one on a large city lot. Would make a great rental property.
Key facts
- Historic downtown
- Large lot
- Mountain views
Tags
Property features AI
Finance
- Financial info: $1,034 annual tax (tax amount provided)
Exterior
- Parking: Detached parking
- Utilities: Public water; Septic tank
- Home design: Single-family residence; Residential property; Existing (year built not specified)
- Construction: Other construction materials
- Exterior features: Approximately 0.48-acre lot; Water available
Interior
- Bedrooms: 2 bedrooms
- Bathrooms: 1 full bathroom
- Heating & cooling: No central cooling
- Interior features: Three or more levels; Block foundation
Neighborhood map
What this means for you Summary
Snapshot
- This is a 2-bed/1.0-bath single-family listed at $75k.
Deal economics
- At list price, monthly cash flow is $409 ($5k/yr) — positive.
- The deal already cash-flows at list — no discount required.
- Meets the 1% rule at list price ($1k rent vs $75k).
- Recommended offer: $66k (12.0% below list) — sets the bar for market timing.
Location & tenants
- Location reads 62/100 on livability (#218 in TN) — a middle-class / working-renter tenant base. Strengths: crime A+, cost of living A+, housing A; Watch: schools F, amenities F, commute F.
- Richard City (rural): math 30% / reading 30% proficiency, ranked #107 of 145 in TN (top 74%) — families likely to look elsewhere, expect single-tenant / working-renter base with shorter leases.
- Market conditions: 123 active listings in the ZIP; 2 comparable units currently listed for rent nearby; 225 units permitted in Marion County in 2024 (0 in 5+ unit buildings).
Forward outlook
- Local home prices are declining (-3.0%/yr); year-one equity from $519 of loan paydown is wiped out by about $2k of value loss. Plan a longer hold.
- At projected returns (-3.0% appreciation + 3.0% rent growth), your $21k cash investment doubles in ~6 years — after that, you're playing with house money.
Negotiation context
- It's been on market 142 days — a 12% lower offer ($66k) is reasonable based on typical stale-listing flexibility.
- 4 sale attempts since 3y ago with the ask held roughly flat each time — persistent listings suggest the price (not the market) is what's stuck; bring a comps-based counter.
- Current owner paid $56k; 34% above their basis — modest negotiation headroom, anchor on the comps not their cost.
Risks & watch-outs
- Watch-outs: built in 1958 — expect roof / HVAC / electrical / plumbing capex.
- Climate carrying-cost: major flood risk; extreme-heat days projected 7→19/yr by 2055 (HVAC capex compounding) — expect insurance premiums to compound above CPI over the hold.
Questions for the listing agent
- It's been on market 142 days. Have you received any prior offers? Is the seller open to a 12% concession, seller financing, or rate buy-down credit?
- Built in 1958 — when were the roof, HVAC, electrical panel, plumbing, and water heater last replaced?
- Why hasn't it sold? Are there any deal-killer items the seller is aware of (foundation, flood, title, zoning, code violations)?
- Is there a deadline driving the sale (1031 exchange, divorce, estate, relocation)? That informs how much negotiation room exists.
- Schools are F-rated, which usually means shorter tenancies and higher turnover. Who's the typical renter profile here, and what's been the actual vacancy rate?
- What's the average days-on-market for RENTAL listings here right now (not sales)? A rising rental-DOM trend means longer vacancies and softer asking-rent achievability than the comps imply.
- What's the recent tenant-quality profile in this submarket — average credit score on applications, eviction rate, late-payment / NSF rate, and stable-employment percentage? A property-management company in the area should have these aggregated.
- How much new for-sale + rental construction is in the pipeline within 1–3 miles? Heavy new supply typically softens prices + rents 12–24 months out; constrained supply supports both.
Investment metrics
- 1% rule
- 1.55% ✓
- Cap rate
- 12.83%
- Cash-on-cash
- 23.35%
- DSCR
- 2.04
- GRM
- 5.4
CMA / ARV
No comps found within radius.
Projected returns pro-forma
-3.0% appreciation · 3.0% rent growth · sell at horizon
- IRR
- 16.4%
- Equity multiple
- 1.66×
- Total profit
- $13,890
- Equity at exit
- $11,183
- IRR
- 25.0%
- Equity multiple
- 3.17×
- Total profit
- $45,666
- Equity at exit
- $6,485
Cash invested: $21,000 (down + closing). Projections, not guarantees.
Landlord ↔ Tenant lean methodology
- Overall (STATE)
- 87 Strongly Landlord-Friendly
- State Tennessee
- 87 Strongly Landlord-Friendly · R+13
- County
- — inherits STATE
- City
- — inherits STATE
ZIP-level market 37380
- Home prices YoY
- -5.1%
- Active inventory
- 123
- Price-to-rent
- 5.4×
Monthly cashflow live
- Estimated rent
- $1,164 medium interval (Pro) →
- Mortgage (P&I)
- −$393
- Tax from tax record
- −$86 /mo · $1,034/yr
- Insurance
- −$31
- HOA
- −$0
- Vacancy / Maint / Mgmt
- −$244
- Net cashflow
- $409
Break-even live
UW: 25.0% down · 7.5% · 30yr · 1.5% tax · 5.0% vac · 8.0% maint · 8.0% mgmt
Financing live
Cash to close
- Down payment
- $18,750
- Closing costs
- $2,250
- Reserves months
- —
- Total cash needed
- —
Loan-product check · same deal, 3 products live
Conventional
25% down · 7.5% · 30yr
- Down + closing
- —
- Monthly P&I
- —
- Monthly cashflow
- —
- DSCR
- —
- Eligible?
- —
Personal DTI + credit; lowest rate.
DSCR
20% down · 8.5% · 30yr
- Down + closing
- —
- Monthly P&I
- —
- Monthly cashflow
- —
- DSCR
- —
- Eligible?
- —
No personal income docs; deal must DSCR.
Hard money
10% down · 12.0% · 12mo
- Down + closing
- —
- Monthly P&I
- —
- Monthly cashflow
- —
- DSCR
- —
- Eligible?
- —
Short-term bridge; refi at stabilization.
Rent comps 2 comps
| Address | Beds | Baths | Sqft | Rent | $/sqft | DOM | Units | Dist |
|---|---|---|---|---|---|---|---|---|
| 585 Irondale Rd South Pittsburg, TN | 1.0 | 1.0 | 750 | $1,200 | $1.60 | 13d | 1 | 0.28mi |
| 2340 Hamilton Ave Unit 14 South Pittsburg, TN | 2.0 | 1.0 | 775 | $1,047 | $1.35 | 13d | 1 | 0.92mi |
Listing history 28 events
-
2026-06-18days on market $75,000 Active 142 DOM
-
2026-06-17days on market $75,000 Active 141 DOM
-
2026-06-16days on market $75,000 Active 140 DOM
-
2026-06-15days on market $75,000 Active 139 DOM
-
2026-06-13days on market $75,000 Active 137 DOM
-
2026-06-12days on market $75,000 Active 136 DOM
-
2026-06-09days on market $75,000 Active 133 DOM
-
2026-06-08days on market $75,000 Active 132 DOM
-
2026-06-08days on market $75,000 Active 131 DOM
-
2026-06-07days on market $75,000 Active 130 DOM
-
2026-06-03days on market $75,000 Active 127 DOM
-
2026-06-02days on market $75,000 Active 126 DOM
-
2026-06-01days on market $75,000 Active 125 DOM
-
2026-05-31days on market $75,000 Active 124 DOM
-
2026-01-27$75,000 Active
Show marketing remark (496 chars)
Calling all investors! With beautiful mountain views from its rocking chair front porch, a large lot surrounded by mature trees, & only minutes to the historic downtown of South Pittsburg shopping, businesses, & schools, this investment home provides a canvas for a fresh take on southern living. There is a separate-standing home built in 1920 on the property. Contractor or Investor special! Two properties for the price of one on a large city lot. Would make a great rental property.
-
2026-01-27$75,000 Active 496-char remark
Show marketing remark (496 chars)
Calling all investors! With beautiful mountain views from its rocking chair front porch, a large lot surrounded by mature trees, & only minutes to the historic downtown of South Pittsburg shopping, businesses, & schools, this investment home provides a canvas for a fresh take on southern living. There is a separate-standing home built in 1920 on the property. Contractor or Investor special! Two properties for the price of one on a large city lot. Would make a great rental property.
-
2025-04-16status Pending 124-char remark
Show marketing remark (124 chars)
Contractor or Investor special! Two properties for the price of one on a large city lot. Would make a great rental property.
-
2025-04-16historical 124-char remark
Show marketing remark (124 chars)
Contractor or Investor special! Two properties for the price of one on a large city lot. Would make a great rental property.
-
2025-02-11$45,000 Active 124-char remark
Show marketing remark (124 chars)
Contractor or Investor special! Two properties for the price of one on a large city lot. Would make a great rental property.
-
2023-08-14soldstatus $56,000
-
2023-08-11soldstatus $56,000 Closed
-
2023-08-07historical Contingent
-
2023-07-18price $75,000
-
2023-07-06price $92,500
-
2023-06-24price $100,000
-
2023-06-15price $105,000
-
2023-06-08$110,000 Active
-
2007-02-28soldstatus $28,000
ⓘ Source: listings_history table (triggers on properties + properties_extension) + one-shot
backfill from property_details.listing_events for pre-trigger history.
Tax reassessment forecast TN · Resets to sale price
- Current annual tax
- $1,034 · $86/mo
- Projected year-2 tax
- $1,034 · $86/mo
- Expected delta
- $0/yr ($0/mo · 0.0%)
ⓘ Screening estimate from a state-policy table — verify with the county assessor before closing.
Climate risk First Street
- Flood 6/10 Major FEMA zone X (unshaded) · 74% chance over 30 yrs
- Wildfire 4/10 Moderate
- Heat 5/10 Major 7 d/yr ≥106°F today · 19 d/yr by 30 yrs out
- Wind 4/10 Moderate 12% chance of damaging wind over 30 yrs
- Air quality 3/10 Moderate 2 unhealthy d/yr today · 2 by 30 yrs out
Nearby sold comps map
Loading sold comps map…
Walkable amenities ~0.75 mi
Loading nearby amenities…
Taxation est. · year 1
- Rental income
- $13,966
- − Mortgage interest
- −$4,201
- − Property taxes
- −$1,034
- − Insurance
- −$375
- − Repairs & maintenance
- −$1,117
- − Management
- −$1,117
- − Depreciation
- −$2,182
- Taxable income
- $3,939
- Est. tax owed @ 24.0%
- −$945
- After-tax cash flow
- $3,959/yr
For passive investors: Depreciation is non-cash, so a rental often shows a tax loss while cash-flowing — sheltering income. Rental losses are passive: they offset passive income freely, and up to $25,000/yr can offset ordinary (W-2) income if you actively participate and your MAGI is under $100k (phasing out to $0 by $150k); unused losses carry forward. On sale, claimed depreciation is recaptured at up to 25%, and gains may owe capital-gains tax (a 1031 exchange can defer both). Figures are a year-1 estimate at your 24.0% rate — not tax advice; consult a CPA.
Schools (NCES district)
- District
- Richard City
- NCES district ID
- 4703540
- Math proficiency
- 30% ▬ 0.00%
- Reading proficiency
- 30% ▲ 5.00%
- Median HH income
- $32,017
- Composite
- 27.32/100
- National rank
- #12418
- State rank
- #107 of 145 in TN
Livability — South Pittsburg
- Score
- 62/100
- State rank
- #218
- US rank
- #16522
Category grades
Schools grade is shown separately in the Schools card above.
Census & demographics
- Census place
- South Pittsburg, TN
- Population (ZIP)
- 6,604
Population outlook (Marion County) Hauer SSP2
- Today (2025)
- 28,889 people
- By 2030
- 28,915 · +0.1%
- By 2040
- 28,662 · -0.8%
- By 2050
- 28,053 · -2.9%
- By 2075
- 26,855 · -7.0%
- By 2100
- 24,404 · -15.5%
Race, ethnicity, and origin ACS 2023
- Neighborhood character
- Predominantly White (93%)
- Race & ethnicity
- White 93% Black 4% Two or more races 2%
- Common ancestry
- Italian 3% Romanian 1% Lithuanian 1%
- Foreign-born
- 1% · Canada
- Languages at home
- 99% English-only · Spanish 1%
Political lean MEDSL · Marion
- 2024 margin
- Solid R (+55.7) · D 21.7% · R 77.4%
- 2008→2024 swing
- -34.3pp toward R · 2008: -21.4pp · 2024: -55.7pp
- All cycles
- 2024: R+55.7 2020: R+50.8 2016: R+44.8 2012: R+22.3 2008: R+21.4
Not yet ingested
- Civics
- —
Market trends
- HPI YoY
- ▼ -13.95%
- Current HPI
- 260.87
- Rent YoY
- —
- Metro
- —
- State GDP YoY
- ▲ 2.78%
- F500 in state
- 22
Industry mix (Fortune 500 HQ in TN)
| Industry | F500 HQs | Revenue |
|---|---|---|
| Healthcare | 3 | $91B |
|
||
| Retail | 3 | $72B |
|
||
| Transportation / Logistics | 1 | $88B |
|
||
| Paper / Packaging | 1 | $19B |
|
||
| Insurance | 1 | $13B |
|
||
| Energy | 1 | $12B |
|
||
Price history
+167.9% since first listed14 events — show timeline
- 2026-01-27 Listed $75,000 REALTRACS as Distributed by MLS Grid
- 2026-01-27 Listed $75,000 GCAR
- 2025-04-16 Pending — REALTRACS as Distributed by MLS Grid
- 2025-04-16 Listing Removed — REALTRACS as Distributed by MLS Grid
- 2025-02-11 Listed $45,000 REALTRACS as Distributed by MLS Grid
- 2023-08-14 Sold (Public Records) $56,000 Public Records
- 2023-08-11 Sold (MLS) $56,000 GCAR
- 2023-08-07 Contingent — GCAR
- 2023-07-18 Price Changed $75,000 GCAR
- 2023-07-06 Price Changed $92,500 GCAR
- 2023-06-24 Price Changed $100,000 GCAR
- 2023-06-15 Price Changed $105,000 GCAR
- 2023-06-08 Listed $110,000 GCAR
- 2007-02-28 Sold (Public Records) $28,000 Public Records
Property tax history
+12.3%/yrLatest (2025): $1,034 · +0.0% YoY. Source: county tax records.
Cash-flow waterfall
monthlySold comps — $/sqft
last 12 mo · ≤1 miLoading sold comps…