 🏷️ Likely Rental
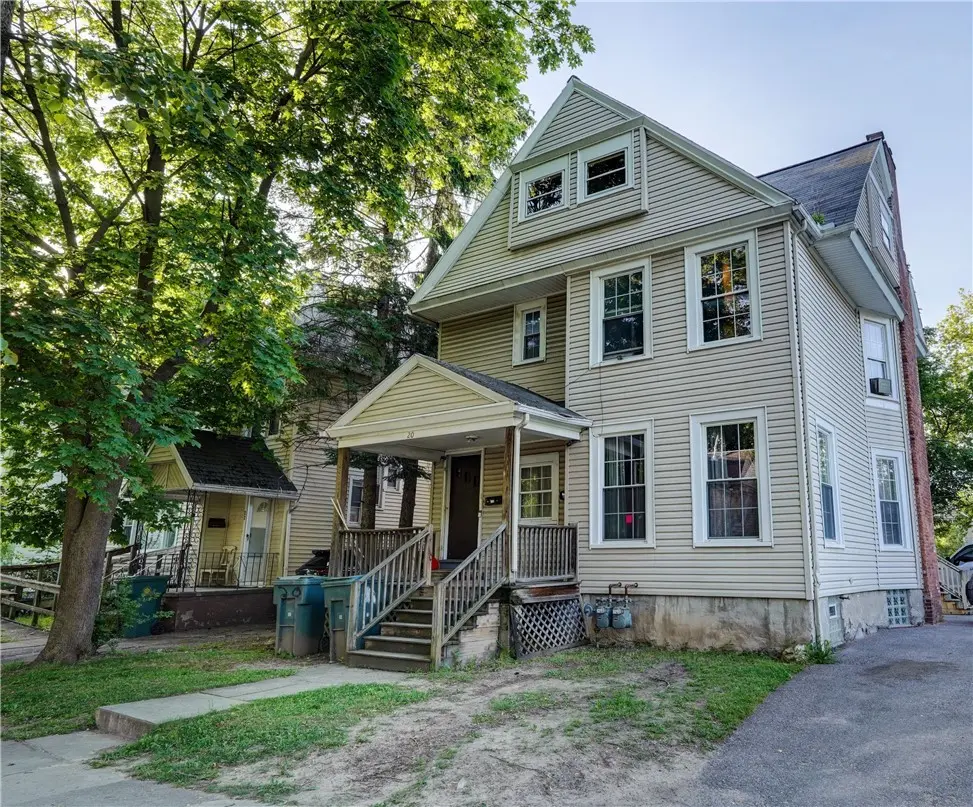
20 Locust St · Rochester, NY
Flood risk 1/10 · Minimal
- FEMA flood zone
- X (unshaded)
- Chance of flooding over 30 yrs
- 0.0%
- Est. flood insurance / yr
- $473 – $860
Fire risk 1/10 · Minimal
- Est. fire insurance / yr
- $691 – $1,283
Heat risk 2/10 · Minimal
- Hot days now (above 95°F)
- 7 days/yr
- Hot days in 30 yrs
- 15 days/yr
Wind risk 1/10 · Minimal
- Chance of severe wind over 30 yrs
- —
Air-quality risk 2/10 · Minimal
- Unhealthy air days now
- 1 days/yr
- Unhealthy air days in 30 yrs
- 2 days/yr
Risk factors via First Street. Map © Google.
Why this score? — see what drove the B+ grade
The composite is a weighted blend of 9 inputs, each scored 0–100. Each bar is that input's sub-score; the figure is the points it added to the 100-point composite (weight × sub-score).
- Cash flow +30.0/30.0
- ARV discount +15.0/15.0
- 1% rule +10.0/10.0
- DSCR +10.0/10.0
- Livability +3.8/5.0
- Rent growth +2.5/5.0
- Condition / age +2.5/5.0
- Appreciation +2.2/10.0
- Schools +1.9/10.0
$85,000
🖨 Deal sheet 📄 Offer letter ✓ Due diligence
Multi-family units
County records classify this as Multi-Family (2-4 Unit). Listing-text estimate: 2 units. confirmed
Listing remarks
Great investment opportunity for shrewd investors or possible owner-occupant opportunity! This duplex features two spacious units including a 2 bedroom upstairs and 3 bedroom downstairs apartment. Both units are currently rented on month to month leases, offering flexibility for future rent or owner occupancy. Group showings Friday 6/5 12p-1p, Saturday 6/6 11a-12p, Sunday 6/7 1p-2p. Delayed negotiations- all offers will be reviewed Monday 6/8 @ 1PM. Don't miss out on this excellent cash-flow opportunity!
Key facts
- 4,691 sq ft lot
- 2 parking spots
- Built 1870
Property features AI
Finance
- Other: Two total units with separate gas and electric meters for each unit
- Financial info: Owner pays trash collection and water; Operating expenses include trash and water/sewer
Exterior
- Parking: Two or more off-street parking spaces
- Utilities: Electricity connected; Public water connected; Sewer connected
- Home design: 2-story residential 2-unit property; Resale condition
- Construction: Vinyl siding; Asphalt roof; Block foundation; Existing (previously built)
- Exterior features: Partial fenced yard; Rectangular lot; Main thoroughfare frontage
Interior
- Flooring: Hardwood; Laminate; Tile; Varies
- Bathrooms: 2 full bathrooms
- Heating & cooling: Gas forced-air heating
- Interior features: Full basement; Hardwood, laminate, tile, and varying flooring throughout
- Laundry & utility: Gas water heater
Neighborhood map
What this means for you Summary
Snapshot
- This is a 2 × 2-bed/?-bath units multifamily listed at $85k.
Deal economics
- At list price, monthly cash flow is $2k ($18k/yr) — positive. Per door: $756/mo.
- The deal already cash-flows at list — no discount required.
- Meets the 1% rule at list price ($3k rent vs $85k).
- Cap rate 27.7% vs local median 9.3% in Rochester — top-decile yield for the area; either an underpriced asset or a hidden risk that comps aren't pricing in. Stress-test before assuming the spread holds.
Location & tenants
- Location reads 76/100 on livability (#222 in NY, #3,482 nationally) — a middle-class / working-renter tenant base. Strengths: commute A+, cost of living A+, housing A+; Watch: schools D+, crime F, employment F.
- Rochester City School District (urban): math 21% / reading 26% proficiency, ranked #589 of 590 in NY (top 100%) — low school quality limits family demand, transient renter base, plan for 1-2y turnover; 82% free/reduced lunch — lower-income household profile, screen leases tightly.
- Market conditions: 71 active listings in the ZIP; 1 comparable units currently listed for rent nearby; 1,169 units permitted in Monroe County in 2024 (591 in 5+ unit buildings).
Forward outlook
- Local home prices are declining (-3.0%/yr); year-one equity from $588 of loan paydown is wiped out by about $3k of value loss. Plan a longer hold.
- Monroe County population projected to shrink 6% by 2050 — rents likely to lag national; underwrite the cash flow, not the appreciation.
- At projected returns (-3.0% appreciation + 3.0% rent growth), your $24k cash investment doubles in ~2 years — after that, you're playing with house money.
Negotiation context
- Only 7 days on market — expect competitive offers; lowballing is unlikely to land.
- Current owner paid $41k; list at $85k implies a 109% gain — meaningful room to come down on a strong offer.
Risks & watch-outs
- Watch-outs: built in 1870 — expect roof / HVAC / electrical / plumbing capex.
Questions for the listing agent
- Can we see the unit-by-unit rent roll, current vacancy, and any below-market leases? What's the average tenancy length?
- What capital expenditures (roof, boiler, parking lot, exteriors) have been made in the last 5 years, and what's planned in the next 2?
- Built in 1870 — when were the roof, HVAC, electrical panel, plumbing, and water heater last replaced?
- Is there a deadline driving the sale (1031 exchange, divorce, estate, relocation)? That informs how much negotiation room exists.
- Schools are D-rated, which usually means shorter tenancies and higher turnover. Who's the typical renter profile here, and what's been the actual vacancy rate?
- Crime grade is F in this area — have there been break-ins, vandalism, or insurance claims at this property in the last 3 years? What carrier currently insures it and at what premium?
- What's the average days-on-market for RENTAL listings here right now (not sales)? A rising rental-DOM trend means longer vacancies and softer asking-rent achievability than the comps imply.
- What's the recent tenant-quality profile in this submarket — average credit score on applications, eviction rate, late-payment / NSF rate, and stable-employment percentage? A property-management company in the area should have these aggregated.
- How much new apartment / multifamily construction is in the pipeline within 1–3 miles? Heavy new supply (>2% of stock underway) typically softens rents 12–24 months out; light construction supports rent growth.
Investment metrics
- 1% rule
- 3.09% ✓
- Cap rate
- 27.65%
- Cash-on-cash
- 76.28%
- DSCR
- 4.39
- GRM
- 2.7
CMA / ARV
- ARV (on-the-fly)
- $157,096
- Comps found
- 12
Show comp detail 12 sales within ~0.75 mi
| Address | Dist | Beds/Ba | Sqft | Sold | Price | $/sf | Match |
|---|---|---|---|---|---|---|---|
| 106 Emerson St | 0.06mi | 6/2.0 (+1) | 2,268 (+5%) | 4mo | $166,000 | $73 | 80 |
| 60 Locust St | 0.15mi | 4/2.0 (-1) | 2,250 (+5%) | 3mo | $65,000 | $29 | 78 |
| 205-207 Ravine Ave | 0.11mi | 4/2.0 (-1) | 2,240 (+4%) | 11mo | $190,000 | $85 | 74 |
| 220 Glenwood Ave | 0.23mi | 5/2.0 | 2,016 (-6%) | 11mo | $170,000 | $84 | 70 |
| 475 Sherman St | 0.39mi | 4/2.0 (-1) | 2,016 (-6%) | 5mo | $150,000 | $74 | 62 |
| 227 Saratoga Ave | 0.37mi | 6/3.0 (+1) | 2,000 (-7%) | 2mo | $85,000 | $43 | 60 |
| 408 Glenwood Ave | 0.45mi | 6/2.0 (+1) | 2,027 (-6%) | 7mo | $110,000 | $54 | 58 |
| 254 Lexington Ave | 0.39mi | 5/2.0 | 1,845 (-14%) | 0mo | $135,000 | $73 | 58 |
| 104 Parkway | 0.54mi | 6/2.0 (+1) | 2,070 (-4%) | 10mo | $170,000 | $82 | 55 |
| 929 Plymouth Ave N | 0.41mi | 6/2.0 (+1) | 2,380 (+11%) | 4mo | $125,000 | $53 | 55 |
| 96 Otis St | 0.57mi | 6/2.0 (+1) | 2,092 (-3%) | 11mo | $125,000 | $60 | 55 |
| 58 Avenue C | 0.59mi | 6/2.0 (+1) | 2,230 (+4%) | 10mo | $130,000 | $58 | 53 |
Match score weights: distance 35% · size 25% · config 20% · recency 20%. Top-matched comps best support the ARV.
Projected returns pro-forma
-3.0% appreciation · 3.0% rent growth · sell at horizon
- IRR
- 76.2%
- Equity multiple
- 4.47×
- Total profit
- $82,601
- Equity at exit
- $12,674
- IRR
- 79.9%
- Equity multiple
- 9.24×
- Total profit
- $196,089
- Equity at exit
- $7,349
Cash invested: $23,800 (down + closing). Projections, not guarantees.
Landlord ↔ Tenant lean methodology
- Overall (STATE)
- 15 Strongly Tenant-Friendly
- State New York
- 15 Strongly Tenant-Friendly · D+10
- County
- — inherits STATE
- City
- — inherits STATE
ZIP-level market 14613
- Home prices YoY
- -2.0%
- Active inventory
- 71
- Price-to-rent
- 5.4×
Monthly cashflow live
- Estimated rent
- $2,624 high interval (Pro) →
- Mortgage (P&I)
- −$446
- Tax from tax record
- −$79 /mo · $948/yr
- Insurance
- −$35
- HOA
- −$0
- Vacancy / Maint / Mgmt
- −$551
- Net cashflow
- $1,513
Break-even live
2-unit breakdown (identical units grouped — click to expand)
| Units | Beds | Baths | Est. rent |
|---|---|---|---|
| 2× units | 2 | — | $2,624 |
| #1 | 2 | — | $1,312 |
| #2 | 2 | — | $1,312 |
| Total (2 units) | $2,624 | ||
UW: 25.0% down · 7.5% · 30yr · 1.5% tax · 5.0% vac · 8.0% maint · 8.0% mgmt
Financing live
Cash to close
- Down payment
- $21,250
- Closing costs
- $2,550
- Reserves months
- —
- Total cash needed
- —
Loan-product check · same deal, 3 products live
Conventional
25% down · 7.5% · 30yr
- Down + closing
- —
- Monthly P&I
- —
- Monthly cashflow
- —
- DSCR
- —
- Eligible?
- —
Personal DTI + credit; lowest rate.
DSCR
20% down · 8.5% · 30yr
- Down + closing
- —
- Monthly P&I
- —
- Monthly cashflow
- —
- DSCR
- —
- Eligible?
- —
No personal income docs; deal must DSCR.
Hard money
10% down · 12.0% · 12mo
- Down + closing
- —
- Monthly P&I
- —
- Monthly cashflow
- —
- DSCR
- —
- Eligible?
- —
Short-term bridge; refi at stabilization.
Rent comps 1 comps
| Address | Beds | Baths | Sqft | Rent | $/sqft | DOM | Units | Dist |
|---|---|---|---|---|---|---|---|---|
| 649 Jay St Rochester, NY | 5.0 | 2.0 | 2144 | $2,000 | $0.93 | 3d | 1 | 1.11mi |
Listing history 7 events
-
2026-06-13statusdays on market $85,000 Pending 7 DOM
-
2026-06-10days on market $85,000 Active 6 DOM
-
2026-06-09days on market $85,000 Active 5 DOM
-
2026-06-09days on market $85,000 Active 4 DOM
-
2026-06-07days on market $85,000 Active 3 DOM
-
2026-06-05remarks 509-char remark
-
2026-06-05$85,000 Active 1 DOM
ⓘ Source: listings_history table (triggers on properties + properties_extension) + one-shot
backfill from property_details.listing_events for pre-trigger history.
Tax reassessment forecast NY · Partial reset (capped growth)
- Current annual tax
- $948 · $79/mo
- Projected year-2 tax
- $1,192 · $99/mo
- Expected delta
- +$244/yr (+$20/mo · 25.8%)
ⓘ Screening estimate from a state-policy table — verify with the county assessor before closing.
Climate risk First Street
- Flood 1/10 Low FEMA zone X (unshaded) · 0% chance over 30 yrs
- Wildfire 1/10 Low
- Heat 2/10 Low 7 d/yr ≥95°F today · 15 d/yr by 30 yrs out
- Wind 1/10 Low
- Air quality 2/10 Low 1 unhealthy d/yr today · 2 by 30 yrs out
Nearby sold comps map
Loading sold comps map…
Walkable amenities ~0.75 mi
Loading nearby amenities…
Taxation est. · year 1
- Rental income
- $31,488
- − Mortgage interest
- −$4,761
- − Property taxes
- −$948
- − Insurance
- −$425
- − Repairs & maintenance
- −$2,519
- − Management
- −$2,519
- − Depreciation
- −$2,473
- Taxable income
- $17,843
- Est. tax owed @ 24.0%
- −$4,282
- After-tax cash flow
- $13,871/yr
For passive investors: Depreciation is non-cash, so a rental often shows a tax loss while cash-flowing — sheltering income. Rental losses are passive: they offset passive income freely, and up to $25,000/yr can offset ordinary (W-2) income if you actively participate and your MAGI is under $100k (phasing out to $0 by $150k); unused losses carry forward. On sale, claimed depreciation is recaptured at up to 25%, and gains may owe capital-gains tax (a 1031 exchange can defer both). Figures are a year-1 estimate at your 24.0% rate — not tax advice; consult a CPA.
Schools (NCES district)
- District
- Rochester City School District
- NCES district ID
- 3624750
- Math proficiency
- 21% ▬ 0.00%
- Reading proficiency
- 26% ▲ 4.00%
- Median HH income
- $30,923
- Composite
- 18.98/100
- National rank
- #8850
- State rank
- #589 of 590 in NY
Livability — Rochester
- Score
- 76/100
- State rank
- #222
- US rank
- #3482
Category grades
Schools grade is shown separately in the Schools card above.
Census & demographics
- Census place
- Rochester, NY
- City population
- 432,803
- Population (ZIP)
- 14,740
Population outlook (Monroe County) Hauer SSP2
- Today (2025)
- 759,460 people
- By 2030
- 757,154 · -0.3%
- By 2040
- 740,644 · -2.5%
- By 2050
- 714,443 · -5.9%
- By 2075
- 645,883 · -15.0%
- By 2100
- 547,084 · -28.0%
Race, ethnicity, and origin ACS 2023
- Neighborhood character
- Highly diverse neighborhood (Simpson 0.70)
- Race & ethnicity
- Black 45% White 22% Hispanic / Latino 20% Two or more races 10% Asian 8% Pacific Islander 1%
- Hispanic origin (detail)
- Puerto Rican 16% Dominican 3%
- Common ancestry
- British 2% Serbian 1% Romanian 1%
- Foreign-born
- 13% · Canada, India, Philippines
- Languages at home
- 79% English-only · Spanish 12% Other Asian/Pacific 5% Other Indo-European 3%
Political lean MEDSL · Monroe
- 2024 margin
- D (+19.1) · D 59.5% · R 40.5%
- 2008→2024 swing
- +1.4pp toward D · 2008: 17.7pp · 2024: 19.1pp
- All cycles
- 2024: D+19.1 2020: D+21.0 2016: D+14.1 2012: D+17.4 2008: D+17.7
Not yet ingested
- Civics
- —
Market trends
- HPI YoY
- ▼ -5.56%
- Current HPI
- 274.2485
- Rent YoY
- —
- Metro
- —
- State GDP YoY
- ▲ 2.60%
- F500 in state
- 92
Industry mix (Fortune 500 HQ in NY)
| Industry | F500 HQs | Revenue |
|---|---|---|
| Financial Services | 10 | $950B |
|
||
| Consumer Goods | 9 | $162B |
|
||
| Insurance | 4 | $225B |
|
||
| Telecommunications | 2 | $144B |
|
||
| Pharmaceuticals | 2 | $112B |
|
||
| Media / Entertainment | 2 | $69B |
|
||
Price history
+108.8% since first listed2 events — show timeline
- 2026-06-04 Listed $85,000 UNYREIS
- 2011-07-15 Sold (Public Records) $40,700 Public Records
Property tax history
-0.2%/yrLatest (2025): $948 · -2.0% YoY. Source: county tax records.
Cash-flow waterfall
monthlySold comps — $/sqft
last 12 mo · ≤1 miLoading sold comps…