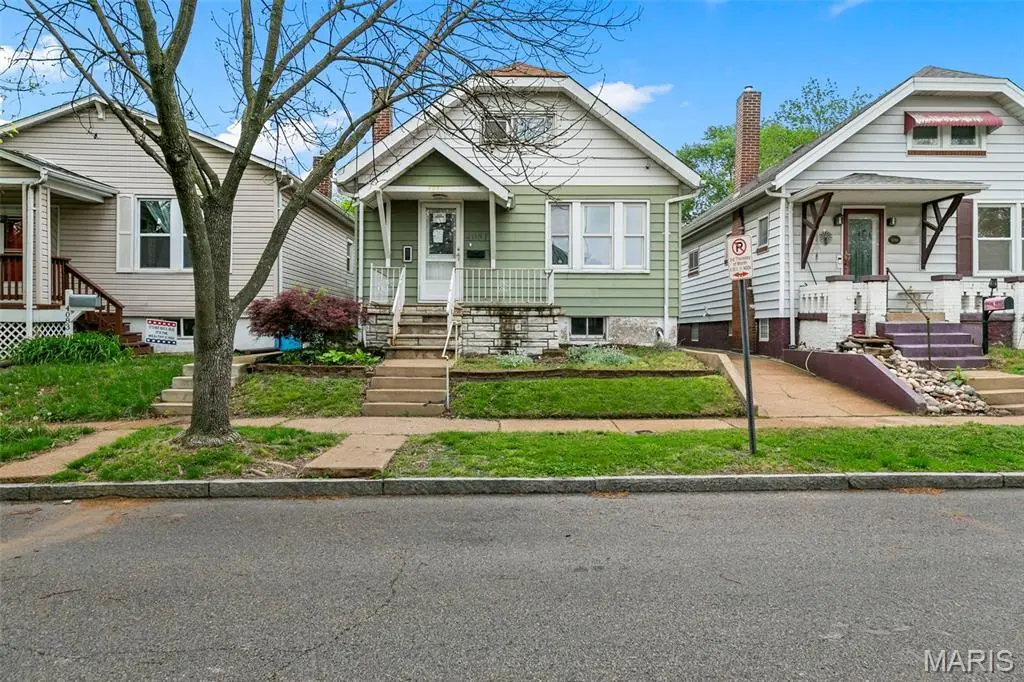
4081 Burgen Ave · St. Louis, MO
Flood risk 1/10 · Minimal
- FEMA flood zone
- X (unshaded)
- Chance of flooding over 30 yrs
- 0.0%
- Est. flood insurance / yr
- $473 – $860
Fire risk 1/10 · Minimal
- Est. fire insurance / yr
- $1,054 – $1,958
Heat risk 5/10 · Moderate
- Hot days now (above 108°F)
- 7 days/yr
- Hot days in 30 yrs
- 21 days/yr
Wind risk 2/10 · Minimal
- Chance of severe wind over 30 yrs
- 1.0%
Air-quality risk 3/10 · Minor
- Unhealthy air days now
- 3 days/yr
- Unhealthy air days in 30 yrs
- 4 days/yr
Risk factors via First Street. Map © Google.
Why this score? — see what drove the D+ grade
The composite is a weighted blend of 9 inputs, each scored 0–100. Each bar is that input's sub-score; the figure is the points it added to the 100-point composite (weight × sub-score).
- Cash flow +20.0/30.0
- ARV discount +7.5/15.0
- DSCR +6.3/10.0
- 1% rule +5.4/10.0
- Rent growth +3.2/5.0
- Livability +2.5/5.0
- Condition / age +2.5/5.0
- Schools +1.2/10.0
- Appreciation +0.0/10.0
$94,900
🖨 Deal sheet 📄 Offer letter ✓ Due diligence
Listing remarks MLS
Incredible 3 bed, 1 bath home with approx 1286sf of total living space on all levels. This 1.5 story home has a main floor bedroom, living room, dining room, and kitchen. The upper level dormer area has 2 bedrooms. The partially finished basement has an area finished and rooms for storage and laundry. Large fenced backyard. This home is located in a fantastic area and ready for your personal touches. Please Write offer on Special Sales contract & upload offer to WWW.PROPOFFERS.com. 10% Earnest Money Required for Cash Offers. If your offer is accepted, you agree to an offer submission technology fee of $212.00. The fee will be collected & disbursed by the settlement agent at closing. Purchasers may use any lender they chose to finance the purchase of a property. Property is sold in current, as/is condition.
Key facts
- Main floor bedroom
- 3,327 sq ft lot
- Built 1926
Tags
Neighborhood map
What this means for you Summary
Snapshot
- This is a 3-bed/1.0-bath single-family listed at $95k.
Deal economics
- At list price, monthly cash flow is $117 ($1k/yr) — positive.
- The deal already cash-flows at list — no discount required.
- Meets the 1% rule at list price ($989 rent vs $95k).
- Recommended offer: $92k (3.0% below list) — sets the bar for market timing.
- Cap rate 7.8% vs local median 5.0% in St. Louis — top-decile yield for the area; either an underpriced asset or a hidden risk that comps aren't pricing in. Stress-test before assuming the spread holds.
Location & tenants
- Location reads: area grade D — affects rentability + tenant quality, not the cash-flow math above.
- St. Louis City (urban): math 10% / reading 18% proficiency, ranked #312 of 324 in MO (top 96%) — low school quality limits family demand, transient renter base, plan for 1-2y turnover; 80% free/reduced lunch — lower-income household profile, screen leases tightly.
- Market conditions: Rents rising (+2.6%/yr); 255 active listings in the ZIP; 10 comparable units currently listed for rent nearby; rentals at typical pace (median 24d on market — plan ~3-4 weeks tenant-placement turnaround); 40% of comp listings sitting > 30 days — soft ceiling on asking rent; 294 units permitted in St. Louis city in 2024 (227 in 5+ unit buildings).
Forward outlook
- Local home prices are declining (-3.0%/yr); year-one equity from $656 of loan paydown is wiped out by about $3k of value loss. Plan a longer hold.
- St. Louis County population projected to shrink 6% by 2050 — rents likely to lag national; underwrite the cash flow, not the appreciation.
Negotiation context
- It's been on market 46 days — a 3% lower offer ($92k) is reasonable based on typical stale-listing flexibility.
Risks & watch-outs
- Watch-outs: built in 1926 — expect roof / HVAC / electrical / plumbing capex.
- Climate carrying-cost: extreme-heat days projected 7→21/yr by 2055 (HVAC capex compounding) — expect insurance premiums to compound above CPI over the hold.
Questions for the listing agent
- It's been on market 46 days. Have you received any prior offers? Is the seller open to a 3% concession, seller financing, or rate buy-down credit?
- Built in 1926 — when were the roof, HVAC, electrical panel, plumbing, and water heater last replaced?
- Is there a deadline driving the sale (1031 exchange, divorce, estate, relocation)? That informs how much negotiation room exists.
- The area grade is low — what's the realistic commute time and amenity access for the typical tenant pool here? Any planned neighborhood developments (good or bad) we should know about?
- What's the average days-on-market for RENTAL listings here right now (not sales)? A rising rental-DOM trend means longer vacancies and softer asking-rent achievability than the comps imply.
- What's the recent tenant-quality profile in this submarket — average credit score on applications, eviction rate, late-payment / NSF rate, and stable-employment percentage? A property-management company in the area should have these aggregated.
- How much new for-sale + rental construction is in the pipeline within 1–3 miles? Heavy new supply typically softens prices + rents 12–24 months out; constrained supply supports both.
Investment metrics
- 1% rule
- 1.04% ✓
- Cap rate
- 7.77%
- Cash-on-cash
- 5.26%
- DSCR
- 1.23
- GRM
- 8.0
CMA / ARV
- ARV (median comp)
- $191,176
- List price
- $94,900
- Delta
- -50.36%
- Verdict
- UNDERPRICED
- Comps
- 20 within 1.0 mi
Show comp detail 12 sales within ~0.75 mi
| Address | Dist | Beds/Ba | Sqft | Sold | Price | $/sf | Match |
|---|---|---|---|---|---|---|---|
| 3976 Eichelberger St | 0.26mi | 2/1.0 (-1) | 720 (-2%) | 1mo | $10,000 | $14 | 79 |
| 4035 Schiller Pl | 0.22mi | 2/1.0 (-1) | 762 (+4%) | 2mo | $114,900 | $151 | 77 |
| 5034 Ray Ave | 0.36mi | 3/1.5 | 800 (+9%) | 1mo | $165,000 | $206 | 66 |
| 5610 Leona St | 0.09mi | 2/1.0 (-1) | 840 (+14%) | 4mo | $150,000 | $179 | 64 |
| 4045 Walsh St | 0.32mi | 2/1.0 (-1) | 803 (+9%) | 2mo | $55,635 | $69 | 63 |
| 5231 Steffens Ave | 0.25mi | 2/1.0 (-1) | 816 (+11%) | 6mo | $125,000 | $153 | 61 |
| 4359 Toenges Ave | 0.59mi | 2/1.0 (-1) | 768 (+4%) | 2mo | $179,900 | $234 | 58 |
| 5129 Cologne Ave | 0.66mi | 3/2.0 | 776 (+5%) | 5mo | $194,400 | $251 | 52 |
| 5420 Dewey Ave | 0.55mi | 3/1.0 | 816 (+11%) | 7mo | $95,000 | $116 | 50 |
| 5039 Grace Ave | 0.72mi | 2/1.0 (-1) | 792 (+8%) | 0mo | $145,500 | $184 | 48 |
| 5450 Dresden Ave | 0.55mi | 2/1.0 (-1) | 829 (+13%) | 1mo | $150,000 | $181 | 48 |
| 5115 Cologne Ave | 0.68mi | 2/1.0 (-1) | 820 (+11%) | 6mo | $169,500 | $207 | 40 |
Match score weights: distance 35% · size 25% · config 20% · recency 20%. Top-matched comps best support the ARV.
Projected returns pro-forma
-3.0% appreciation · 2.62% rent growth · sell at horizon
- IRR
- -8.5%
- Equity multiple
- 0.69×
- Total profit
- $-8,309
- Equity at exit
- $14,150
- IRR
- 0.5%
- Equity multiple
- 1.03×
- Total profit
- $874
- Equity at exit
- $8,205
Cash invested: $26,572 (down + closing). Projections, not guarantees.
Landlord ↔ Tenant lean methodology
- Overall (STATE)
- 81 Strongly Landlord-Friendly
- State Missouri
- 81 Strongly Landlord-Friendly · R+10
- County
- — inherits STATE
- City
- — inherits STATE
ZIP-level market 63116
- Rents YoY
- 2.6%
- Active inventory
- 255
- Price-to-rent
- 8.0×
Monthly cashflow live
- Estimated rent
- $989 high interval (Pro) →
- Mortgage (P&I)
- −$498
- Tax from tax record
- −$127 /mo · $1,528/yr
- Insurance
- −$40
- HOA
- −$0
- Vacancy / Maint / Mgmt
- −$208
- Net cashflow
- $117
Break-even live
UW: 25.0% down · 7.5% · 30yr · 1.5% tax · 5.0% vac · 8.0% maint · 8.0% mgmt
Financing live
Cash to close
- Down payment
- $23,725
- Closing costs
- $2,847
- Reserves months
- —
- Total cash needed
- —
Loan-product check · same deal, 3 products live
Conventional
25% down · 7.5% · 30yr
- Down + closing
- —
- Monthly P&I
- —
- Monthly cashflow
- —
- DSCR
- —
- Eligible?
- —
Personal DTI + credit; lowest rate.
DSCR
20% down · 8.5% · 30yr
- Down + closing
- —
- Monthly P&I
- —
- Monthly cashflow
- —
- DSCR
- —
- Eligible?
- —
No personal income docs; deal must DSCR.
Hard money
10% down · 12.0% · 12mo
- Down + closing
- —
- Monthly P&I
- —
- Monthly cashflow
- —
- DSCR
- —
- Eligible?
- —
Short-term bridge; refi at stabilization.
Rent comps 10 comps
| Address | Beds | Baths | Sqft | Rent | $/sqft | DOM | Units | Dist |
|---|---|---|---|---|---|---|---|---|
| 4215 Neosho St Unit 101 St. Louis, MO | 2.0 | 1.0 | 750 | $825 | $1.10 | 43d | 1 | 0.71mi |
| 6725 Wanda Ave Saint Louis, MO | 2.0 | 1.0 | 700 | $1,100 | $1.57 | 43d | 1 | 0.80mi |
| 3601 Holly Hills Blvd Apt 19 St. Louis, MO | 2.0 | 1.0 | 700 | $875 | $1.25 | 2d | 1 | 0.84mi |
| 4451 Grace Ave Saint Louis, MO | 2.0 | 1.0 | 700 | $750 | $1.07 | 17d | 1 | 1.00mi |
| 3702 Meramec St Unit 1e St. Louis, MO | 2.0 | 1.0 | 725 | $950 | $1.31 | 7d | 1 | 1.19mi |
| 4617 Virginia Ave St. Louis, MO | 2.0 | 1.0 | 700 | $825 | $1.18 | 23d | 1 | 1.22mi |
| 3860 Bamberger Ave Unit 3N St. Louis, MO | 2.0 | 1.0 | 700 | $799 | $1.14 | 17d | 1 | 1.26mi |
| 440 Eichelberger St Saint Louis, MO | 2.0 | 1.0 | 750 | $850 | $1.13 | 2d | 1 | 1.27mi |
| 5305 S Compton Ave St. Louis, MO | 2.0 | 1.0 | 750 | $825 | $1.10 | 43d | 1 | 1.28mi |
| 3534 Morgan Ford Rd Unit 3534-C St. Louis, MO | 2.0 | 1.0 | 650 | $1,150 | $1.77 | 43d | 1 | 1.36mi |
Listing history 7 events
-
2026-06-02status $94,900 Pending 46 DOM
-
2026-06-01days on market $94,900 Active 46 DOM
-
2026-05-31days on market $94,900 Active 45 DOM
-
2026-04-16$94,900 Active 833-char remark
Show marketing remark (833 chars)
Incredible 3 bed, 1 bath home with approx 1286sf of total living space on all levels. This 1.5 story home has a main floor bedroom, living room, dining room, and kitchen. The upper level dormer area has 2 bedrooms. The partially finished basement has an area finished and rooms for storage and laundry. Large fenced backyard. This home is located in a fantastic area and ready for your personal touches. Please Write offer on Special Sales contract & upload offer to WWW.PROPOFFERS.com. 10% Earnest Money Required for Cash Offers. If your offer is accepted, you agree to an offer submission technology fee of $212.00. The fee will be collected & disbursed by the settlement agent at closing. Purchasers may use any lender they chose to finance the purchase of a property. Property is sold in current, as/is condition.
-
2005-05-26soldstatus
-
2004-10-26soldstatus $108,000
-
1992-05-04soldstatus
ⓘ Source: listings_history table (triggers on properties + properties_extension) + one-shot
backfill from property_details.listing_events for pre-trigger history.
Tax reassessment forecast MO · Resets to sale price
- Current annual tax
- $1,528 · $127/mo
- Projected year-2 tax
- $1,528 · $127/mo
- Expected delta
- $0/yr ($0/mo · 0.0%)
ⓘ Screening estimate from a state-policy table — verify with the county assessor before closing.
Climate risk First Street
- Flood 1/10 Low FEMA zone X (unshaded) · 0% chance over 30 yrs
- Wildfire 1/10 Low
- Heat 5/10 Major 7 d/yr ≥108°F today · 21 d/yr by 30 yrs out
- Wind 2/10 Low 100% chance of damaging wind over 30 yrs
- Air quality 3/10 Moderate 3 unhealthy d/yr today · 4 by 30 yrs out
Nearby sold comps map
Loading sold comps map…
Walkable amenities ~0.75 mi
Loading nearby amenities…
Taxation est. · year 1
- Rental income
- $11,865
- − Mortgage interest
- −$5,316
- − Property taxes
- −$1,528
- − Insurance
- −$474
- − Repairs & maintenance
- −$949
- − Management
- −$949
- − Depreciation
- −$2,761
- Taxable loss
- −$112
- Est. tax savings @ 24.0%
- +$27
- After-tax cash flow
- $1,426/yr
For passive investors: Depreciation is non-cash, so a rental often shows a tax loss while cash-flowing — sheltering income. Rental losses are passive: they offset passive income freely, and up to $25,000/yr can offset ordinary (W-2) income if you actively participate and your MAGI is under $100k (phasing out to $0 by $150k); unused losses carry forward. On sale, claimed depreciation is recaptured at up to 25%, and gains may owe capital-gains tax (a 1031 exchange can defer both). Figures are a year-1 estimate at your 24.0% rate — not tax advice; consult a CPA.
Schools (NCES district)
- District
- St. Louis City
- NCES district ID
- 2929280
- Math proficiency
- 10% ▼ -6.00%
- Reading proficiency
- 18% ▼ -3.00%
- Median HH income
- $35,685
- Composite
- 11.54/100
- National rank
- #9699
- State rank
- #312 of 324 in MO
Livability — St. Louis
No livability data for this city. (Only ~50 U.S. cities are tracked.)
Census & demographics
- Census place
- St. Louis, MO
- County
- Saint Louis City · 254,015 people
- City population
- 283,259
- Metro
- St. Louis, MO-IL
- Population (ZIP)
- 42,170
- Household income
- $61,433
- Rent vs Own
- Severe rent burden
- 1923.0
Population outlook (St. Louis County) Hauer SSP2
- Today (2025)
- 315,737 people
- By 2030
- 313,865 · -0.6%
- By 2040
- 305,439 · -3.3%
- By 2050
- 296,529 · -6.1%
- By 2075
- 271,028 · -14.2%
- By 2100
- 255,359 · -19.1%
Race, ethnicity, and origin ACS 2023
- Neighborhood character
- Diverse neighborhood (Simpson 0.63)
- Race & ethnicity
- White 54% Black 27% Hispanic / Latino 10% Two or more races 8% Asian 5%
- Hispanic origin (detail)
- Mexican 7%
- Common ancestry
- Lithuanian 4% Romanian 2% Italian 2%
- Foreign-born
- 11% · Canada, Vietnam, Philippines
- Languages at home
- 85% English-only · Spanish 6% Vietnamese 2% Arabic 2%
Political lean MEDSL · St. Louis
- 2024 margin
- Solid D (+64.7) · D 81.4% · R 16.7% · Other 2.0%
- 2008→2024 swing
- -3.5pp toward R · 2008: 68.2pp · 2024: 64.7pp
- All cycles
- 2024: D+64.7 2020: D+66.2 2016: D+63.7 2012: D+66.6 2008: D+68.2
Not yet ingested
- Civics
- —
Market trends
- HPI YoY
- ▼ -271.19%
- Current HPI
- 215.7108
- Rent YoY
- ▲ 2.62%
- Metro
- St. Louis, MO-IL
- State GDP YoY
- ▲ 1.84%
- F500 in state
- 20
Industry mix (Fortune 500 HQ in MO)
| Industry | F500 HQs | Revenue |
|---|---|---|
| Healthcare | 1 | $163B |
|
||
| Insurance | 1 | $21B |
|
||
| Industrial Technology | 1 | $17B |
|
||
| Retail | 1 | $16B |
|
||
| Industrial Distribution | 1 | $10B |
|
||
| Utilities | 1 | $9B |
|
||
Price history
-12.1% since first listed4 events — show timeline
- 2026-04-16 Listed $94,900 MARIS as Distributed by MLS Grid
- 2005-05-26 Sold (Public Records) — Public Records
- 2004-10-26 Sold (Public Records) $108,000 Public Records
- 1992-05-04 Sold (Public Records) — Public Records
Property tax history
+6.6%/yrLatest (2024): $1,528 · +4.7% YoY. Source: county tax records.
Cash-flow waterfall
monthlySold comps — $/sqft
last 12 mo · ≤1 miLoading sold comps…