 Multi-family
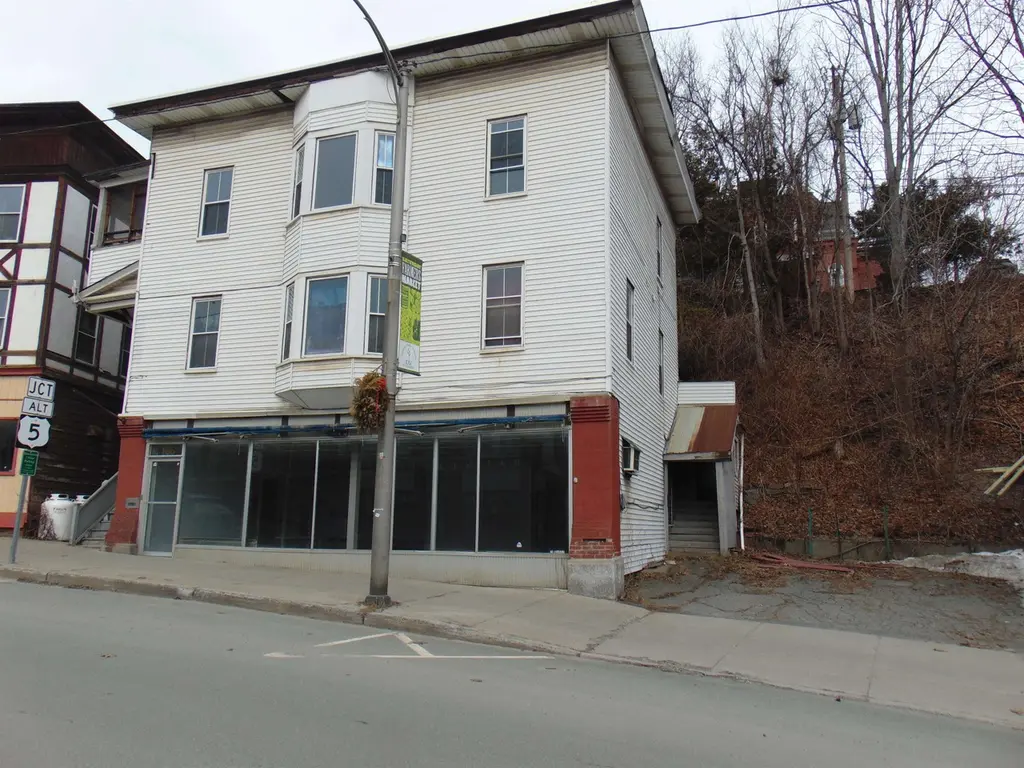
166 Eastern Ave · St. Johnsbury, VT
Flood risk No data
- FEMA flood zone
- —
- Chance of flooding over 30 yrs
- —
- Est. flood insurance / yr
- —
Fire risk No data
- Est. fire insurance / yr
- —
Heat risk 3/10 · Minor
- Hot days now (above threshold)
- 8 days/yr
- Hot days in 30 yrs
- 18 days/yr
Wind risk No data
- Chance of severe wind over 30 yrs
- —
Air-quality risk 2/10 · Minimal
- Unhealthy air days now
- 1 days/yr
- Unhealthy air days in 30 yrs
- 1 days/yr
Risk factors via First Street. Map © Google.
Why this score? — see what drove the B grade
The composite is a weighted blend of 9 inputs, each scored 0–100. Each bar is that input's sub-score; the figure is the points it added to the 100-point composite (weight × sub-score).
- Cash flow +30.0/30.0
- DSCR +10.0/10.0
- 1% rule +9.0/10.0
- ARV discount +7.5/15.0
- Schools +5.0/10.0
- Appreciation +3.8/10.0
- Rent growth +2.5/5.0
- Livability +2.5/5.0
- Condition / age +1.0/5.0
$200,000
🖨 Deal sheet 📄 Offer letter ✓ Due diligence
Multi-family units
County records classify this as Multi-Family (2-4 Unit). Listing-text estimate: 1 unit. estimate disagrees with records
Listing remarks MLS
This is an Eastern Ave investment opportunity with parking! With both a storefront and 2 residential units this property offers flexibility as well steady income to an investor. St J is up and coming, don't hesitate on this highly visible and affordable property!
Key facts
- 4,356 sq ft lot
- Built 1900
- Listed 92 days
Property features AI
Exterior
- Parking: Dirt driveway
- Utilities: Public water; Public sewer; Electric service provided by GMP; Internet via cable; on-site cable and telephone available
- Home design: Apartment building; Existing construction; Storefront-style unit on the first level; Built in 1900
- Construction: Wood frame construction with brick veneer and clapboard exterior; Flat membrane roof; Finished basement
- Exterior features: Major road frontage in town; Paved public road frontage
Interior
- Kitchen: Appliances included (details not itemized)
- Bedrooms: Two units with three bedrooms each; Unit 1 located on the 2nd level; Unit 2 located on the 3rd level; Unit 3 located on the 1st level
- Flooring: Combination of carpet, softwood, and vinyl flooring
- Bathrooms: Each unit has one bathroom; Total of two full baths noted in building summary
- Heating & cooling: Baseboard heating; Gas heaters; hot water heating; No central cooling
- Interior features: Finished walkout basement with concrete floor; Walkout basement access; Appliances included in units; Annual leases for units
- Laundry & utility: Electric water heater; 200 Amp electrical service with circuit breakers
Neighborhood map
What this means for you Summary
Snapshot
- This is a 6-bed/2.0-bath multifamily listed at $200k. Condition is rated poor.
Deal economics
- At list price, monthly cash flow is $828 ($10k/yr) — positive.
- The deal already cash-flows at list — no discount required.
- Meets the 1% rule at list price ($3k rent vs $200k).
- Recommended offer: $182k (9.0% below list) — sets the bar for market timing.
- Cap rate 11.3% vs local median 3.4% in St. Johnsbury — top-decile yield for the area; either an underpriced asset or a hidden risk that comps aren't pricing in. Stress-test before assuming the spread holds.
Location & tenants
- Location reads: area grade B — affects rentability + tenant quality, not the cash-flow math above.
- Zoned schools: St. Johnsbury School (math 19% / reading 37%, grade F, #149 of 192 statewide, top 78%, 702 students, 52% FRL).
- Market conditions: 66 active listings in the ZIP; 112 units permitted in Caledonia County in 2024 (15 in 5+ unit buildings).
Forward outlook
- Local home prices are declining (-2.4%/yr); year-one equity from $1k of loan paydown is wiped out by about $5k of value loss. Plan a longer hold.
- Caledonia County population projected at -20% by 2050 — secular population decline; favor cash flow + early exit over multi-decade hold.
- At projected returns (-2.4% appreciation + 3.0% rent growth), your $56k cash investment doubles in ~7 years — after that, you're playing with house money.
Negotiation context
- It's been on market 93 days — a 9% lower offer ($182k) is reasonable based on typical stale-listing flexibility.
- 3 sale attempts since 5y ago with the ask held roughly flat each time — persistent listings suggest the price (not the market) is what's stuck; bring a comps-based counter.
- Current owner paid $135k; 48% above their basis — modest negotiation headroom, anchor on the comps not their cost.
Risks & watch-outs
- Watch-outs: built in 1900 — expect roof / HVAC / electrical / plumbing capex.
Questions for the listing agent
- It's been on market 93 days. Have you received any prior offers? Is the seller open to a 9% concession, seller financing, or rate buy-down credit?
- Have any recent inspections been done? Can we get a copy of the seller's disclosures and any deferred-maintenance estimates?
- Built in 1900 — when were the roof, HVAC, electrical panel, plumbing, and water heater last replaced?
- Why hasn't it sold? Are there any deal-killer items the seller is aware of (foundation, flood, title, zoning, code violations)?
- Is there a deadline driving the sale (1031 exchange, divorce, estate, relocation)? That informs how much negotiation room exists.
- What's the average days-on-market for RENTAL listings here right now (not sales)? A rising rental-DOM trend means longer vacancies and softer asking-rent achievability than the comps imply.
- What's the recent tenant-quality profile in this submarket — average credit score on applications, eviction rate, late-payment / NSF rate, and stable-employment percentage? A property-management company in the area should have these aggregated.
- How much new apartment / multifamily construction is in the pipeline within 1–3 miles? Heavy new supply (>2% of stock underway) typically softens rents 12–24 months out; light construction supports rent growth.
Investment metrics
- 1% rule
- 1.40% ✓
- Cap rate
- 11.26%
- Cash-on-cash
- 17.75%
- DSCR
- 1.79
- GRM
- 6.0
CMA / ARV
No comps found within radius.
Projected returns pro-forma
-2.41% appreciation · 3.0% rent growth · sell at horizon
- IRR
- 11.0%
- Equity multiple
- 1.45×
- Total profit
- $25,354
- Equity at exit
- $35,106
- IRR
- 19.1%
- Equity multiple
- 2.69×
- Total profit
- $94,515
- Equity at exit
- $26,509
Cash invested: $56,000 (down + closing). Projections, not guarantees.
Landlord ↔ Tenant lean methodology
- Overall (STATE)
- 41 Moderately Tenant-Leaning
- State Vermont
- 41 Moderately Tenant-Leaning · D+15
- County
- — inherits STATE
- City
- — inherits STATE
ZIP-level market 05819
- Home prices YoY
- -0.8%
- Active inventory
- 66
- Price-to-rent
- 11.9×
Monthly cashflow live
- Estimated rent
- $2,798 medium interval (Pro) →
- Mortgage (P&I)
- −$1,049
- Tax est. 1.5%
- −$250 /mo · $3,000/yr
- Insurance
- −$83
- HOA
- −$0
- Vacancy / Maint / Mgmt
- −$588
- Net cashflow
- $828
Break-even live
2-unit breakdown (identical units grouped — click to expand)
| Units | Beds | Baths | Est. rent |
|---|---|---|---|
| 2× units | 2 | 1 | $2,798 |
| #1 | 2 | 1 | $1,399 |
| #2 | 2 | 1 | $1,399 |
| Total (2 units) | $2,798 | ||
UW: 25.0% down · 7.5% · 30yr · 1.5% tax · 5.0% vac · 8.0% maint · 8.0% mgmt
Financing live
Cash to close
- Down payment
- $50,000
- Closing costs
- $6,000
- Reserves months
- —
- Total cash needed
- —
Loan-product check · same deal, 3 products live
Conventional
25% down · 7.5% · 30yr
- Down + closing
- —
- Monthly P&I
- —
- Monthly cashflow
- —
- DSCR
- —
- Eligible?
- —
Personal DTI + credit; lowest rate.
DSCR
20% down · 8.5% · 30yr
- Down + closing
- —
- Monthly P&I
- —
- Monthly cashflow
- —
- DSCR
- —
- Eligible?
- —
No personal income docs; deal must DSCR.
Hard money
10% down · 12.0% · 12mo
- Down + closing
- —
- Monthly P&I
- —
- Monthly cashflow
- —
- DSCR
- —
- Eligible?
- —
Short-term bridge; refi at stabilization.
Listing history 21 events
-
2026-06-18days on market $200,000 Active 93 DOM
-
2026-06-17days on market $200,000 Active 92 DOM
-
2026-06-16days on market $200,000 Active 91 DOM
-
2026-06-15days on market $200,000 Active 90 DOM
-
2026-06-15days on market $200,000 Active 89 DOM
-
2026-06-13days on market $200,000 Active 88 DOM
-
2026-06-12days on market $200,000 Active 87 DOM
-
2026-06-09days on market $200,000 Active 84 DOM
-
2026-06-08days on market $200,000 Active 83 DOM
-
2026-06-08days on market $200,000 Active 82 DOM
-
2026-06-07days on market $200,000 Active 81 DOM
-
2026-06-03days on market $200,000 Active 78 DOM
-
2026-06-02days on market $200,000 Active 77 DOM
-
2026-06-01days on market $200,000 Active 76 DOM
-
2026-05-31days on market $200,000 Active 75 DOM
-
2026-05-03status Active
-
2026-04-14historical Active with Contract
-
2026-03-15$200,000 Active
-
2021-11-17soldstatus $135,000 Closed 263-char remark
Show marketing remark (263 chars)
This is an Eastern Ave investment opportunity with parking! With both a storefront and 2 residential units this property offers flexibility as well steady income to an investor. St J is up and coming, don't hesitate on this highly visible and affordable property!
-
2021-08-28historical Active with Contract 263-char remark
Show marketing remark (263 chars)
This is an Eastern Ave investment opportunity with parking! With both a storefront and 2 residential units this property offers flexibility as well steady income to an investor. St J is up and coming, don't hesitate on this highly visible and affordable property!
-
2021-06-22$149,000 Active 263-char remark
Show marketing remark (263 chars)
This is an Eastern Ave investment opportunity with parking! With both a storefront and 2 residential units this property offers flexibility as well steady income to an investor. St J is up and coming, don't hesitate on this highly visible and affordable property!
ⓘ Source: listings_history table (triggers on properties + properties_extension) + one-shot
backfill from property_details.listing_events for pre-trigger history.
Climate risk First Street
- Heat 3/10 Moderate
- Air quality 2/10 Low 1 unhealthy d/yr today · 1 by 30 yrs out
Nearby sold comps map
Loading sold comps map…
Walkable amenities ~0.75 mi
Loading nearby amenities…
Taxation est. · year 1
- Rental income
- $33,576
- − Mortgage interest
- −$11,203
- − Property taxes
- −$3,000
- − Insurance
- −$1,000
- − Repairs & maintenance
- −$2,686
- − Management
- −$2,686
- − Depreciation
- −$5,818
- Taxable income
- $7,183
- Est. tax owed @ 24.0%
- −$1,724
- After-tax cash flow
- $8,215/yr
For passive investors: Depreciation is non-cash, so a rental often shows a tax loss while cash-flowing — sheltering income. Rental losses are passive: they offset passive income freely, and up to $25,000/yr can offset ordinary (W-2) income if you actively participate and your MAGI is under $100k (phasing out to $0 by $150k); unused losses carry forward. On sale, claimed depreciation is recaptured at up to 25%, and gains may owe capital-gains tax (a 1031 exchange can defer both). Figures are a year-1 estimate at your 24.0% rate — not tax advice; consult a CPA.
Condition & rehab AI · 12 photos
This multi-family property requires extensive repairs and updates to bring it up to current standards, significantly impacting its resale and rental value.
Repairs flagged
- Major siding — Severe weathering and damage
- Major roof — Missing shingles and rafters
- Major flooring — Worn carpet and exposed subfloor
- Major interior walls — Paint peeling and exposed drywall
- Major bathrooms — Old fixtures and missing tiles
- Major kitchen — Old appliances and missing cabinets
- Major HVAC — Exposed components and missing insulation
Value-add opportunities
- Resale New siding — Enhances curb appeal and property value
- Resale New roof — Improves structural integrity and longevity
- Resale New flooring — Freshens the interior and adds value
- Resale Paint interior walls — Brightens the space and enhances curb appeal
- Rental Replace fixtures and appliances — Attracts tenants and improves rental value
- Resale Replace insulation — Improves energy efficiency and adds value
Renovation cost estimate screening
| Repair item | Severity | Est. cost |
|---|---|---|
| siding · Severe weathering and damage | Major | $15,000–50,000 |
| roof · Missing shingles and rafters | Major | $15,000–50,000 |
| flooring · Worn carpet and exposed subfloor | Major | $15,000–50,000 |
| interior walls · Paint peeling and exposed drywall | Major | $15,000–50,000 |
| bathrooms · Old fixtures and missing tiles | Major | $15,000–50,000 |
| kitchen · Old appliances and missing cabinets | Major | $15,000–50,000 |
| HVAC · Exposed components and missing insulation | Major | $15,000–50,000 |
| Total estimated repair cost · 7 items | $105,000–350,000 |
Value-add ROI direction
- Resale New siding — Enhances curb appeal and property value ↑
- Resale New roof — Improves structural integrity and longevity ↑
- Resale New flooring — Freshens the interior and adds value ↑
- Resale Paint interior walls — Brightens the space and enhances curb appeal ↑
- Rental Replace fixtures and appliances — Attracts tenants and improves rental value ↑
- Resale Replace insulation — Improves energy efficiency and adds value ↑
ⓘ Cost ranges are severity-bucket heuristics (US national rule-of-thumb). Get contractor quotes + a written scope before underwriting a rehab budget.
Schools (NCES district)
No district data.
Livability — St. Johnsbury
No livability data for this city. (Only ~50 U.S. cities are tracked.)
Census & demographics
- Census place
- St. Johnsbury, VT
- Population (ZIP)
- 9,323
Population outlook (Caledonia County) Hauer SSP2
- Today (2025)
- 29,828 people
- By 2030
- 28,820 · -3.4%
- By 2040
- 26,262 · -12.0%
- By 2050
- 23,780 · -20.3%
- By 2075
- 18,516 · -37.9%
- By 2100
- 13,647 · -54.2%
Race, ethnicity, and origin ACS 2023
- Neighborhood character
- Predominantly White (92%)
- Race & ethnicity
- White 92% Two or more races 5% Hispanic / Latino 2%
- Common ancestry
- Lithuanian 11% Slovak 6% Serbian 3%
- Foreign-born
- 2% · Canada
- Languages at home
- 93% English-only · French/Haitian/Cajun 3% Other Asian/Pacific 2% Spanish 1%
Political lean MEDSL · Caledonia
- 2024 margin
- D (+12.4) · D 54.5% · R 42.0% · Other 3.5%
- 2008→2024 swing
- -10.8pp toward R · 2008: 23.3pp · 2024: 12.4pp
- All cycles
- 2024: D+12.4 2020: D+15.2 2016: D+7.0 2012: D+22.9 2008: D+23.3
Not yet ingested
- Civics
- —
Market trends
- HPI YoY
- ▼ -2.41%
- Current HPI
- 291.8894
- Rent YoY
- —
- Metro
- —
- State GDP YoY
- —
- F500 in state
- 0
Price history
+34.2% since first listed6 events — show timeline
- 2026-05-03 Relisted — PrimeMLS
- 2026-04-14 Contingent — PrimeMLS
- 2026-03-15 Listed $200,000 PrimeMLS
- 2021-11-17 Sold (MLS) $135,000 PrimeMLS
- 2021-08-28 Contingent — PrimeMLS
- 2021-06-22 Listed $149,000 PrimeMLS
Cash-flow waterfall
monthlySold comps — $/sqft
last 12 mo · ≤1 miLoading sold comps…