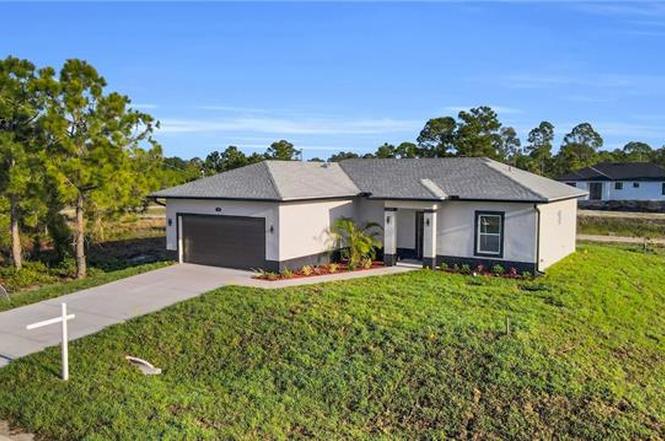
1109 Edgewood St E · Lehigh Acres, FL
Flood risk 6/10 · Moderate
- FEMA flood zone
- X (unshaded)
- Chance of flooding over 30 yrs
- 0.74%
- Est. flood insurance / yr
- $507 – $1,088
Fire risk 2/10 · Minimal
- Est. fire insurance / yr
- $947 – $1,759
Heat risk 9/10 · Severe
- Hot days now (above 109°F)
- 7 days/yr
- Hot days in 30 yrs
- 28 days/yr
Wind risk 10/10 · Severe
- Chance of severe wind over 30 yrs
- 99.0%
Air-quality risk 2/10 · Minimal
- Unhealthy air days now
- 1 days/yr
- Unhealthy air days in 30 yrs
- 2 days/yr
Risk factors via First Street. Map © Google.
Why this score? — see what drove the D- grade
The composite is a weighted blend of 9 inputs, each scored 0–100. Each bar is that input's sub-score; the figure is the points it added to the 100-point composite (weight × sub-score).
- Appreciation +10.0/10.0
- ARV discount +7.5/15.0
- Cash flow +5.9/30.0
- Schools +4.1/10.0
- Livability +3.0/5.0
- Condition / age +2.5/5.0
- 1% rule +1.3/10.0
- Rent growth +1.3/5.0
- DSCR +0.2/10.0
$329,900
🖨 Deal sheet (PDF) 📄 Offer letter ✓ Due diligence
Listing remarks MLS
VERY NICE 3 BEDROOMS WITH 2 FULL BATHS, QUALITY CONSTRUCTION. NICE PORCELAIN FLOORS. MATER BATH WITH 2 SINKS. ITCHEN HAS AN ISLAND WITH BAR STOOLS. LAUNDRY ROOM. QUALITY STAINLESS STEEL APPLIANCES WITH WARRANTY. ENJOY THE VIEW FROM THE PATIO. WATER FOR LAWN IS FROM THE WELL. SPLIT BEDROOM PLAN FOR YOUR CONVENIENCE. 2 CAR GARAGE FOR CONVENIENCE AND STORAGE.
Key facts
- Open patio
- Oversize lot
- Walk in closet
Tags
Property features AI
Finance
- Financial info: Lease considered
Exterior
- Parking: 2-car garage; Driveway with covered parking for 2
- Utilities: Well water; Septic tank
- Home design: Single-story; New construction; Faces south
- Construction: Block construction; Shingle roof
- Exterior features: Open porch; Room for pool; Canal-front waterfront
Interior
- Kitchen: Dishwasher; Electric range; Microwave; Refrigerator
- Bedrooms: Bedroom located on the main level
- Bathrooms: 2 full bathrooms
- Heating & cooling: Central heating; Central air conditioning
- Interior features: First-floor entry; Bedroom on main level
- Laundry & utility: Laundry area in garage
Neighborhood map
What this means for you Summary
Snapshot
- This is a 3-bed/2.0-bath land listed at $330k.
Deal economics
- At list price, monthly cash flow is $-650 ($-8k/yr) — negative.
- To cash-flow at today's rent, offer at most $236k (28.5% below list).
- To meet the 1% rule (rent ≥ 1% of price), the offer needs to be $206k (37.4% below list).
- Recommended offer: $206k (37.4% below list) — sets the bar for 1% rule.
Location & tenants
- Location reads 59/100 on livability (#826 in FL) — a working-class tenant base; expect higher turnover. Strengths: cost of living A+, housing A+; Watch: crime C-, employment D+, amenities F.
- Lee (suburban): math 47% / reading 50% proficiency, ranked #42 of 73 in FL (top 58%) — families likely to look elsewhere, expect single-tenant / working-renter base with shorter leases.
- Zoned schools: Veterans Park Academy For The Arts (math 41% / reading 45%, grade F, #1,366 of 2,144 statewide, top 64%, 2,133 students, 36% FRL); Oak Hammock Middle School (math 43% / reading 41%, grade D-, #340 of 571 statewide, top 61%, 1,563 students, 56% FRL); Lehigh Senior High School (math 23% / reading 45%, grade F, #394 of 667 statewide, top 60%, 2,476 students, 57% FRL).
- Market conditions: Rents falling (-4.7%/yr); 2476 active listings in the ZIP; 26 comparable units currently listed for rent nearby; rentals at typical pace (median 26d on market — plan ~3-4 weeks tenant-placement turnaround); 15,411 units permitted in Lee County in 2024 (4,686 in 5+ unit buildings).
- This rent runs 34% of the median local income ($72k/yr) — at the standard rent-burdened threshold; future hikes will face affordability resistance.
Forward outlook
- In year one you build about $35k of equity ($2k loan paydown + $33k appreciation (10.0% local appreciation)).
- Lee County population projected at +44% by 2050 — long-run rental-demand tailwind backs the buy-and-hold thesis.
- By year 2, paydown + projected appreciation supports a ~$57k cash-out refi (75% LTV) — recoverable capital for the next deal without selling this one.
Negotiation context
- It's been on market 111 days — a 9% lower offer ($300k) is reasonable based on typical stale-listing flexibility.
- 3 sale attempts with the ask held roughly flat each time — persistent listings suggest the price (not the market) is what's stuck; bring a comps-based counter.
- Current owner paid $7k; list at $330k implies a 4482% gain — meaningful room to come down on a strong offer.
Risks & watch-outs
- Climate carrying-cost: major flood risk; severe wind risk, 99% chance of damaging wind over 30y; extreme-heat days projected 7→28/yr by 2055 (HVAC capex compounding) — expect insurance premiums to compound above CPI over the hold.
Questions for the listing agent
- What do current leases actually rent for vs. the listed asking? Can we see a recent rent roll and the last 12 months of T-12 income?
- It's been on market 111 days. Have you received any prior offers? Is the seller open to a 37% concession, seller financing, or rate buy-down credit?
- Why hasn't it sold? Are there any deal-killer items the seller is aware of (foundation, flood, title, zoning, code violations)?
- Is there a deadline driving the sale (1031 exchange, divorce, estate, relocation)? That informs how much negotiation room exists.
- Schools are D-rated, which usually means shorter tenancies and higher turnover. Who's the typical renter profile here, and what's been the actual vacancy rate?
- The area grade is low — what's the realistic commute time and amenity access for the typical tenant pool here? Any planned neighborhood developments (good or bad) we should know about?
- What's the average days-on-market for RENTAL listings here right now (not sales)? A rising rental-DOM trend means longer vacancies and softer asking-rent achievability than the comps imply.
- What's the recent tenant-quality profile in this submarket — average credit score on applications, eviction rate, late-payment / NSF rate, and stable-employment percentage? A property-management company in the area should have these aggregated.
- How much new for-sale + rental construction is in the pipeline within 1–3 miles? Heavy new supply typically softens prices + rents 12–24 months out; constrained supply supports both.
Investment metrics
- 1% rule
- 0.63% ✗
- Cap rate
- 3.93%
- Cash-on-cash
- -8.44%
- DSCR
- 0.62
- GRM
- 13.3
CMA / ARV
No comps found within radius.
Projected returns pro-forma
10.0% appreciation · 0.0% rent growth · sell at horizon
- IRR
- 17.6%
- Equity multiple
- 2.43×
- Total profit
- $132,279
- Equity at exit
- $297,200
- IRR
- 16.1%
- Equity multiple
- 5.45×
- Total profit
- $411,311
- Equity at exit
- $640,923
Cash invested: $92,372 (down + closing). Projections, not guarantees.
Landlord ↔ Tenant lean methodology
- Overall (STATE)
- 87 Strongly Landlord-Friendly
- State Florida
- 87 Strongly Landlord-Friendly · R+3
- County
- — inherits STATE
- City
- — inherits STATE
ZIP-level market 33974
- Home prices YoY
- 5.8%
- Rents YoY
- -4.7%
- Active inventory
- 2476
- Price-to-rent
- 13.3×
Monthly cashflow live
- Estimated rent
- $2,064 high interval (Pro) →
- Mortgage (P&I)
- −$1,730
- Tax est. 1.5%
- −$412 /mo · $4,948/yr
- Insurance
- −$137
- HOA
- −$0
- Vacancy / Maint / Mgmt
- −$433
- Net cashflow
- $-650
Break-even live
Sensitivity live
| Price | -10% $-422 | -5% $-536 | +0% $-650 | +5% $-764 | +10% $-878 |
|---|---|---|---|---|---|
| Rent | -10% $-813 | -5% $-731 | +0% $-650 | +5% $-568 | +10% $-487 |
| Rate | -1.0pp $-484 | -0.5pp $-566 | base $-650 | +0.5pp $-735 | +1.0pp $-822 |
UW: 25.0% down · 7.5% · 30yr · 1.5% tax · 5.0% vac · 8.0% maint · 8.0% mgmt
Financing live
Cash to close
- Down payment
- $82,475
- Closing costs
- $9,897
- Reserves months
- —
- Total cash needed
- —
Loan-product check · same deal, 3 products live
Conventional
25% down · 7.5% · 30yr
- Down + closing
- —
- Monthly P&I
- —
- Monthly cashflow
- —
- DSCR
- —
- Eligible?
- —
Personal DTI + credit; lowest rate.
DSCR
20% down · 8.5% · 30yr
- Down + closing
- —
- Monthly P&I
- —
- Monthly cashflow
- —
- DSCR
- —
- Eligible?
- —
No personal income docs; deal must DSCR.
Hard money
10% down · 12.0% · 12mo
- Down + closing
- —
- Monthly P&I
- —
- Monthly cashflow
- —
- DSCR
- —
- Eligible?
- —
Short-term bridge; refi at stabilization.
Rent comps 26 comps
| Address | Beds | Baths | Sqft | Rent | $/sqft | DOM | Units | Dist |
|---|---|---|---|---|---|---|---|---|
| 1107 Enrique St E Lehigh Acres, FL | 3.0 | 2.0 | 1363 | $1,800 | $1.32 | 25d | 1 | 0.19mi |
| 1121 Deauville St E Lehigh Acres, FL | 3.0 | 2.0 | 1698 | $2,100 | $1.24 | 25d | 1 | 0.43mi |
| 1125 Deauville St E Lehigh Acres, FL | 3.0 | 2.0 | 1292 | $1,900 | $1.47 | 5d | 1 | 0.44mi |
| 1150 Darling St E Lehigh Acres, FL | 3.0 | 2.0 | 1292 | $1,800 | $1.39 | 25d | 1 | 0.44mi |
| 1129 Deauville St E Lehigh Acres, FL | 3.0 | 2.0 | 1698 | $2,100 | $1.24 | 25d | 1 | 0.45mi |
| 1142 Dutchess St E Lehigh Acres, FL | 4.0 | 2.5 | 1632 | $2,400 | $1.47 | 25d | 1 | 0.46mi |
| 1089 Eisenhower Blvd Lehigh Acres, FL | 4.0 | 2.0 | 1639 | $2,000 | $1.22 | 5d | 1 | 0.48mi |
| 1137 Edgerton Ave Lehigh Acres, FL | 3.0 | 2.0 | 2394 | $1,800 | $0.75 | 4d | 1 | 0.68mi |
| 934 Marilyn Ave S Lehigh Acres, FL | 4.0 | 2.0 | 1577 | $2,000 | $1.27 | 4d | 1 | 0.70mi |
| 934 Marilyn Ave S Lehigh Acres, FL | 4.0 | 2.0 | 1577 | $2,000 | $1.27 | 13d | 1 | 0.70mi |
| 936 Eisenhower Blvd Lehigh Acres, FL | 3.0 | 2.0 | 1300 | $1,395 | $1.07 | 5d | 1 | 0.77mi |
| 847 Genoa Ave Lehigh Acres, FL | 3.0 | 2.0 | 1600 | $2,000 | $1.25 | 5d | 1 | 0.81mi |
| 941 Elgin St Lehigh Acres, FL | 3.0 | 2.0 | 1582 | $2,664 | $1.68 | 25d | 1 | 0.85mi |
| 828 Genoa Ave S Lehigh Acres, FL | 4.0 | 2.5 | 1632 | $2,400 | $1.47 | 25d | 1 | 0.95mi |
| 1018 Garnet Ave Lehigh Acres, FL | 3.0 | 2.0 | 1381 | $1,575 | $1.14 | 25d | 1 | 0.99mi |
| 851 Bedford Dr Lehigh Acres, FL | 3.0 | 2.0 | 2364 | $1,600 | $0.68 | 25d | 1 | 1.05mi |
| 851 Eisenhower Blvd Lehigh Acres, FL | 3.0 | 2.0 | 2330 | $1,450 | $0.62 | 12d | 1 | 1.06mi |
| 1253 Columbus Blvd Fort Myers, FL | 3.0 | 2.0 | 1288 | $1,650 | $1.28 | 25d | 1 | 1.06mi |
| 1262 Best Ave Fort Myers, FL | 3.0 | 2.0 | 1288 | $1,600 | $1.24 | 16d | 1 | 1.15mi |
| 827 Eisenhower Blvd Lehigh Acres, FL | 3.0 | 2.5 | 1640 | $1,780 | $1.09 | 13d | 1 | 1.17mi |
| 936 Joponica Ave S Lehigh Acres, FL | 4.0 | 2.0 | 2101 | $2,500 | $1.19 | 25d | 1 | 1.20mi |
| 819 Eisenhower Blvd Unit 819 Lehigh Acres, FL | 3.0 | 2.0 | 1390 | $1,650 | $1.19 | 25d | 1 | 1.20mi |
| 765 Aprile Ave S Lehigh Acres, FL | 4.0 | 2.0 | 1712 | $2,100 | $1.23 | 3d | 1 | 1.38mi |
| 1270 Bermar St Fort Myers, FL | 3.0 | 2.0 | 1408 | $1,660 | $1.18 | 5d | 1 | 1.45mi |
| 1111 Gunby Ave S Unit S Lehigh Acres, FL | 3.0 | 2.0 | 1546 | $2,200 | $1.42 | 4d | 1 | 1.48mi |
| 1076 Gunby Ave S Lehigh Acres, FL | 3.0 | 2.0 | 1258 | $2,100 | $1.67 | 25d | 1 | 1.48mi |
Listing history 23 events
-
2026-06-22days on market $329,900 Active 111 DOM
-
2026-06-17days on market $329,900 Active 107 DOM
-
2026-06-16days on market $329,900 Active 106 DOM
-
2026-06-15days on market $329,900 Active 105 DOM
-
2026-06-13days on market $329,900 Active 103 DOM
-
2026-06-10days on market $329,900 Active 100 DOM
-
2026-06-09days on market $329,900 Active 99 DOM
-
2026-06-07days on market $329,900 Active 97 DOM
-
2026-06-02days on market $329,900 Active 92 DOM
-
2026-06-01days on market $329,900 Active 91 DOM
-
2026-06-01days on market $329,900 Active 90 DOM
-
2026-05-15price $329,900
-
2026-05-07$329,990 Active 358-char remark
Show marketing remark (358 chars)
VERY NICE 3 BEDROOMS WITH 2 FULL BATHS, QUALITY CONSTRUCTION. NICE PORCELAIN FLOORS. MATER BATH WITH 2 SINKS. ITCHEN HAS AN ISLAND WITH BAR STOOLS. LAUNDRY ROOM. QUALITY STAINLESS STEEL APPLIANCES WITH WARRANTY. ENJOY THE VIEW FROM THE PATIO. WATER FOR LAWN IS FROM THE WELL. SPLIT BEDROOM PLAN FOR YOUR CONVENIENCE. 2 CAR GARAGE FOR CONVENIENCE AND STORAGE.
-
2026-03-02$329,990 Active
-
2026-02-28historical
-
2025-10-20price $335,000
-
2025-10-19$329,990 Active
-
2022-06-16soldstatus $7,200
-
2010-05-12soldstatus $7,628
-
2009-05-05soldstatus $74,000
-
2009-04-22soldstatus $12,000
-
2007-06-14soldstatus $10,000
-
2005-05-05soldstatus $50,000
ⓘ Source: listings_history table (triggers on properties + properties_extension) + one-shot
backfill from property_details.listing_events for pre-trigger history.
Climate risk First Street
- Flood 6/10 Major FEMA zone X (unshaded) · 74% chance over 30 yrs
- Wildfire 2/10 Low
- Heat 9/10 Extreme 7 d/yr ≥109°F today · 28 d/yr by 30 yrs out
- Wind 10/10 Extreme 99% chance of damaging wind over 30 yrs
- Air quality 2/10 Low 1 unhealthy d/yr today · 2 by 30 yrs out
Nearby sold comps map
Loading sold comps map…
Walkable amenities ~0.75 mi
Loading nearby amenities…
Taxation est. · year 1
- Rental income
- $24,763
- − Mortgage interest
- −$18,480
- − Property taxes
- −$4,948
- − Insurance
- −$1,650
- − Repairs & maintenance
- −$1,981
- − Management
- −$1,981
- − Depreciation
- −$9,597
- Taxable loss
- −$13,874
- Est. tax savings @ 24.0%
- +$3,330
- After-tax cash flow
- $-4,466/yr
For passive investors: Depreciation is non-cash, so a rental often shows a tax loss while cash-flowing — sheltering income. Rental losses are passive: they offset passive income freely, and up to $25,000/yr can offset ordinary (W-2) income if you actively participate and your MAGI is under $100k (phasing out to $0 by $150k); unused losses carry forward. On sale, claimed depreciation is recaptured at up to 25%, and gains may owe capital-gains tax (a 1031 exchange can defer both). Figures are a year-1 estimate at your 24.0% rate — not tax advice; consult a CPA.
Schools (NCES district)
- District
- Lee
- NCES district ID
- 1201080
- Math proficiency
- 47% ▼ -11.00%
- Reading proficiency
- 50% ▼ -4.00%
- Median HH income
- $49,518
- Composite
- 41.49/100
- National rank
- #3458
- State rank
- #42 of 73 in FL
Livability — Lehigh Acres
- Score
- 59/100
- State rank
- #826
- US rank
- #20055
Category grades
Schools grade is shown separately in the Schools card above.
Census & demographics
- Census place
- Lehigh Acres, FL
- County
- Lee County · 788,662 people
- City population
- 130,638
- Metro
- Cape Coral-Fort Myers, FL
- Population (ZIP)
- 19,927
- Household income
- $72,192
- Rent vs Own
- Severe rent burden
- 434.0
Population outlook (Lee County) Hauer SSP2
- Today (2025)
- 871,946 people
- By 2030
- 955,468 · +9.6%
- By 2040
- 1,113,587 · +27.7%
- By 2050
- 1,256,891 · +44.1%
- By 2075
- 1,560,270 · +78.9%
- By 2100
- 1,726,848 · +98.0%
Race, ethnicity, and origin ACS 2023
- Neighborhood character
- Diverse neighborhood (Simpson 0.64)
- Race & ethnicity
- Hispanic / Latino 52% Two or more races 31% White 26% Black 18%
- Hispanic origin (detail)
- Mexican 12% Puerto Rican 7% Cuban 20% Dominican 4%
- Common ancestry
- Hispanic 7% Italian 1% Portuguese 1%
- Foreign-born
- 32% · Canada, Jamaica
- Languages at home
- 48% English-only · Spanish 43% French/Haitian/Cajun 7% Other Indo-European 1%
Political lean MEDSL · Lee
- 2024 margin
- Strong R (+28.4) · D 35.5% · R 63.9%
- 2008→2024 swing
- -18.0pp toward R · 2008: -10.4pp · 2024: -28.4pp
- All cycles
- 2024: R+28.4 2020: R+19.2 2016: R+20.4 2012: R+16.6 2008: R+10.4
Not yet ingested
- Civics
- —
Market trends
- HPI YoY
- ▲ 16.53%
- Current HPI
- 303.3399
- Rent YoY
- ▼ -4.68%
- Metro
- Cape Coral-Fort Myers, FL
- State GDP YoY
- ▲ 3.28%
- F500 in state
- 36
Industry mix (Fortune 500 HQ in FL)
| Industry | F500 HQs | Revenue |
|---|---|---|
| Industrial Technology | 2 | $29B |
|
||
| Insurance | 2 | $17B |
|
||
| Retail | 1 | $60B |
|
||
| Technology Distribution | 1 | $58B |
|
||
| Homebuilding | 1 | $35B |
|
||
| Technology Manufacturing | 1 | $35B |
|
||
Price history
+559.8% since first listed12 events — show timeline
- 2026-05-15 Price Changed $329,900 MARMLS
- 2026-05-07 Listed $329,990 NAPLESMLS
- 2026-03-02 Listed $329,990 MARMLS
- 2026-02-28 Listing Removed — MARMLS
- 2025-10-20 Price Changed $335,000 MARMLS
- 2025-10-19 Listed $329,990 MARMLS
- 2022-06-16 Sold (Public Records) $7,200 Public Records
- 2010-05-12 Sold (Public Records) $7,628 Public Records
- 2009-05-05 Sold (Public Records) $74,000 Public Records
- 2009-04-22 Sold (Public Records) $12,000 Public Records
- 2007-06-14 Sold (Public Records) $10,000 Public Records
- 2005-05-05 Sold (Public Records) $50,000 Public Records
Property tax history
+9.6%/yrLatest (2025): $422 · +11.6% YoY. Source: county tax records.
Cash-flow waterfall
monthlySold comps — $/sqft
last 12 mo · ≤1 miLoading sold comps…