14011 N Nebraska Ave #54 · University, FL
Flood risk 4/10 · Minor
- FEMA flood zone
- X (unshaded)
- Chance of flooding over 30 yrs
- 0.2%
- Est. flood insurance / yr
- $507 – $1,088
Fire risk 1/10 · Minimal
- Est. fire insurance / yr
- $947 – $1,759
Heat risk 10/10 · Severe
- Hot days now (above 108°F)
- 7 days/yr
- Hot days in 30 yrs
- 25 days/yr
Wind risk 9/10 · Severe
- Chance of severe wind over 30 yrs
- 99.0%
Air-quality risk 3/10 · Minor
- Unhealthy air days now
- 3 days/yr
- Unhealthy air days in 30 yrs
- 3 days/yr
Risk factors via First Street. Map © Google.
Why this score? — see what drove the D grade
The composite is a weighted blend of 9 inputs, each scored 0–100. Each bar is that input's sub-score; the figure is the points it added to the 100-point composite (weight × sub-score).
- Cash flow +15.0/30.0
- ARV discount +7.5/15.0
- 1% rule +5.0/10.0
- DSCR +5.0/10.0
- Schools +4.2/10.0
- Livability +4.2/5.0
- Rent growth +2.3/5.0
- Condition / age +1.0/5.0
- Appreciation +0.0/10.0
$35,000
🖨 Deal sheet 📄 Offer letter ✓ Due diligence
Listing remarks
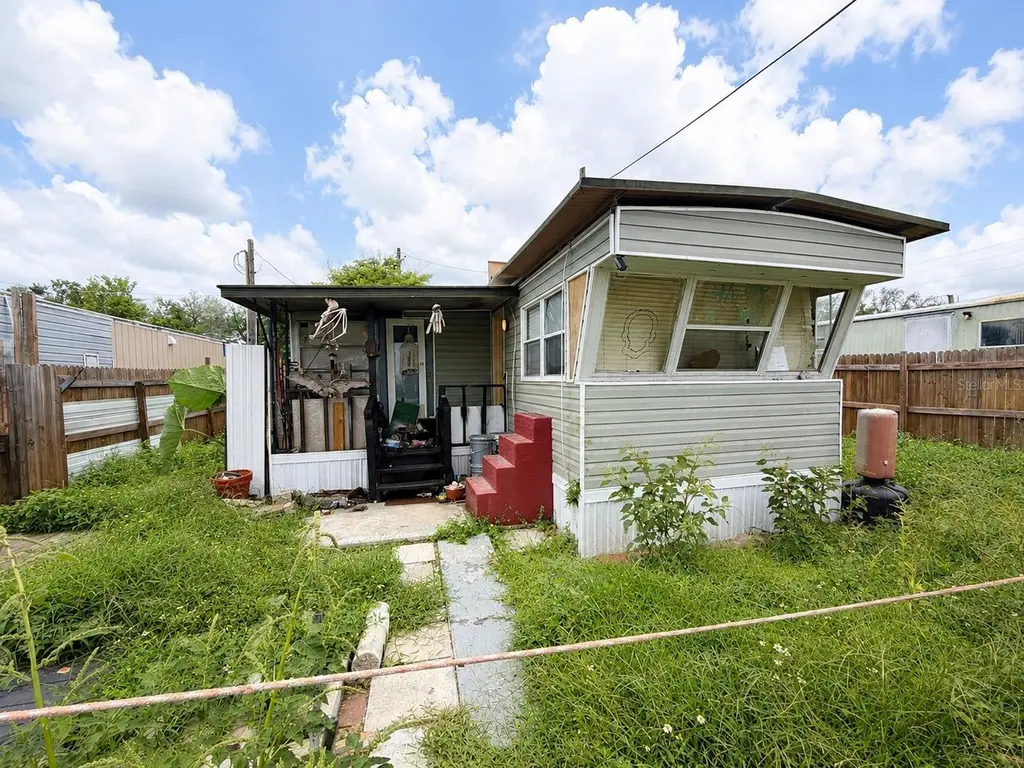
14011 N Nebraska Ave Lot 54, Tampa, FL 33613 is a 3-1 singlewide mobile home. Recently updated with an interior that feels like new throughout. Bathroom needs flooring work, with fixtures already installed. Mobile home foundation; electrical and plumbing are in good condition with only minor bathroom plumbing possibly needed.
Key facts
- 2.64 acre lot
- Built 1949
Property features AI
Finance
- Other: Property zoned CI; Lot size approximately 2.64 acres
- Financial info: No additional financial details provided
- HOA & community: No HOA
Exterior
- Parking: No parking details listed
- Security: No security features listed
- Utilities: Public water available; Public sewer available; Water and sewer connections available
- Home design: Residential mobile home (single wide); One story; Faces north; Entry on main level
- Construction: Metal siding; Metal roof; Pillar/post/pier foundation; Built as single wide mobile home
- Exterior features: Other exterior features
Interior
- Kitchen: No appliances listed
- Bedrooms: 3 bedrooms
- Flooring: Laminate flooring; Tile flooring
- Bathrooms: 1 full bathroom
- Heating & cooling: No heating; No cooling
- Interior features: No interior features listed
- Laundry & utility: Laundry inside
Neighborhood map
What this means for you Summary
Snapshot
- This is a 3-bed/1.0-bath manufactured listed at $35k. Condition is rated poor.
Deal economics
- At list price, monthly cash flow is $1k ($12k/yr) — positive.
- The deal already cash-flows at list — no discount required.
- Meets the 1% rule at list price ($2k rent vs $35k).
- Cap rate 41.5% vs local median 3.9% in University — top-decile yield for the area; either an underpriced asset or a hidden risk that comps aren't pricing in. Stress-test before assuming the spread holds.
Location & tenants
- Location reads 85/100 on livability (#28 in FL, #603 nationally) — a professional / high-income tenant draw. Strengths: amenities A+, commute A+, cost of living A+.
- Hillsborough (suburban): math 47% / reading 50% proficiency, ranked #41 of 73 in FL (top 56%) — families likely to look elsewhere, expect single-tenant / working-renter base with shorter leases.
- Market conditions: Rents soft (-0.7%/yr); 108 active listings in the ZIP; 31 comparable units currently listed for rent nearby; rentals leasing fast (median 5d on market — plan ~1-2 weeks tenant-placement turnaround); lower-income renter base — watch delinquency; 9,053 units permitted in Hillsborough County in 2024 (4,555 in 5+ unit buildings).
- This rent runs 44% of the median local income ($44k/yr) — at the standard rent-burdened threshold; future hikes will face affordability resistance.
Forward outlook
- Local home prices are declining (-3.0%/yr); year-one equity from $242 of loan paydown is wiped out by about $1k of value loss. Plan a longer hold.
- Hillsborough County population projected at +37% by 2050 — long-run rental-demand tailwind backs the buy-and-hold thesis.
- At projected returns (-3.0% appreciation + 0.0% rent growth), your $10k cash investment doubles in ~1 year — after that, you're playing with house money.
Negotiation context
- Only 2 days on market — expect competitive offers; lowballing is unlikely to land.
Risks & watch-outs
- Watch-outs: built in 1949 — expect roof / HVAC / electrical / plumbing capex.
- Climate carrying-cost: severe wind risk, 99% chance of damaging wind over 30y; extreme-heat days projected 7→25/yr by 2055 (HVAC capex compounding) — expect insurance premiums to compound above CPI over the hold.
Questions for the listing agent
- Have any recent inspections been done? Can we get a copy of the seller's disclosures and any deferred-maintenance estimates?
- Built in 1949 — when were the roof, HVAC, electrical panel, plumbing, and water heater last replaced?
- Is there a deadline driving the sale (1031 exchange, divorce, estate, relocation)? That informs how much negotiation room exists.
- The area grade is low — what's the realistic commute time and amenity access for the typical tenant pool here? Any planned neighborhood developments (good or bad) we should know about?
- What's the average days-on-market for RENTAL listings here right now (not sales)? A rising rental-DOM trend means longer vacancies and softer asking-rent achievability than the comps imply.
- What's the recent tenant-quality profile in this submarket — average credit score on applications, eviction rate, late-payment / NSF rate, and stable-employment percentage? A property-management company in the area should have these aggregated.
- How much new for-sale + rental construction is in the pipeline within 1–3 miles? Heavy new supply typically softens prices + rents 12–24 months out; constrained supply supports both.
Investment metrics
- 1% rule
- 4.59% ✓
- Cap rate
- 41.50%
- Cash-on-cash
- 125.76%
- DSCR
- 6.60
- GRM
- 1.8
CMA / ARV
No comps found within radius.
Projected returns pro-forma
-3.0% appreciation · 0.0% rent growth · sell at horizon
- IRR
- —
- Equity multiple
- 6.62×
- Total profit
- $55,057
- Equity at exit
- $5,219
- IRR
- —
- Equity multiple
- 12.64×
- Total profit
- $114,077
- Equity at exit
- $3,026
Cash invested: $9,800 (down + closing). Projections, not guarantees.
Landlord ↔ Tenant lean methodology
- Overall (STATE)
- 87 Strongly Landlord-Friendly
- State Florida
- 87 Strongly Landlord-Friendly · R+3
- County
- — inherits STATE
- City
- — inherits STATE
ZIP-level market 33613
- Rents YoY
- -0.7%
- Active inventory
- 108
- Price-to-rent
- 1.8×
Monthly cashflow live
- Estimated rent
- $1,606 high interval (Pro) →
- Mortgage (P&I)
- −$184
- Tax est. 1.5%
- −$44 /mo · $525/yr
- Insurance
- −$15
- HOA
- −$0
- Vacancy / Maint / Mgmt
- −$337
- Net cashflow
- $1,027
Break-even live
UW: 25.0% down · 7.5% · 30yr · 1.5% tax · 5.0% vac · 8.0% maint · 8.0% mgmt
Financing live
Cash to close
- Down payment
- $8,750
- Closing costs
- $1,050
- Reserves months
- —
- Total cash needed
- —
Loan-product check · same deal, 3 products live
Conventional
25% down · 7.5% · 30yr
- Down + closing
- —
- Monthly P&I
- —
- Monthly cashflow
- —
- DSCR
- —
- Eligible?
- —
Personal DTI + credit; lowest rate.
DSCR
20% down · 8.5% · 30yr
- Down + closing
- —
- Monthly P&I
- —
- Monthly cashflow
- —
- DSCR
- —
- Eligible?
- —
No personal income docs; deal must DSCR.
Hard money
10% down · 12.0% · 12mo
- Down + closing
- —
- Monthly P&I
- —
- Monthly cashflow
- —
- DSCR
- —
- Eligible?
- —
Short-term bridge; refi at stabilization.
Rent comps 31 comps
| Address | Beds | Baths | Sqft | Rent | $/sqft | DOM | Units | Dist |
|---|---|---|---|---|---|---|---|---|
| 1302 Cooperstown Ct Tampa, FL | 1.0–2.0 | 1.0–2.0 | 859 | $1,575 | $1.83 | 1d | 10 | 0.38mi |
| 13944 Sandy Hill Loop Tampa, FL | 1.0–2.0 | 1.0–2.0 | 755 | $1,500 | $1.99 | 2d | 5 | 0.44mi |
| 1250 Skipper Rd Tampa, FL | 1.0–2.0 | 1.0 | 650 | $1,299 | $2.00 | 24d | 1 | 0.52mi |
| 13617 Fletcher Regency Dr Tampa, FL | 1.0–2.0 | 1.0–2.0 | 725 | $1,525 | $2.10 | 23d | 6 | 0.54mi |
| 13533 Gragston Cir Tampa, FL | 1.0–2.0 | 1.0 | 662 | $1,275 | $1.92 | 4d | 6 | 0.58mi |
| 1810 E 143rd Ave Unit 2 Tampa, FL | 3.0 | 1.0 | 730 | $1,345 | $1.84 | 24d | 1 | 0.72mi |
| 13214 Bunn Cir Tampa, FL | 1.0–2.0 | 1.0 | 757 | $1,425 | $1.88 | 24d | 1 | 0.73mi |
| 13710 N 19th St Tampa, FL | 1.0–2.0 | 1.0 | 600 | $1,500 | $2.50 | 4d | 13 | 0.75mi |
| 13911 N 19th St Tampa, FL | 1.0–2.0 | 1.0 | 757 | $1,700 | $2.24 | 13d | 8 | 0.76mi |
| 1426 Marathon Key Dr Tampa, FL | 1.0–2.0 | 1.0 | 773 | $1,675 | $2.17 | 23d | 12 | 0.80mi |
| 202 Windwood Oaks Dr Tampa, FL | 2.0 | 1.0–2.0 | 712 | $1,762 | $2.47 | 1d | 9 | 0.87mi |
| 13036 Kain Palms Ct Tampa, FL | 1.0–3.0 | 1.0–2.0 | 900 | $1,699 | $1.89 | 1d | 6 | 0.92mi |
| 13101 Aarans Pond Dr Tampa, FL | 1.0–2.0 | 1.0–2.0 | 887 | $1,691 | $1.91 | 24d | 1 | 0.94mi |
| 1701 E 131st Ave Tampa, FL | 1.0–2.0 | 1.0 | 647 | $1,384 | $2.14 | 2d | 13 | 0.98mi |
| 13102 N 20th St Tampa, FL | 2.0 | 1.0 | 600 | $1,700 | $2.83 | 4d | 4 | 1.07mi |
| 14609 Banyan Bluff Dr Tampa, FL | 1.0–2.0 | 1.0–2.0 | 868 | $1,749 | $2.01 | 1d | 16 | 1.08mi |
| 12406 N 15th St Tampa, FL | 1.0–2.0 | 1.0 | 725 | $1,305 | $1.80 | 1d | 9 | 1.09mi |
| 2200 Cedar Trace Cir Tampa, FL | 1.0–3.0 | 1.0–2.0 | 950 | $1,700 | $1.79 | 2d | 14 | 1.11mi |
| 14566 Seaford Cir Tampa, FL | 1.0–2.0 | 1.0 | 718 | $1,626 | $2.26 | 2d | 10 | 1.23mi |
| 11738 N 14th St Tampa, FL | 1.0–2.0 | 1.0 | 650 | $1,400 | $2.15 | 24d | 1 | 1.24mi |
| 11733 N 12th St Apt E Tampa, FL | 2.0 | 1.0 | 750 | $1,400 | $1.87 | 19d | 1 | 1.25mi |
| 11733 N 12th St Apt L Tampa, FL | 2.0 | 1.0 | 750 | $1,400 | $1.87 | 24d | 1 | 1.25mi |
| 801 E 120th Ave Tampa, FL | 2.0 | 1.0 | 750 | $1,350 | $1.80 | 24d | 1 | 1.27mi |
| 801 E 120th Ave Tampa, FL | 2.0 | 1.0 | 750 | $1,350 | $1.80 | 19d | 1 | 1.27mi |
| 11734 N 15th St Tampa, FL | 2.0 | 1.0 | 700 | $1,650 | $2.36 | 24d | 1 | 1.28mi |
| 12702 University Club Dr Tampa, FL | 1.0–3.0 | 1.0–2.0 | 919 | $2,067 | $2.25 | 1d | 36 | 1.33mi |
| 2015 Blue Rock Dr Tampa, FL | 1.0–2.0 | 1.0–2.0 | 850 | $1,699 | $2.00 | 2d | 20 | 1.35mi |
| 2902 Sycamore Ct Tampa, FL | 3.0 | 1.0–2.0 | 850 | $1,650 | $1.94 | 2d | 21 | 1.38mi |
| 1414 Maluhia Dr Tampa, FL | 2.0 | 1.0 | 672 | $1,850 | $2.75 | 24d | 1 | 1.40mi |
| 2812 Somerset Park Dr Tampa, FL | 1.0–3.0 | 1.0–2.0 | 991 | $1,595 | $1.61 | 13d | 2 | 1.43mi |
| 2812 Somerset Park Dr Tampa, FL | 1.0–3.0 | 1.0–2.0 | 991 | $1,525 | $1.54 | 2d | 2 | 1.43mi |
Listing history 4 events
-
2026-06-09statusdays on market $35,000 Active 2 DOM
-
2026-06-07status $35,000 Pending 1 DOM
-
2026-06-04remarks 327-char remark
-
2026-06-04$35,000 Active 1 DOM
ⓘ Source: listings_history table (triggers on properties + properties_extension) + one-shot
backfill from property_details.listing_events for pre-trigger history.
Climate risk First Street
- Flood 4/10 Moderate FEMA zone X (unshaded) · 20% chance over 30 yrs
- Wildfire 1/10 Low
- Heat 10/10 Extreme 7 d/yr ≥108°F today · 25 d/yr by 30 yrs out
- Wind 9/10 Extreme 99% chance of damaging wind over 30 yrs
- Air quality 3/10 Moderate 3 unhealthy d/yr today · 3 by 30 yrs out
Nearby sold comps map
Loading sold comps map…
Walkable amenities ~0.75 mi
Loading nearby amenities…
Taxation est. · year 1
- Rental income
- $19,274
- − Mortgage interest
- −$1,961
- − Property taxes
- −$525
- − Insurance
- −$175
- − Repairs & maintenance
- −$1,542
- − Management
- −$1,542
- − Depreciation
- −$1,018
- Taxable income
- $12,512
- Est. tax owed @ 24.0%
- −$3,003
- After-tax cash flow
- $9,321/yr
For passive investors: Depreciation is non-cash, so a rental often shows a tax loss while cash-flowing — sheltering income. Rental losses are passive: they offset passive income freely, and up to $25,000/yr can offset ordinary (W-2) income if you actively participate and your MAGI is under $100k (phasing out to $0 by $150k); unused losses carry forward. On sale, claimed depreciation is recaptured at up to 25%, and gains may owe capital-gains tax (a 1031 exchange can defer both). Figures are a year-1 estimate at your 24.0% rate — not tax advice; consult a CPA.
Condition & rehab AI · 6 photos
This mobile home requires extensive repairs and maintenance, including fencing and roof work, to improve its condition and value.
Repairs flagged
- Major fencing — Damaged and overgrown
- Major roof — Signs of wear and tear
- Major interior vegetation — Overgrown and needs removal
Value-add opportunities
- Both Landscaping and fencing repair — Improves curb appeal and safety
- Both Interior cleaning and vegetation removal — Enhances interior and exterior appearance
- Both Roof repair — Critical for structural integrity and safety
Renovation cost estimate screening
| Repair item | Severity | Est. cost |
|---|---|---|
| fencing · Damaged and overgrown | Major | $15,000–50,000 |
| roof · Signs of wear and tear | Major | $15,000–50,000 |
| interior vegetation · Overgrown and needs removal | Major | $15,000–50,000 |
| Total estimated repair cost · 3 items | $45,000–150,000 |
Value-add ROI direction
- Both Landscaping and fencing repair — Improves curb appeal and safety ↑
- Both Interior cleaning and vegetation removal — Enhances interior and exterior appearance ↑
- Both Roof repair — Critical for structural integrity and safety ↑
ⓘ Cost ranges are severity-bucket heuristics (US national rule-of-thumb). Get contractor quotes + a written scope before underwriting a rehab budget.
Schools (NCES district)
- District
- Hillsborough
- NCES district ID
- 1200870
- Math proficiency
- 47% ▼ -8.00%
- Reading proficiency
- 50% ▼ -4.00%
- Median HH income
- $50,622
- Composite
- 41.6/100
- National rank
- #3435
- State rank
- #41 of 73 in FL
Livability — University
- Score
- 85/100
- State rank
- #28
- US rank
- #603
Category grades
Schools grade is shown separately in the Schools card above.
Census & demographics
- Census place
- University, FL
- County
- Hillsborough County · 1,540,968 people
- City population
- 41,570
- Metro
- Tampa-St. Petersburg-Clearwater, FL
- Population (ZIP)
- 37,591
- Household income
- $44,032
- Rent vs Own
- Severe rent burden
- 4426.0
Population outlook (Hillsborough County) Hauer SSP2
- Today (2025)
- 1,607,022 people
- By 2030
- 1,733,968 · +7.9%
- By 2040
- 1,979,565 · +23.2%
- By 2050
- 2,203,427 · +37.1%
- By 2075
- 2,667,893 · +66.0%
- By 2100
- 2,891,558 · +79.9%
Race, ethnicity, and origin ACS 2023
- Neighborhood character
- Diverse neighborhood (Simpson 0.69)
- Race & ethnicity
- White 39% Hispanic / Latino 35% Black 18% Two or more races 16% Asian 5% Native American 1%
- Hispanic origin (detail)
- Mexican 9% Puerto Rican 9% Cuban 6% Dominican 2%
- Common ancestry
- Hispanic 2% Lithuanian 1% Slovak 1%
- Foreign-born
- 24% · Canada, China, Jamaica
- Languages at home
- 62% English-only · Spanish 28% French/Haitian/Cajun 3% Other Indo-European 2%
Political lean MEDSL · Hillsborough
- 2024 margin
- Toss-up / Even · D 47.8% · R 50.9% · Other 1.3%
- 2008→2024 swing
- -10.2pp toward R · 2008: 7.1pp · 2024: -3.1pp
- All cycles
- 2024: R+3.1 2020: D+6.9 2016: D+6.8 2012: D+6.7 2008: D+7.1
Not yet ingested
- Civics
- —
Market trends
- HPI YoY
- ▼ -329.59%
- Current HPI
- 367.4057
- Rent YoY
- ▼ -0.69%
- Metro
- Tampa-St. Petersburg-Clearwater, FL
- State GDP YoY
- ▲ 3.28%
- F500 in state
- 36
Industry mix (Fortune 500 HQ in FL)
| Industry | F500 HQs | Revenue |
|---|---|---|
| Industrial Technology | 2 | $29B |
|
||
| Insurance | 2 | $17B |
|
||
| Retail | 1 | $60B |
|
||
| Technology Distribution | 1 | $58B |
|
||
| Homebuilding | 1 | $35B |
|
||
| Technology Manufacturing | 1 | $35B |
|
||
Price history
2 events — show timeline
- 2026-06-04 Pending — Stellar MLS as Distributed by MLS Grid
- 2026-06-03 Listed $35,000 Stellar MLS as Distributed by MLS Grid
Cash-flow waterfall
monthlySold comps — $/sqft
last 12 mo · ≤1 miLoading sold comps…