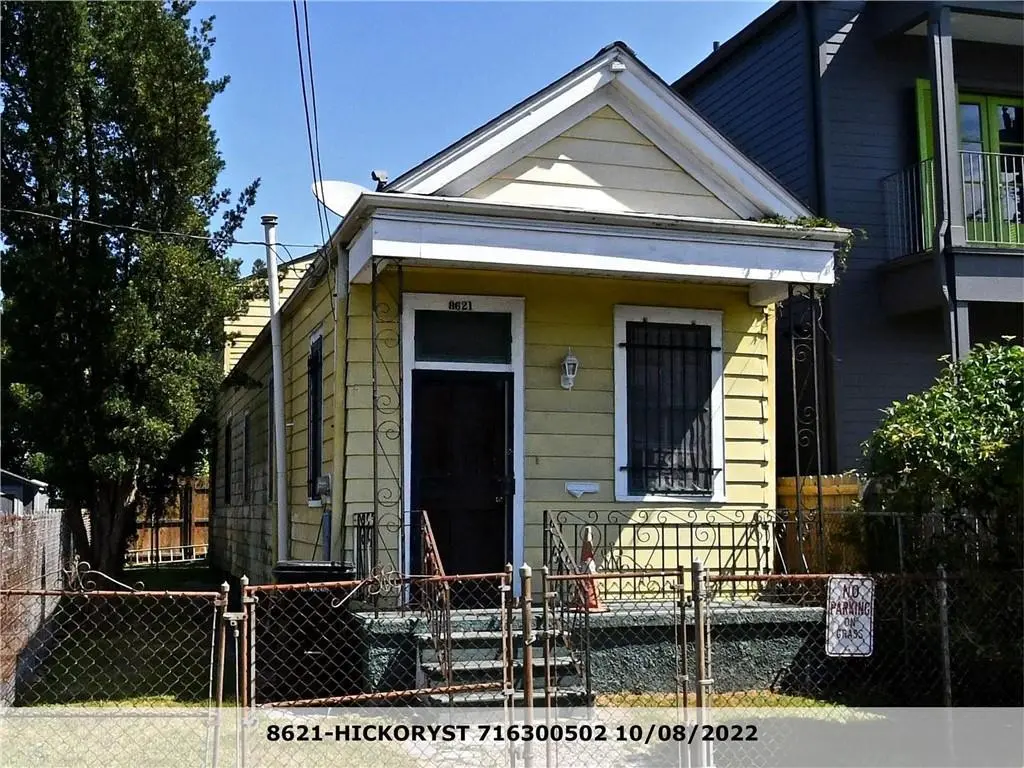
8621 Hickory St · New Orleans, LA
Flood risk 8/10 · Major
- FEMA flood zone
- X
- Chance of flooding over 30 yrs
- 0.6%
- Est. flood insurance / yr
- $507 – $1,088
Fire risk 1/10 · Minimal
- Est. fire insurance / yr
- $1,269 – $2,357
Heat risk 10/10 · Severe
- Hot days now (above 108°F)
- 7 days/yr
- Hot days in 30 yrs
- 21 days/yr
Wind risk 10/10 · Severe
- Chance of severe wind over 30 yrs
- 99.0%
Air-quality risk 4/10 · Minor
- Unhealthy air days now
- 4 days/yr
- Unhealthy air days in 30 yrs
- 4 days/yr
Risk factors via First Street. Map © Google.
Why this score? — see what drove the C grade
The composite is a weighted blend of 9 inputs, each scored 0–100. Each bar is that input's sub-score; the figure is the points it added to the 100-point composite (weight × sub-score).
- Cash flow +25.8/30.0
- DSCR +8.7/10.0
- ARV discount +7.5/15.0
- 1% rule +6.6/10.0
- Livability +4.0/5.0
- Rent growth +2.7/5.0
- Condition / age +2.5/5.0
- Schools +1.6/10.0
- Appreciation +0.0/10.0
$150,000
🖨 Deal sheet 📄 Offer letter ✓ Due diligence
Listing remarks MLS
Discover the potential of this classic 3-bedroom, 1-bath shotgun-style home located in the heart of the historic Carrollton neighborhood. Full of architectural charm and New Orleans character, this property is an investor special ready for renovations and revival. Just steps from local restaurants, cafés, and neighborhood hotspots, this location offers strong appeal for both long-term renters and short-term visitors. Carrollton is known for its vibrant community spirit, where festivals, live music, and cultural events take place year-round—making this an ideal opportunity to capitalize on steady demand. Bring your vision, restore its charm, and * * turn this property into your next cash cow. * * Whether you're building your portfolio or renovating for resale, the upside here is undeniable.
Key facts
- Architectural charm
- Investor special
- Local restaurants
Tags
Neighborhood map
What this means for you Summary
Snapshot
- This is a 3-bed/2.0-bath single-family listed at $150k.
Deal economics
- At list price, monthly cash flow is $299 ($4k/yr) — positive.
- The deal already cash-flows at list — no discount required.
- Meets the 1% rule at list price ($2k rent vs $150k).
- Recommended offer: $132k (12.0% below list) — sets the bar for market timing.
- Cap rate 9.2% vs local median 4.4% in New Orleans — top-decile yield for the area; either an underpriced asset or a hidden risk that comps aren't pricing in. Stress-test before assuming the spread holds.
Location & tenants
- Location reads 81/100 on livability (#3 in LA, #1,383 nationally) — a professional / high-income tenant draw. Strengths: amenities A+, commute A+, health & safety A+; Watch: crime C-, employment D.
- Orleans Parish (urban): math 11% / reading 27% proficiency, ranked #69 of 98 in LA (top 70%) — low school quality limits family demand, transient renter base, plan for 1-2y turnover; 68% free/reduced lunch — lower-income household profile, screen leases tightly.
- Market conditions: Rents flat; 279 active listings in the ZIP; 40 comparable units currently listed for rent nearby; rentals at typical pace (median 17d on market — plan ~3-4 weeks tenant-placement turnaround); 710 units permitted in Orleans Parish in 2024 (244 in 5+ unit buildings).
- This rent runs 33% of the median local income ($64k/yr) — at the standard rent-burdened threshold; future hikes will face affordability resistance.
Forward outlook
- Local home prices are declining (-3.0%/yr); year-one equity from $1k of loan paydown is wiped out by about $4k of value loss. Plan a longer hold.
- Orleans County population projected at +61% by 2050 — long-run rental-demand tailwind backs the buy-and-hold thesis.
Negotiation context
- It's been on market 206 days — a 12% lower offer ($132k) is reasonable based on typical stale-listing flexibility.
- 4 sale attempts since 23y ago with the ask held roughly flat each time — persistent listings suggest the price (not the market) is what's stuck; bring a comps-based counter.
- Current owner paid $30k; list at $150k implies a 400% gain — meaningful room to come down on a strong offer.
Risks & watch-outs
- Watch-outs: flood insurance adds $66/mo.
- Climate carrying-cost: severe flood risk; severe wind risk, 99% chance of damaging wind over 30y; extreme-heat days projected 7→21/yr by 2055 (HVAC capex compounding) — expect insurance premiums to compound above CPI over the hold.
Questions for the listing agent
- It's been on market 206 days. Have you received any prior offers? Is the seller open to a 12% concession, seller financing, or rate buy-down credit?
- Built in 1968 — when were the roof, HVAC, electrical panel, plumbing, and water heater last replaced?
- What's the actual annual flood-insurance premium (NFIP or private), and is the property in a SFHA with mandatory coverage?
- Why hasn't it sold? Are there any deal-killer items the seller is aware of (foundation, flood, title, zoning, code violations)?
- Is there a deadline driving the sale (1031 exchange, divorce, estate, relocation)? That informs how much negotiation room exists.
- What's the average days-on-market for RENTAL listings here right now (not sales)? A rising rental-DOM trend means longer vacancies and softer asking-rent achievability than the comps imply.
- What's the recent tenant-quality profile in this submarket — average credit score on applications, eviction rate, late-payment / NSF rate, and stable-employment percentage? A property-management company in the area should have these aggregated.
- How much new for-sale + rental construction is in the pipeline within 1–3 miles? Heavy new supply typically softens prices + rents 12–24 months out; constrained supply supports both.
Investment metrics
- 1% rule
- 1.16% ✓
- Cap rate
- 9.22%
- Cash-on-cash
- 10.45%
- DSCR
- 1.47
- GRM
- 7.2
CMA / ARV
- ARV (median comp)
- $301,351
- List price
- $150,000
- Delta
- -50.22%
- Verdict
- UNDERPRICED
- Comps
- 20 within 1.0 mi
Show comp detail 12 sales within ~0.75 mi
| Address | Dist | Beds/Ba | Sqft | Sold | Price | $/sf | Match |
|---|---|---|---|---|---|---|---|
| 8426 Green St | 0.16mi | 2/2.0 (-1) | 1,130 (+5%) | 2mo | $260,000 | $230 | 78 |
| 8607 Willow St | 0.26mi | 2/2.0 (-1) | 1,046 (-3%) | 1mo | $340,000 | $325 | 76 |
| 8528 Jeannette St | 0.23mi | 2/2.0 (-1) | 1,200 (+11%) | 1mo | $349,000 | $291 | 64 |
| 2419 Short St | 0.64mi | 2/2.0 (-1) | 1,077 (-0%) | 2mo | $350,000 | $325 | 63 |
| 905 Odwyer Pl | 0.42mi | 4/2.0 (+1) | 1,135 (+5%) | 5mo | $260,000 | $229 | 62 |
| 1419 Cambronne St | 0.31mi | 2/2.0 (-1) | 1,186 (+10%) | 4mo | $365,000 | $308 | 61 |
| 1520 Adams St | 0.66mi | 2/1.0 (-1) | 1,069 (-1%) | 1mo | $375,000 | $351 | 58 |
| 8320 S Claiborne Ave | 0.42mi | 3/2.0 | 1,217 (+13%) | 8mo | $183,000 | $150 | 52 |
| 2529 Eagle St | 0.53mi | 2/2.0 (-1) | 1,140 (+6%) | 10mo | $143,000 | $125 | 52 |
| 2018 Adams St | 0.65mi | 2/1.0 (-1) | 1,033 (-4%) | 10mo | $315,000 | $305 | 45 |
| 7405 Spruce St | 0.73mi | 2/2.0 (-1) | 1,202 (+11%) | 1mo | $300,000 | $250 | 41 |
| 2104 Lowerline St | 0.73mi | 2/1.0 (-1) | 1,152 (+7%) | 10mo | $278,000 | $241 | 37 |
Match score weights: distance 35% · size 25% · config 20% · recency 20%. Top-matched comps best support the ARV.
Projected returns pro-forma
-3.0% appreciation · 0.97% rent growth · sell at horizon
- IRR
- -5.7%
- Equity multiple
- 0.79×
- Total profit
- $-8,673
- Equity at exit
- $22,365
- IRR
- 1.3%
- Equity multiple
- 1.08×
- Total profit
- $3,481
- Equity at exit
- $12,969
Cash invested: $42,000 (down + closing). Projections, not guarantees.
Landlord ↔ Tenant lean methodology
- Overall (STATE)
- 90 Strongly Landlord-Friendly
- State Louisiana
- 90 Strongly Landlord-Friendly · R+12
- County
- — inherits STATE
- City
- — inherits STATE
ZIP-level market 70118
- Rents YoY
- 1.0%
- Active inventory
- 279
- Price-to-rent
- 7.2×
Monthly cashflow live
- Estimated rent
- $1,740 high interval (Pro) →
- Mortgage (P&I)
- −$787
- Tax from tax record
- −$159 /mo · $1,911/yr
- Insurance
- −$62
- Flood insurance flood zone
- −$66 /mo · $798/yr
- HOA
- −$0
- Vacancy / Maint / Mgmt
- −$365
- Net cashflow
- $299
Break-even live
UW: 25.0% down · 7.5% · 30yr · 1.5% tax · 5.0% vac · 8.0% maint · 8.0% mgmt
Financing live
Cash to close
- Down payment
- $37,500
- Closing costs
- $4,500
- Reserves months
- —
- Total cash needed
- —
Loan-product check · same deal, 3 products live
Conventional
25% down · 7.5% · 30yr
- Down + closing
- —
- Monthly P&I
- —
- Monthly cashflow
- —
- DSCR
- —
- Eligible?
- —
Personal DTI + credit; lowest rate.
DSCR
20% down · 8.5% · 30yr
- Down + closing
- —
- Monthly P&I
- —
- Monthly cashflow
- —
- DSCR
- —
- Eligible?
- —
No personal income docs; deal must DSCR.
Hard money
10% down · 12.0% · 12mo
- Down + closing
- —
- Monthly P&I
- —
- Monthly cashflow
- —
- DSCR
- —
- Eligible?
- —
Short-term bridge; refi at stabilization.
Rent comps 40 comps
| Address | Beds | Baths | Sqft | Rent | $/sqft | DOM | Units | Dist |
|---|---|---|---|---|---|---|---|---|
| 8609 Green St New Orleans, LA | 3.0 | 2.0 | 1009 | $1,800 | $1.78 | 17d | 1 | 0.04mi |
| 8607 Green St New Orleans, LA | 2.0 | 1.0 | 735 | $1,300 | $1.77 | 23d | 1 | 0.04mi |
| 8635 Green St New Orleans, LA | 3.0 | 1.0 | 950 | $950 | $1.00 | 14d | 1 | 0.04mi |
| 8626 Green St New Orleans, LA | 3.0 | 1.5 | 1450 | $1,500 | $1.03 | 17d | 1 | 0.06mi |
| 1730 Joliet St New Orleans, LA | 2.0 | 1.0 | 850 | $1,400 | $1.65 | 3d | 1 | 0.08mi |
| 1600 Monroe St Unit 1B New Orleans, LA | 2.0 | 1.0 | 850 | $1,550 | $1.82 | 17d | 1 | 0.12mi |
| 1600 Monroe St Unit 2A New Orleans, LA | 2.0 | 1.0 | 791 | $1,750 | $2.21 | 17d | 1 | 0.12mi |
| 1820 Cambronne St New Orleans, LA | 2.0 | 1.5 | 900 | $1,600 | $1.78 | 14d | 1 | 0.15mi |
| 1822 Cambronne St New Orleans, LA | 2.0 | 1.5 | 900 | $1,600 | $1.78 | 14d | 1 | 0.15mi |
| 1916 Eagle St New Orleans, LA | 3.0 | 2.0 | 1000 | $1,250 | $1.25 | 23d | 1 | 0.16mi |
| 1916 Eagle St New Orleans, LA | 3.0 | 2.0 | 1000 | $1,250 | $1.25 | 2d | 1 | 0.16mi |
| 8423 Cohn St New Orleans, LA | 2.0 | 2.0 | 887 | $1,700 | $1.92 | 23d | 1 | 0.17mi |
| 8421 Cohn St New Orleans, LA | 2.0 | 2.0 | 887 | $1,750 | $1.97 | 23d | 1 | 0.17mi |
| 1701 Cambronne St New Orleans, LA | 2.0 | 1.0 | 900 | $1,800 | $2.00 | 23d | 1 | 0.17mi |
| 8515 Jeannette St New Orleans, LA | 2.0 | 2.0 | 1215 | $2,000 | $1.65 | 16d | 1 | 0.17mi |
| 1836 General Ogden St New Orleans, LA | 3.0 | 2.0 | 1368 | $1,675 | $1.22 | 23d | 1 | 0.21mi |
| 8927 Hickory St New Orleans, LA | 2.0 | 1.0 | 1440 | $1,500 | $1.04 | 23d | 1 | 0.21mi |
| 1526 Dante St New Orleans, LA | 3.0 | 3.0 | 1446 | $3,000 | $2.07 | 17d | 1 | 0.25mi |
| 8227 Green St Unit B New Orleans, LA | 2.0 | 1.0 | 800 | $1,200 | $1.50 | 23d | 1 | 0.25mi |
| 8526 Willow St New Orleans, LA | 2.0 | 1.0 | 1056 | $1,475 | $1.40 | 23d | 1 | 0.26mi |
| 8231 Birch St Unit A New Orleans, LA | 2.0 | 1.0 | 800 | $1,645 | $2.06 | 23d | 1 | 0.26mi |
| 1517 Dante St New Orleans, LA | 3.0 | 1.0 | 1500 | $1,700 | $1.13 | 17d | 1 | 0.28mi |
| 2022 Dante St New Orleans, LA | 2.0 | 1.0 | 989 | $1,300 | $1.31 | 3d | 1 | 0.28mi |
| 8943 Jeannette St New Orleans, LA | 2.0 | 2.0 | 1040 | $1,375 | $1.32 | 11d | 1 | 0.29mi |
| 8634 Plum St New Orleans, LA | 2.0 | 1.0 | 750 | $1,450 | $1.93 | 11d | 1 | 0.33mi |
| 1311 General Ogden St New Orleans, LA | 2.0 | 1.0 | 730 | $990 | $1.36 | 23d | 1 | 0.34mi |
| 117 Addison St New Orleans, LA | 2.0 | 1.5 | 1088 | $1,350 | $1.24 | 23d | 1 | 0.35mi |
| 127 Addison St New Orleans, LA | 2.0 | 1.0 | 800 | $1,500 | $1.88 | 43d | 1 | 0.36mi |
| 2305 Joliet St New Orleans, LA | 3.0 | 2.0 | 1451 | $2,500 | $1.72 | 43d | 1 | 0.38mi |
| 2311 Joliet St New Orleans, LA | 2.0 | 2.0 | 950 | $1,900 | $2.00 | 23d | 1 | 0.39mi |
| 8416 Oak St New Orleans, LA | 2.0 | 2.0 | 1223 | $2,650 | $2.17 | 43d | 2 | 0.42mi |
| 8416 Oak St Unit F New Orleans, LA | 2.0 | 2.0 | 1109 | $2,800 | $2.52 | 14d | 1 | 0.42mi |
| 8537 S Claiborne Ave New Orleans, LA | 2.0 | 1.0 | 1450 | $1,400 | $0.97 | 3d | 1 | 0.46mi |
| 8539 Freret St New Orleans, LA | 2.0 | 2.5 | 1180 | $2,800 | $2.37 | 3d | 1 | 0.50mi |
| 2428 Eagle St New Orleans, LA | 2.0 | 1.0 | 840 | $1,425 | $1.70 | 23d | 1 | 0.51mi |
| 8633 Nelson St New Orleans, LA | 2.0 | 1.0 | 800 | $1,100 | $1.38 | 2d | 1 | 0.52mi |
| 7817 Birch St New Orleans, LA | 2.0 | 1.0 | 1300 | $1,500 | $1.15 | 3d | 1 | 0.56mi |
| 7815 Birch St New Orleans, LA | 2.0 | 1.0 | 1200 | $1,500 | $1.25 | 3d | 1 | 0.56mi |
| 2103 Fern St New Orleans, LA | 2.0 | 1.0 | 920 | $1,750 | $1.90 | 3d | 1 | 0.57mi |
| 7810 Spruce St New Orleans, LA | 2.0 | 1.0 | 1065 | $2,300 | $2.16 | 23d | 1 | 0.57mi |
Listing history 19 events
-
2026-06-18days on market $150,000 Active 206 DOM
-
2026-06-17days on market $150,000 Active 205 DOM
-
2026-06-16days on market $150,000 Active 204 DOM
-
2026-06-15days on market $150,000 Active 203 DOM
-
2026-06-13days on market $150,000 Active 201 DOM
-
2026-06-10days on market $150,000 Active 198 DOM
-
2026-06-09days on market $150,000 Active 197 DOM
-
2026-06-08days on market $150,000 Active 196 DOM
-
2026-06-07days on market $150,000 Active 195 DOM
-
2026-06-05days on market $150,000 Active 192 DOM
-
2026-06-03days on market $150,000 Active 191 DOM
-
2026-06-02days on market $150,000 Active 190 DOM
-
2026-06-01days on market $150,000 Active 189 DOM
-
2026-05-31days on market $150,000 Active 188 DOM
-
2025-11-24$150,000 Active 817-char remark
Show marketing remark (797 chars)
Discover the potential of this classic 3-bedroom, 1-bath shotgun-style home located in the heart of the historic Carrollton neighborhood. Full of architectural charm and New Orleans character, this property is an investor special ready for renovations and revival. Just steps from local restaurants, cafes, and neighborhood hotspots, this location offers strong appeal for both long-term renters and short-term visitors. Carrollton is known for its vibrant community spirit, where festivals, live music, and cultural events take place year-round--making this an ideal opportunity to capitalize on steady demand. Bring your vision, restore its charm, and **turn this property into your next cash cow.** Whether you're building your portfolio or renovating for resale, the upside here is undeniable.
-
2025-11-24$150,000 Active 797-char remark
Show marketing remark (797 chars)
Discover the potential of this classic 3-bedroom, 1-bath shotgun-style home located in the heart of the historic Carrollton neighborhood. Full of architectural charm and New Orleans character, this property is an investor special ready for renovations and revival. Just steps from local restaurants, cafes, and neighborhood hotspots, this location offers strong appeal for both long-term renters and short-term visitors. Carrollton is known for its vibrant community spirit, where festivals, live music, and cultural events take place year-round--making this an ideal opportunity to capitalize on steady demand. Bring your vision, restore its charm, and **turn this property into your next cash cow.** Whether you're building your portfolio or renovating for resale, the upside here is undeniable.
-
2003-03-27soldstatus $30,000
-
2003-01-28$30,000
-
2003-01-28$30,000
ⓘ Source: listings_history table (triggers on properties + properties_extension) + one-shot
backfill from property_details.listing_events for pre-trigger history.
Tax reassessment forecast LA · Resets to sale price
- Current annual tax
- $1,911 · $159/mo
- Projected year-2 tax
- $1,911 · $159/mo
- Expected delta
- $0/yr ($0/mo · 0.0%)
ⓘ Screening estimate from a state-policy table — verify with the county assessor before closing.
Climate risk First Street
- Flood 8/10 Severe FEMA zone X · 60% chance over 30 yrs
- Wildfire 1/10 Low
- Heat 10/10 Extreme 7 d/yr ≥108°F today · 21 d/yr by 30 yrs out
- Wind 10/10 Extreme 99% chance of damaging wind over 30 yrs
- Air quality 4/10 Moderate 4 unhealthy d/yr today · 4 by 30 yrs out
Nearby sold comps map
Loading sold comps map…
Walkable amenities ~0.75 mi
Loading nearby amenities…
Taxation est. · year 1
- Rental income
- $20,874
- − Mortgage interest
- −$8,402
- − Property taxes
- −$1,911
- − Insurance
- −$1,547
- − Repairs & maintenance
- −$1,670
- − Management
- −$1,670
- − Depreciation
- −$4,364
- Taxable income
- $1,309
- Est. tax owed @ 24.0%
- −$314
- After-tax cash flow
- $3,278/yr
For passive investors: Depreciation is non-cash, so a rental often shows a tax loss while cash-flowing — sheltering income. Rental losses are passive: they offset passive income freely, and up to $25,000/yr can offset ordinary (W-2) income if you actively participate and your MAGI is under $100k (phasing out to $0 by $150k); unused losses carry forward. On sale, claimed depreciation is recaptured at up to 25%, and gains may owe capital-gains tax (a 1031 exchange can defer both). Figures are a year-1 estimate at your 24.0% rate — not tax advice; consult a CPA.
Schools (NCES district)
- District
- Orleans Parish
- NCES district ID
- 2201170
- Math proficiency
- 11% ▼ -52.00%
- Reading proficiency
- 27% ▼ -46.00%
- Median HH income
- $37,011
- Composite
- 15.78/100
- National rank
- #9271
- State rank
- #69 of 98 in LA
Livability — New Orleans
- Score
- 81/100
- State rank
- #3
- US rank
- #1383
Category grades
Schools grade is shown separately in the Schools card above.
Census & demographics
- Census place
- New Orleans, LA
- County
- Orleans Parish · 338,817 people
- City population
- 338,817
- Metro
- New Orleans-Metairie, LA
- Population (ZIP)
- 36,072
- Household income
- $63,750
- Rent vs Own
- Severe rent burden
- 2237.0
Population outlook (Orleans County) Hauer SSP2
- Today (2025)
- 513,025 people
- By 2030
- 575,781 · +12.2%
- By 2040
- 700,174 · +36.5%
- By 2050
- 826,541 · +61.1%
- By 2075
- 1,123,374 · +119.0%
- By 2100
- 1,355,609 · +164.2%
Race, ethnicity, and origin ACS 2023
- Neighborhood character
- Diverse neighborhood (Simpson 0.65)
- Race & ethnicity
- White 47% Black 34% Hispanic / Latino 11% Two or more races 11% Asian 4%
- Hispanic origin (detail)
- Mexican 2%
- Common ancestry
- Lithuanian 8% Italian 2% Romanian 2%
- Foreign-born
- 9% · Canada, China
- Languages at home
- 86% English-only · Spanish 7% French/Haitian/Cajun 2% Other Indo-European 2%
Political lean MEDSL · Orleans
- 2024 margin
- Solid D (+67.0) · D 82.2% · R 15.2% · Other 2.7%
- 2008→2024 swing
- +6.7pp toward D · 2008: 60.3pp · 2024: 67.0pp
- All cycles
- 2024: D+67.0 2020: D+68.2 2016: D+66.2 2012: D+62.5 2008: D+60.3
Not yet ingested
- Civics
- —
Market trends
- HPI YoY
- ▼ -210.46%
- Current HPI
- 282.9629
- Rent YoY
- ▲ 0.97%
- Metro
- New Orleans-Metairie, LA
- State GDP YoY
- ▲ 3.29%
- F500 in state
- 10
Industry mix (Fortune 500 HQ in LA)
| Industry | F500 HQs | Revenue |
|---|---|---|
| Telecommunications | 2 | $23B |
|
||
| Utilities | 1 | $12B |
|
||
| Wholesale / Distribution | 1 | $5B |
|
||
| Advertising | 1 | $2B |
|
||
Price history
+400.0% since first listed5 events — show timeline
- 2025-11-24 Listed $150,000 AcadianaMLS
- 2025-11-24 Listed $150,000 GSREIN
- 2003-03-27 Sold (MLS) $30,000 GSREIN
- 2003-01-28 Listed $30,000 AcadianaMLS
- 2003-01-28 Listed $30,000 GSREIN
Property tax history
+12.7%/yrLatest (2026): $1,911 · +1.1% YoY. Source: county tax records.
Cash-flow waterfall
monthlySold comps — $/sqft
last 12 mo · ≤1 miLoading sold comps…