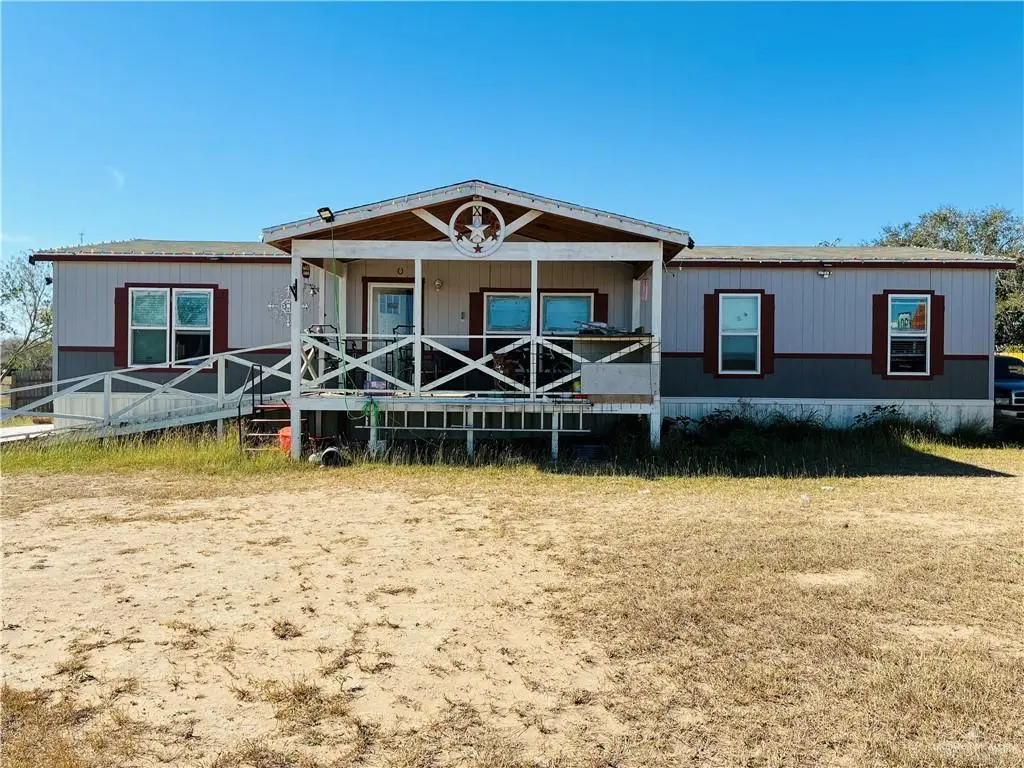
1320 Logan Dr · Weslaco, TX
Flood risk No data
- FEMA flood zone
- —
- Chance of flooding over 30 yrs
- —
- Est. flood insurance / yr
- —
Fire risk No data
- Est. fire insurance / yr
- —
Heat risk No data
- Hot days now (above threshold)
- —
- Hot days in 30 yrs
- —
Wind risk No data
- Chance of severe wind over 30 yrs
- —
Air-quality risk No data
- Unhealthy air days now
- —
- Unhealthy air days in 30 yrs
- —
Risk factors via First Street. Map © Google.
Why this score? — see what drove the C+ grade
The composite is a weighted blend of 9 inputs, each scored 0–100. Each bar is that input's sub-score; the figure is the points it added to the 100-point composite (weight × sub-score).
- Cash flow +30.0/30.0
- DSCR +10.0/10.0
- 1% rule +8.0/10.0
- Appreciation +4.7/10.0
- Livability +3.6/5.0
- Condition / age +2.8/5.0
- Rent growth +2.5/5.0
- Schools +2.2/10.0
- ARV discount +0.0/15.0
$215,000
🖨 Deal sheet 📄 Offer letter ✓ Due diligence
Listing remarks MLS
Welcome to Weslaco. This double-wide mobile home offers 4 spacious bedrooms and 3 full bathrooms, providing plenty of room for comfortable living. The generous layout creates an open, airy feel throughout the home. Master bedroom features a private bathroom complete with a relaxing tub and shower. Step outside and enjoy the covered porch with ramp access, situated on a good-sized lot. The dishwasher, stove, and refrigerator will convey with the sale. 12x26 storage building will also be included. Motivated seller, schedule your showing today.
Key facts
- Covered porch
- Storage building
- Ramp access
Tags
Neighborhood map
What this means for you Summary
Snapshot
- This is a 3-bed/3.0-bath manufactured listed at $215k. Condition is rated average.
Deal economics
- At list price, monthly cash flow is $869 ($10k/yr) — positive.
- The deal already cash-flows at list — no discount required.
- Meets the 1% rule at list price ($3k rent vs $215k).
- Recommended offer: $196k (9.0% below list) — sets the bar for market timing.
- Cap rate 11.1% vs local median 4.1% in Weslaco — top-decile yield for the area; either an underpriced asset or a hidden risk that comps aren't pricing in. Stress-test before assuming the spread holds.
Location & tenants
- Location reads 72/100 on livability (#277 in TX) — a middle-class / working-renter tenant base. Strengths: cost of living A+, housing A+, health & safety A+; Watch: employment D+, crime F, amenities F.
- Weslaco ISD (suburban): math 23% / reading 31% proficiency, ranked #705 of 826 in TX (top 85%) — low school quality limits family demand, transient renter base, plan for 1-2y turnover.
- Market conditions: 708 active listings in the ZIP; 1 comparable units currently listed for rent nearby; 7,378 units permitted in Hidalgo County in 2024 (641 in 5+ unit buildings).
Forward outlook
- In year one you build about $230 of equity ($1k loan paydown + $-1k appreciation (-0.6% local appreciation)).
- Hidalgo County population projected at +28% by 2050 — long-run rental-demand tailwind backs the buy-and-hold thesis.
- At projected returns (-0.6% appreciation + 3.0% rent growth), your $60k cash investment doubles in ~5 years — after that, you're playing with house money.
Negotiation context
- It's been on market 100 days — a 9% lower offer ($196k) is reasonable based on typical stale-listing flexibility.
Questions for the listing agent
- It's been on market 100 days. Have you received any prior offers? Is the seller open to a 9% concession, seller financing, or rate buy-down credit?
- Why hasn't it sold? Are there any deal-killer items the seller is aware of (foundation, flood, title, zoning, code violations)?
- Is there a deadline driving the sale (1031 exchange, divorce, estate, relocation)? That informs how much negotiation room exists.
- Crime grade is F in this area — have there been break-ins, vandalism, or insurance claims at this property in the last 3 years? What carrier currently insures it and at what premium?
- What's the average days-on-market for RENTAL listings here right now (not sales)? A rising rental-DOM trend means longer vacancies and softer asking-rent achievability than the comps imply.
- What's the recent tenant-quality profile in this submarket — average credit score on applications, eviction rate, late-payment / NSF rate, and stable-employment percentage? A property-management company in the area should have these aggregated.
- How much new for-sale + rental construction is in the pipeline within 1–3 miles? Heavy new supply typically softens prices + rents 12–24 months out; constrained supply supports both.
Investment metrics
- 1% rule
- 1.30% ✓
- Cap rate
- 11.14%
- Cash-on-cash
- 17.31%
- DSCR
- 1.77
- GRM
- 6.4
CMA / ARV
- ARV (median comp)
- $157,870
- List price
- $215,000
- Delta
- 36.19%
- Verdict
- OVERPRICED
- Comps
- 2 within 2.0 mi
Projected returns pro-forma
-0.58% appreciation · 3.0% rent growth · sell at horizon
- IRR
- 15.4%
- Equity multiple
- 1.72×
- Total profit
- $43,150
- Equity at exit
- $56,222
- IRR
- 20.7%
- Equity multiple
- 3.17×
- Total profit
- $130,408
- Equity at exit
- $62,808
Cash invested: $60,200 (down + closing). Projections, not guarantees.
Landlord ↔ Tenant lean methodology
- Overall (STATE)
- 87 Strongly Landlord-Friendly
- State Texas
- 87 Strongly Landlord-Friendly · R+5
- County
- — inherits STATE
- City
- — inherits STATE
ZIP-level market 78596
- Home prices YoY
- -0.2%
- Active inventory
- 708
- Price-to-rent
- 6.4×
Monthly cashflow live
- Estimated rent
- $2,800 medium interval (Pro) →
- Mortgage (P&I)
- −$1,127
- Tax from tax record
- −$126 /mo · $1,516/yr
- Insurance
- −$90
- HOA
- −$0
- Vacancy / Maint / Mgmt
- −$588
- Net cashflow
- $869
Break-even live
UW: 25.0% down · 7.5% · 30yr · 1.5% tax · 5.0% vac · 8.0% maint · 8.0% mgmt
Financing live
Cash to close
- Down payment
- $53,750
- Closing costs
- $6,450
- Reserves months
- —
- Total cash needed
- —
Loan-product check · same deal, 3 products live
Conventional
25% down · 7.5% · 30yr
- Down + closing
- —
- Monthly P&I
- —
- Monthly cashflow
- —
- DSCR
- —
- Eligible?
- —
Personal DTI + credit; lowest rate.
DSCR
20% down · 8.5% · 30yr
- Down + closing
- —
- Monthly P&I
- —
- Monthly cashflow
- —
- DSCR
- —
- Eligible?
- —
No personal income docs; deal must DSCR.
Hard money
10% down · 12.0% · 12mo
- Down + closing
- —
- Monthly P&I
- —
- Monthly cashflow
- —
- DSCR
- —
- Eligible?
- —
Short-term bridge; refi at stabilization.
Rent comps 1 comps
| Address | Beds | Baths | Sqft | Rent | $/sqft | DOM | Units | Dist |
|---|---|---|---|---|---|---|---|---|
| 3818 Tierra Escondida Weslaco, TX | 3.0 | 3.5 | 1846 | $2,800 | $1.52 | 44d | 1 | 0.45mi |
Listing history 1 events
-
2026-02-16$215,000 Active 547-char remark
Show marketing remark (547 chars)
Welcome to Weslaco. This double-wide mobile home offers 4 spacious bedrooms and 3 full bathrooms, providing plenty of room for comfortable living. The generous layout creates an open, airy feel throughout the home. Master bedroom features a private bathroom complete with a relaxing tub and shower. Step outside and enjoy the covered porch with ramp access, situated on a good-sized lot. The dishwasher, stove, and refrigerator will convey with the sale. 12x26 storage building will also be included. Motivated seller, schedule your showing today.
ⓘ Source: listings_history table (triggers on properties + properties_extension) + one-shot
backfill from property_details.listing_events for pre-trigger history.
Tax reassessment forecast TX · Resets to sale price
- Current annual tax
- $1,516 · $126/mo
- Projected year-2 tax
- $3,934 · $328/mo
- Expected delta
- +$2,418/yr (+$202/mo · 159.5%)
ⓘ Screening estimate from a state-policy table — verify with the county assessor before closing.
Nearby sold comps map
Loading sold comps map…
Walkable amenities ~0.75 mi
Loading nearby amenities…
Taxation est. · year 1
- Rental income
- $33,600
- − Mortgage interest
- −$12,043
- − Property taxes
- −$1,516
- − Insurance
- −$1,075
- − Repairs & maintenance
- −$2,688
- − Management
- −$2,688
- − Depreciation
- −$6,255
- Taxable income
- $7,335
- Est. tax owed @ 24.0%
- −$1,760
- After-tax cash flow
- $8,662/yr
For passive investors: Depreciation is non-cash, so a rental often shows a tax loss while cash-flowing — sheltering income. Rental losses are passive: they offset passive income freely, and up to $25,000/yr can offset ordinary (W-2) income if you actively participate and your MAGI is under $100k (phasing out to $0 by $150k); unused losses carry forward. On sale, claimed depreciation is recaptured at up to 25%, and gains may owe capital-gains tax (a 1031 exchange can defer both). Figures are a year-1 estimate at your 24.0% rate — not tax advice; consult a CPA.
Condition & rehab AI · 12 photos
This double-wide mobile home requires moderate repairs and maintenance, with a focus on painting and HVAC replacement. The home has a good layout and is move-in ready, but improvements can significantly increase its value.
Repairs flagged
- Minor Kitchen cabinets — Light wear and tear
- Minor Bathroom tiles — Some tiles show signs of wear
- Minor Exterior siding — Some areas show wear
- Minor Flooring — Worn in some areas
- Minor Paint — Chipped in some areas
- Minor Windows — Frames show wear
- Moderate HVAC unit — Appears old and may need replacement
Value-add opportunities
- Both Painting the exterior and interior — Fresh paint can improve curb appeal and interior aesthetics
- Resale Refrigerator and dishwasher — These appliances will convey with the sale and are in good condition
- Both HVAC unit — A new HVAC unit can improve comfort and energy efficiency
- Both Landscaping — A well-maintained yard can improve curb appeal and property value
Renovation cost estimate screening
| Repair item | Severity | Est. cost |
|---|---|---|
| Kitchen cabinets · Light wear and tear | Minor | $500–3,000 |
| Bathroom tiles · Some tiles show signs of wear | Minor | $500–3,000 |
| Exterior siding · Some areas show wear | Minor | $500–3,000 |
| Flooring · Worn in some areas | Minor | $500–3,000 |
| Paint · Chipped in some areas | Minor | $500–3,000 |
| Windows · Frames show wear | Minor | $500–3,000 |
| HVAC unit · Appears old and may need replacement | Moderate | $3,000–15,000 |
| Total estimated repair cost · 7 items | $6,000–33,000 |
Value-add ROI direction
- Both Painting the exterior and interior — Fresh paint can improve curb appeal and interior aesthetics ↑
- Resale Refrigerator and dishwasher — These appliances will convey with the sale and are in good condition ↑
- Both HVAC unit — A new HVAC unit can improve comfort and energy efficiency ↑
- Both Landscaping — A well-maintained yard can improve curb appeal and property value ↑
ⓘ Cost ranges are severity-bucket heuristics (US national rule-of-thumb). Get contractor quotes + a written scope before underwriting a rehab budget.
Schools (NCES district)
- District
- Weslaco ISD
- NCES district ID
- 4844960
- Math proficiency
- 23% ▼ -29.00%
- Reading proficiency
- 31% ▼ -9.00%
- Median HH income
- $32,867
- Composite
- 22.05/100
- National rank
- #8196
- State rank
- #705 of 826 in TX
Livability — Weslaco
- Score
- 72/100
- State rank
- #277
- US rank
- #6469
Category grades
Schools grade is shown separately in the Schools card above.
Census & demographics
- Census place
- Weslaco, TX
- Population (ZIP)
- 38,942
Population outlook (Hidalgo County) Hauer SSP2
- Today (2025)
- 955,232 people
- By 2030
- 1,009,774 · +5.7%
- By 2040
- 1,120,332 · +17.3%
- By 2050
- 1,225,036 · +28.2%
- By 2075
- 1,439,189 · +50.7%
- By 2100
- 1,533,429 · +60.5%
Race, ethnicity, and origin ACS 2023
- Neighborhood character
- Predominantly Hispanic (86%)
- Race & ethnicity
- Hispanic / Latino 86% Two or more races 38% White 13%
- Hispanic origin (detail)
- Mexican 82%
- Common ancestry
- Slovak 1%
- Foreign-born
- 17% · Canada
- Languages at home
- 27% English-only · Spanish 72%
Political lean MEDSL · Hidalgo
- 2024 margin
- Toss-up / Even · D 48.1% · R 51.0%
- 2008→2024 swing
- -41.6pp toward R · 2008: 38.7pp · 2024: -2.9pp
- All cycles
- 2024: R+2.9 2020: D+17.1 2016: D+40.5 2012: D+41.8 2008: D+38.7
Not yet ingested
- Civics
- —
Market trends
- HPI YoY
- ▼ -0.58%
- Current HPI
- 261.5117
- Rent YoY
- —
- Metro
- —
- State GDP YoY
- ▲ 3.95%
- F500 in state
- 110
Industry mix (Fortune 500 HQ in TX)
| Industry | F500 HQs | Revenue |
|---|---|---|
| Energy | 16 | $1,198B |
|
||
| Technology | 5 | $198B |
|
||
| Engineering / Construction | 4 | $72B |
|
||
| Energy Services | 3 | $60B |
|
||
| Utilities | 3 | $41B |
|
||
| Healthcare | 2 | $330B |
|
||
Price history
1 event — show timeline
- 2026-02-16 Listed $215,000 MCALLENMLS
Cash-flow waterfall
monthlySold comps — $/sqft
last 12 mo · ≤1 miLoading sold comps…