 Multi-family
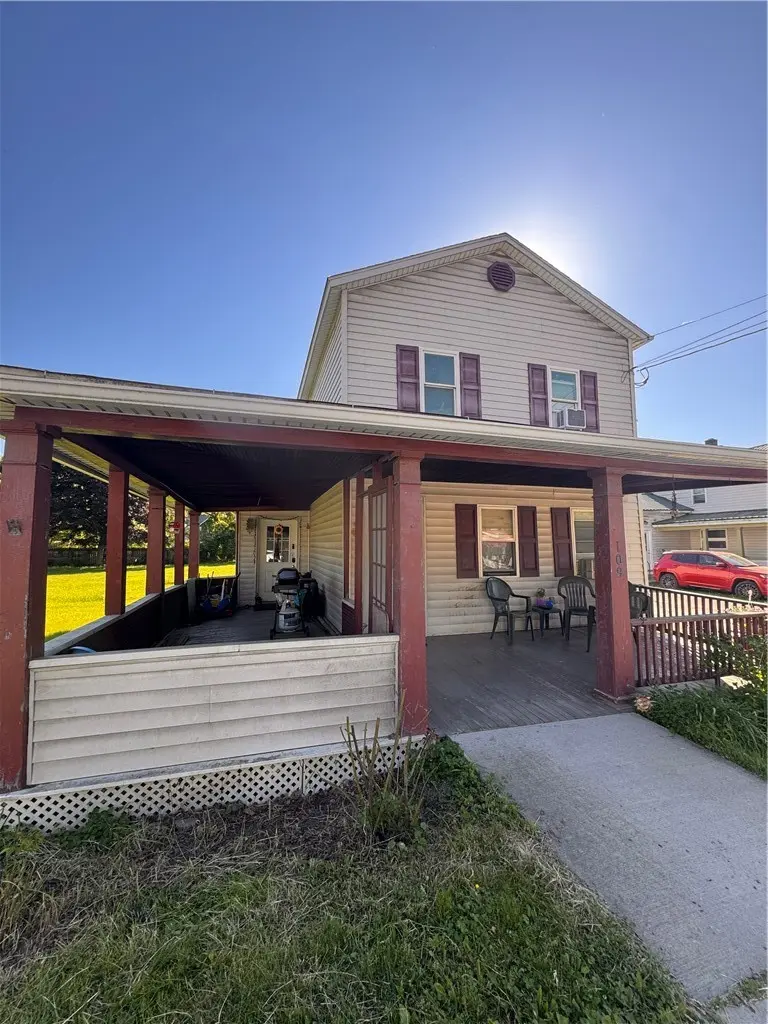
109 S Catherine St · Montour Falls, NY
Flood risk 9/10 · Severe
- FEMA flood zone
- X (shaded)
- Chance of flooding over 30 yrs
- 0.99%
- Est. flood insurance / yr
- $507 – $1,088
Fire risk 3/10 · Minor
- Est. fire insurance / yr
- $691 – $1,283
Heat risk 3/10 · Minor
- Hot days now (above 94°F)
- 8 days/yr
- Hot days in 30 yrs
- 17 days/yr
Wind risk 1/10 · Minimal
- Chance of severe wind over 30 yrs
- 1.0%
Air-quality risk 1/10 · Minimal
- Unhealthy air days now
- 0 days/yr
- Unhealthy air days in 30 yrs
- 0 days/yr
Risk factors via First Street. Map © Google.
Why this score? — see what drove the B- grade
The composite is a weighted blend of 9 inputs, each scored 0–100. Each bar is that input's sub-score; the figure is the points it added to the 100-point composite (weight × sub-score).
- Cash flow +24.4/30.0
- DSCR +7.9/10.0
- 1% rule +7.8/10.0
- ARV discount +7.5/15.0
- Appreciation +7.1/10.0
- Schools +4.3/10.0
- Livability +3.2/5.0
- Rent growth +2.5/5.0
- Condition / age +2.5/5.0
$135,000
🖨 Deal sheet 📄 Offer letter ✓ Due diligence
Multi-family units
County records classify this as Multi-Family (2-4 Unit). Listing-text estimate: 1 unit. estimate disagrees with records
Listing remarks
Great location for an investment property in Montour Falls. This is a wonderful double lot in the Village of Montour falls. Up and down units. The second floor is a 1 bedroom living room, bathroom and kitchen. The 1st floor is a 2 bedroom, kitchen, living room, and bathroom with a covered front porch. There is a small barn/shed on the property as well. Located minutes from Watkins Glen and all its shopping, restaurants and water falls not to mention Seneca Lake. The owner only pays for garbage, taxes and insurance on this rental. Tenants pay for the electric, gas heat, water and septic and maintain the yard. Positive cash flow on this property. Ample parking and a great extra lot on the sid
Key facts
- Covered front porch
- Extra lot
- Ample parking
Tags
Property features AI
Finance
- Financial info: Tenant pays all utilities; Property configured as 2-unit multi-family with separate gas and electric meters (2 each); Unit rents: one unit at $800, one unit at $900; Operating expense details: See remarks
Exterior
- Parking: Two or more parking spaces
- Utilities: Public water connected; Sewer connected; Cable available; High-speed internet available
- Home design: Two-story building; Resale property; Shingle roof; Vinyl siding; Main thoroughfare frontage; Rectangular lot (approx. 0.26 acres, 73x168)
- Construction: Vinyl siding construction; Shingle roof; Built existing (year built details listed as existing)
- Exterior features: Covered porch
Interior
- Kitchen: Each unit includes a dining area with kitchen or dining area with living room (unit-level layouts vary)
- Bedrooms: Two 2-bedroom units (each unit has 2 bedrooms)
- Flooring: Carpet; Hardwood; Luxury vinyl; Varied flooring between units/areas
- Bathrooms: Each unit has one full bathroom (total 2 full bathrooms in property)
- Heating & cooling: Gas forced-air heating
- Interior features: Ceiling fans
- Laundry & utility: Electric water heater
Neighborhood map
What this means for you Summary
Snapshot
- This is a 3-bed/2.0-bath multifamily listed at $135k.
Deal economics
- At list price, monthly cash flow is $207 ($2k/yr) — positive.
- The deal already cash-flows at list — no discount required.
- Meets the 1% rule at list price ($2k rent vs $135k).
Location & tenants
- Location reads 63/100 on livability (#786 in NY) — a middle-class / working-renter tenant base. Strengths: cost of living A+, crime A-, housing B+; Watch: health & safety D, schools F, amenities F.
- Odessa-Montour Central School District (rural): math 41% / reading 60% proficiency, ranked #383 of 590 in NY (top 65%) — acceptable for families but not a draw, mixed tenant base, ~2y average lease.
- Market conditions: 19 active listings in the ZIP; 52 units permitted in Schuyler County in 2024 (0 in 5+ unit buildings).
Forward outlook
- In year one you build about $7k of equity ($933 loan paydown + $6k appreciation (4.2% local appreciation)).
- Schuyler County population projected at -15% by 2050 — secular population decline; favor cash flow + early exit over multi-decade hold.
- At projected returns (4.2% appreciation + 3.0% rent growth), your $38k cash investment doubles in ~4 years — after that, you're playing with house money.
- By year 6, paydown + projected appreciation supports a ~$35k cash-out refi (75% LTV) — recoverable capital for the next deal without selling this one.
Negotiation context
- Only 11 days on market — expect competitive offers; lowballing is unlikely to land.
- 5 sale attempts since 25y ago with the ask held roughly flat each time — persistent listings suggest the price (not the market) is what's stuck; bring a comps-based counter.
- Current owner paid $100k; 35% above their basis — modest negotiation headroom, anchor on the comps not their cost.
Risks & watch-outs
- Watch-outs: property tax is 2.9% of price; flood insurance adds $66/mo; built in 1890 — expect roof / HVAC / electrical / plumbing capex.
- Climate carrying-cost: severe flood risk — expect insurance premiums to compound above CPI over the hold.
Questions for the listing agent
- Built in 1890 — when were the roof, HVAC, electrical panel, plumbing, and water heater last replaced?
- Property tax is high relative to price — has the assessment been appealed recently, and will the sale trigger a re-assessment?
- What's the actual annual flood-insurance premium (NFIP or private), and is the property in a SFHA with mandatory coverage?
- Is there a deadline driving the sale (1031 exchange, divorce, estate, relocation)? That informs how much negotiation room exists.
- Schools are F-rated, which usually means shorter tenancies and higher turnover. Who's the typical renter profile here, and what's been the actual vacancy rate?
- What's the average days-on-market for RENTAL listings here right now (not sales)? A rising rental-DOM trend means longer vacancies and softer asking-rent achievability than the comps imply.
- What's the recent tenant-quality profile in this submarket — average credit score on applications, eviction rate, late-payment / NSF rate, and stable-employment percentage? A property-management company in the area should have these aggregated.
- How much new apartment / multifamily construction is in the pipeline within 1–3 miles? Heavy new supply (>2% of stock underway) typically softens rents 12–24 months out; light construction supports rent growth.
Investment metrics
- 1% rule
- 1.28% ✓
- Cap rate
- 8.72%
- Cash-on-cash
- 8.68%
- DSCR
- 1.39
- GRM
- 6.5
CMA / ARV
No comps found within radius.
Projected returns pro-forma
4.16% appreciation · 3.0% rent growth · sell at horizon
- IRR
- 16.6%
- Equity multiple
- 2.01×
- Total profit
- $38,068
- Equity at exit
- $69,708
- IRR
- 17.4%
- Equity multiple
- 3.84×
- Total profit
- $107,353
- Equity at exit
- $115,031
Cash invested: $37,800 (down + closing). Projections, not guarantees.
Landlord ↔ Tenant lean methodology
- Overall (STATE)
- 15 Strongly Tenant-Friendly
- State New York
- 15 Strongly Tenant-Friendly · D+10
- County
- — inherits STATE
- City
- — inherits STATE
ZIP-level market 14865
- Home prices YoY
- 1.6%
- Active inventory
- 19
- Price-to-rent
- 13.2×
Monthly cashflow live
- Estimated rent
- $1,725 medium interval (Pro) →
- Mortgage (P&I)
- −$708
- Tax from tax record
- −$325 /mo · $3,903/yr
- Insurance
- −$56
- Flood insurance flood zone
- −$66 /mo · $798/yr
- HOA
- −$0
- Vacancy / Maint / Mgmt
- −$362
- Net cashflow
- $207
Break-even live
2-unit breakdown (identical units grouped — click to expand)
| Units | Beds | Baths | Est. rent |
|---|---|---|---|
| 1× unit | 1 | 1 | $850 |
| 1× unit | 2 | 1 | $875 |
| Total (2 units) | $1,725 | ||
UW: 25.0% down · 7.5% · 30yr · 1.5% tax · 5.0% vac · 8.0% maint · 8.0% mgmt
Financing live
Cash to close
- Down payment
- $33,750
- Closing costs
- $4,050
- Reserves months
- —
- Total cash needed
- —
Loan-product check · same deal, 3 products live
Conventional
25% down · 7.5% · 30yr
- Down + closing
- —
- Monthly P&I
- —
- Monthly cashflow
- —
- DSCR
- —
- Eligible?
- —
Personal DTI + credit; lowest rate.
DSCR
20% down · 8.5% · 30yr
- Down + closing
- —
- Monthly P&I
- —
- Monthly cashflow
- —
- DSCR
- —
- Eligible?
- —
No personal income docs; deal must DSCR.
Hard money
10% down · 12.0% · 12mo
- Down + closing
- —
- Monthly P&I
- —
- Monthly cashflow
- —
- DSCR
- —
- Eligible?
- —
Short-term bridge; refi at stabilization.
Listing history 10 events
-
2026-06-19days on market $135,000 Active 11 DOM
-
2026-06-18days on market $135,000 Active 10 DOM
-
2026-06-17days on market $135,000 Active 9 DOM
-
2026-06-16days on market $135,000 Active 8 DOM
-
2026-06-15days on market $135,000 Active 7 DOM
-
2026-06-14days on market $135,000 Active 5 DOM
-
2026-06-13days on market $135,000 Active 4 DOM
-
2026-06-10days on market $135,000 Active 2 DOM
-
2026-06-09remarks 699-char remark
-
2026-06-09$135,000 Active 1 DOM
ⓘ Source: listings_history table (triggers on properties + properties_extension) + one-shot
backfill from property_details.listing_events for pre-trigger history.
Tax reassessment forecast NY · Partial reset (capped growth)
- Current annual tax
- $3,903 · $325/mo
- Projected year-2 tax
- $3,903 · $325/mo
- Expected delta
- $0/yr ($0/mo · 0.0%)
ⓘ Screening estimate from a state-policy table — verify with the county assessor before closing.
Climate risk First Street
- Flood 9/10 Extreme FEMA zone X (shaded) · 99% chance over 30 yrs
- Wildfire 3/10 Moderate
- Heat 3/10 Moderate 8 d/yr ≥94°F today · 17 d/yr by 30 yrs out
- Wind 1/10 Low 100% chance of damaging wind over 30 yrs
- Air quality 1/10 Low 0 unhealthy d/yr today · 0 by 30 yrs out
Nearby sold comps map
Loading sold comps map…
Walkable amenities ~0.75 mi
Loading nearby amenities…
Taxation est. · year 1
- Rental income
- $20,700
- − Mortgage interest
- −$7,562
- − Property taxes
- −$3,903
- − Insurance
- −$1,472
- − Repairs & maintenance
- −$1,656
- − Management
- −$1,656
- − Depreciation
- −$3,927
- Taxable income
- $524
- Est. tax owed @ 24.0%
- −$126
- After-tax cash flow
- $2,357/yr
For passive investors: Depreciation is non-cash, so a rental often shows a tax loss while cash-flowing — sheltering income. Rental losses are passive: they offset passive income freely, and up to $25,000/yr can offset ordinary (W-2) income if you actively participate and your MAGI is under $100k (phasing out to $0 by $150k); unused losses carry forward. On sale, claimed depreciation is recaptured at up to 25%, and gains may owe capital-gains tax (a 1031 exchange can defer both). Figures are a year-1 estimate at your 24.0% rate — not tax advice; consult a CPA.
Schools (NCES district)
- District
- Odessa-Montour Central School District
- NCES district ID
- 3621630
- Math proficiency
- 41% ▼ -8.00%
- Reading proficiency
- 60% ▲ 7.00%
- Median HH income
- $46,720
- Composite
- 42.81/100
- National rank
- #3142
- State rank
- #383 of 590 in NY
Livability — Montour Falls
- Score
- 63/100
- State rank
- #786
- US rank
- #15104
Category grades
Schools grade is shown separately in the Schools card above.
Census & demographics
- Census place
- Montour Falls, NY
- Population (ZIP)
- 2,578
Population outlook (Schuyler County) Hauer SSP2
- Today (2025)
- 17,999 people
- By 2030
- 17,676 · -1.8%
- By 2040
- 16,586 · -7.9%
- By 2050
- 15,322 · -14.9%
- By 2075
- 13,004 · -27.8%
- By 2100
- 10,752 · -40.3%
Race, ethnicity, and origin ACS 2023
- Neighborhood character
- Predominantly White (92%)
- Race & ethnicity
- White 92% Two or more races 6%
- Common ancestry
- Lithuanian 7% Iranian 4% Slovak 3%
- Foreign-born
- 2% · Canada
- Languages at home
- 98% English-only · German/W. Germanic 1%
Political lean MEDSL · Schuyler
- 2024 margin
- Strong R (+21.0) · D 39.5% · R 60.5%
- 2008→2024 swing
- -13.9pp toward R · 2008: -7.1pp · 2024: -21.0pp
- All cycles
- 2024: R+21.0 2020: R+17.6 2016: R+28.7 2012: R+7.9 2008: R+7.1
Not yet ingested
- Civics
- —
Market trends
- HPI YoY
- ▲ 4.16%
- Current HPI
- 263.1314
- Rent YoY
- —
- Metro
- —
- State GDP YoY
- ▲ 2.60%
- F500 in state
- 92
Industry mix (Fortune 500 HQ in NY)
| Industry | F500 HQs | Revenue |
|---|---|---|
| Financial Services | 10 | $950B |
|
||
| Consumer Goods | 9 | $162B |
|
||
| Insurance | 4 | $225B |
|
||
| Telecommunications | 2 | $144B |
|
||
| Pharmaceuticals | 2 | $112B |
|
||
| Media / Entertainment | 2 | $69B |
|
||
Price history
+246.2% since first listed14 events — show timeline
- 2026-06-08 Listed $135,000 UNYREIS
- 2025-01-23 Sold (Public Records) $100,000 Public Records
- 2024-11-11 Listing Removed — UNYREIS
- 2024-08-27 Listed $129,900 UNYREIS
- 2024-07-15 Listing Removed — UNYREIS
- 2024-07-15 Listing Removed — UNYREIS
- 2024-05-01 Price Changed $135,900 UNYREIS
- 2024-02-27 Price Changed $145,900 UNYREIS
- 2024-01-15 Listed $135,900 UNYREIS
- 2024-01-15 Listed $149,900 UNYREIS
- 2017-04-11 Sold (Public Records) $94,000 Public Records
- 2003-11-25 Sold (Public Records) $28,000 Public Records
- 2003-11-25 Sold (MLS) $28,000 UNYREIS
- 2001-02-15 Listed $39,000 UNYREIS
Property tax history
+2.2%/yrLatest (2025): $3,903 · +10.1% YoY. Source: county tax records.
Cash-flow waterfall
monthlySold comps — $/sqft
last 12 mo · ≤1 miLoading sold comps…