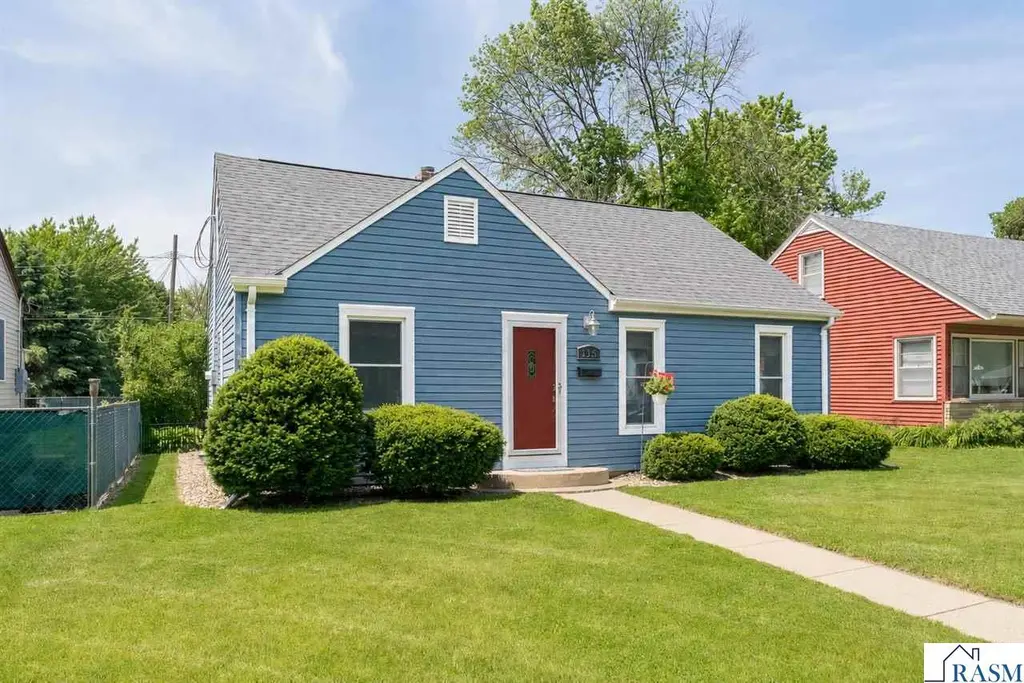
835 Wall St · North Mankato, MN
Flood risk 1/10 · Minimal
- FEMA flood zone
- X
- Chance of flooding over 30 yrs
- 0.0%
- Est. flood insurance / yr
- $473 – $860
Fire risk 1/10 · Minimal
- Est. fire insurance / yr
- $888 – $1,650
Heat risk 2/10 · Minimal
- Hot days now (above 99°F)
- 7 days/yr
- Hot days in 30 yrs
- 15 days/yr
Wind risk 2/10 · Minimal
- Chance of severe wind over 30 yrs
- —
Air-quality risk 2/10 · Minimal
- Unhealthy air days now
- 1 days/yr
- Unhealthy air days in 30 yrs
- 1 days/yr
Risk factors via First Street. Map © Google.
Why this score? — see what drove the D+ grade
The composite is a weighted blend of 9 inputs, each scored 0–100. Each bar is that input's sub-score; the figure is the points it added to the 100-point composite (weight × sub-score).
- Cash flow +20.8/30.0
- DSCR +6.6/10.0
- 1% rule +4.9/10.0
- Schools +4.4/10.0
- Livability +4.0/5.0
- Rent growth +2.5/5.0
- Condition / age +2.5/5.0
- ARV discount +2.0/15.0
- Appreciation +0.0/10.0
$269,900
🖨 Deal sheet 📄 Offer letter ✓ Due diligence
Listing remarks MLS
Move-in ready home in Lower North Mankato has all of the character every new home buyer is looking for, plus numerous updates that they are hoping for. The main floor displays original hardwood floors and includes a large living room, 2 spacious bedrooms, full bath and a beautifully updated kitchen that will make you want to call this house "home". The upper level is perfect for a master bedroom, family room or just about anything else you desire. Plenty of storage and built-ins for just about any style room imaginable. The lower level of the home is completely unfinished and awaits your ideas and finishing touches. All appliances are included in the sale [excluding the upright freezer]. Don't forget the 26x24 garage with alley access, newer roof, vinyl siding, windows, landscaped yard and the much desired Lower North Mankato location, close to numerous parks and schools. This well maintained home awaits it's new owners. .. Make it yours today.
Key facts
- Yard and patio area
- 6,098 sq ft lot
- 2 garage spots
Tags
Property features AI
Exterior
- Parking: 2-car garage with garage door opener
- Utilities: Public water; Public sewer
- Home design: Single family residence; Residential property
- Construction: Vinyl siding; Asphalt roof
- Exterior features: Patio; Public maintained road
Interior
- Kitchen: Dishwasher; Cooktop; Range; Microwave; Refrigerator
- Flooring: Hardwood
- Bathrooms: One full bathroom; One three-quarter bathroom
- Heating & cooling: Natural gas forced-air heating; Central air; Window unit(s)
- Interior features: Eat-in kitchen; Window coverings; Finished, partially finished full basement
- Laundry & utility: Washer; Dryer; Gas water heater; Water softener
Neighborhood map
What this means for you Summary
Snapshot
- This is a 3-bed/2.0-bath single-family listed at $270k.
Deal economics
- At list price, monthly cash flow is $372 ($4k/yr) — positive.
- The deal already cash-flows at list — no discount required.
- To meet the 1% rule (rent ≥ 1% of price), the offer needs to be $268k (0.8% below list).
- Recommended offer: $266k (1.5% below list) — sets the bar for market timing.
- Cap rate 7.9% vs local median 3.3% in North Mankato — top-decile yield for the area; either an underpriced asset or a hidden risk that comps aren't pricing in. Stress-test before assuming the spread holds.
Location & tenants
- Location reads 80/100 on livability (#71 in MN, #1,734 nationally) — a professional / high-income tenant draw. Strengths: schools A+, housing A+, crime A; Watch: amenities F, commute F.
- Mankato Public School District (urban): math 48% / reading 56% proficiency, ranked #98 of 301 in MN (top 33%) — acceptable for families but not a draw, mixed tenant base, ~2y average lease.
- Market conditions: 168 active listings in the ZIP; 4 comparable units currently listed for rent nearby; rentals lingering (median 44d on market — plan ~5-8 weeks vacancy on turnover, expect pricing pressure); 100% of comp listings sitting > 30 days — soft ceiling on asking rent; 109 units permitted in Nicollet County in 2024 (47 in 5+ unit buildings).
Forward outlook
- Local home prices are declining (-3.0%/yr); year-one equity from $2k of loan paydown is wiped out by about $8k of value loss. Plan a longer hold.
Negotiation context
- It's been on market 17 days — a 2% lower offer ($266k) is reasonable based on typical stale-listing flexibility.
- 4 sale attempts since 12y ago; this cycle's ask has dropped $15k (5%) from the opening price — seller is motivated, your offer sets the floor, not the list.
- Current owner paid $142k; list at $270k implies a 91% gain — meaningful room to come down on a strong offer.
Risks & watch-outs
- Watch-outs: built in 1941 — expect roof / HVAC / electrical / plumbing capex.
Questions for the listing agent
- Built in 1941 — when were the roof, HVAC, electrical panel, plumbing, and water heater last replaced?
- Is there a deadline driving the sale (1031 exchange, divorce, estate, relocation)? That informs how much negotiation room exists.
- Schools are A-rated — typically a magnet for longer-tenancy family renters. What's the average tenant stay here, and is there a school-zone premium baked into asking?
- The area grade is low — what's the realistic commute time and amenity access for the typical tenant pool here? Any planned neighborhood developments (good or bad) we should know about?
- What's the average days-on-market for RENTAL listings here right now (not sales)? A rising rental-DOM trend means longer vacancies and softer asking-rent achievability than the comps imply.
- What's the recent tenant-quality profile in this submarket — average credit score on applications, eviction rate, late-payment / NSF rate, and stable-employment percentage? A property-management company in the area should have these aggregated.
- How much new for-sale + rental construction is in the pipeline within 1–3 miles? Heavy new supply typically softens prices + rents 12–24 months out; constrained supply supports both.
Investment metrics
- 1% rule
- 0.99% ✗
- Cap rate
- 7.95%
- Cash-on-cash
- 5.91%
- DSCR
- 1.26
- GRM
- 8.4
CMA / ARV
- ARV (on-the-fly)
- $240,375
- Comps found
- 11
Show comp detail 11 sales within ~0.75 mi
| Address | Dist | Beds/Ba | Sqft | Sold | Price | $/sf | Match |
|---|---|---|---|---|---|---|---|
| 923 Range St | 0.13mi | 2/2.0 (-1) | 1,928 (+0%) | 21mo | $235,000 | $122 | 71 |
| 432 Jefferson Ave | 0.27mi | 3/2.5 | 2,060 (+7%) | 13mo | $304,700 | $148 | 63 |
| 906 Wall St | 0.07mi | 4/2.5 (+1) | 1,772 (-8%) | 22mo | $260,000 | $147 | 59 |
| 544 Monroe Ave | 0.40mi | 4/2.0 (+1) | 1,968 (+2%) | 20mo | $246,500 | $125 | 56 |
| 829 Center St | 0.31mi | 3/2.0 | 2,162 (+12%) | 11mo | $261,000 | $121 | 56 |
| 332 Jefferson Ave | 0.18mi | 4/2.0 (+1) | 1,719 (-11%) | 18mo | $241,500 | $140 | 53 |
| 921 Sherman St St | 0.45mi | 4/2.0 (+1) | 1,911 (-1%) | 24mo | $274,500 | $144 | 53 |
| 549 Mckinley Ave Ave | 0.44mi | 4/2.0 (+1) | 2,107 (+10%) | 20mo | $219,000 | $104 | 42 |
| 726 Garfield Ave | 0.64mi | 4/2.0 (+1) | 2,208 (+15%) | 6mo | $265,000 | $120 | 35 |
| 806 Garfield Ave | 0.73mi | 4/1.5 (+1) | 1,974 (+3%) | 24mo | $185,000 | $94 | 34 |
| 542 Nicollet Ave | 0.67mi | 2/1.0 (-1) | 1,716 (-11%) | 22mo | $265,000 | $154 | 23 |
Match score weights: distance 35% · size 25% · config 20% · recency 20%. Top-matched comps best support the ARV.
Projected returns pro-forma
-3.0% appreciation · 3.0% rent growth · sell at horizon
- IRR
- -7.2%
- Equity multiple
- 0.73×
- Total profit
- $-20,085
- Equity at exit
- $40,243
- IRR
- 2.4%
- Equity multiple
- 1.17×
- Total profit
- $12,866
- Equity at exit
- $23,336
Cash invested: $75,572 (down + closing). Projections, not guarantees.
Landlord ↔ Tenant lean methodology
- Overall (STATE)
- 46 Balanced
- State Minnesota
- 46 Balanced · D+2
- County
- — inherits STATE
- City
- — inherits STATE
ZIP-level market 56003
- Active inventory
- 168
- Price-to-rent
- 8.4×
Monthly cashflow live
- Estimated rent
- $2,676 medium interval (Pro) →
- Mortgage (P&I)
- −$1,415
- Tax from tax record
- −$215 /mo · $2,576/yr
- Insurance
- −$112
- HOA
- −$0
- Vacancy / Maint / Mgmt
- −$562
- Net cashflow
- $372
Break-even live
UW: 25.0% down · 7.5% · 30yr · 1.5% tax · 5.0% vac · 8.0% maint · 8.0% mgmt
Financing live
Cash to close
- Down payment
- $67,475
- Closing costs
- $8,097
- Reserves months
- —
- Total cash needed
- —
Loan-product check · same deal, 3 products live
Conventional
25% down · 7.5% · 30yr
- Down + closing
- —
- Monthly P&I
- —
- Monthly cashflow
- —
- DSCR
- —
- Eligible?
- —
Personal DTI + credit; lowest rate.
DSCR
20% down · 8.5% · 30yr
- Down + closing
- —
- Monthly P&I
- —
- Monthly cashflow
- —
- DSCR
- —
- Eligible?
- —
No personal income docs; deal must DSCR.
Hard money
10% down · 12.0% · 12mo
- Down + closing
- —
- Monthly P&I
- —
- Monthly cashflow
- —
- DSCR
- —
- Eligible?
- —
Short-term bridge; refi at stabilization.
Rent comps 4 comps
| Address | Beds | Baths | Sqft | Rent | $/sqft | DOM | Units | Dist |
|---|---|---|---|---|---|---|---|---|
| 412 Wall St Unit 412 North Mankato, MN | 4.0 | 2.5 | 2600 | $2,300 | $0.88 | 43d | 1 | 0.42mi |
| 201 N Riverfront Dr Apt 501 Mankato, MN | 2.0 | 2.0 | 2045 | $3,725 | $1.82 | 43d | 1 | 0.70mi |
| 101 Glenwood Ave Mankato, MN | 2.0–3.0 | 1.0 | 1075 | $1,330 | $1.24 | 43d | 8 | 1.30mi |
| 1050 Marsh St Unit 326 Van Tol Mankato, MN | 3.0 | 2.0 | 1461 | $2,360 | $1.62 | 43d | 1 | 1.45mi |
Listing history 14 events
-
2026-06-19pricedays on market $269,900 Active 17 DOM
-
2026-06-18days on market $279,900 Active 16 DOM
-
2026-06-17days on market $279,900 Active 15 DOM
-
2026-06-16days on market $279,900 Active 14 DOM
-
2026-06-15days on market $279,900 Active 13 DOM
-
2026-06-14days on market $279,900 Active 11 DOM
-
2026-06-13pricedays on market $279,900 Active 10 DOM
-
2026-06-10days on market $284,900 Active 8 DOM
-
2026-06-09days on market $284,900 Active 7 DOM
-
2026-06-08days on market $284,900 Active 6 DOM
-
2026-06-07days on market $284,900 Active 5 DOM
-
2026-06-05days on market $284,900 Active 2 DOM
-
2026-06-03remarks 693-char remark
-
2026-06-03$284,900 Active 1 DOM
ⓘ Source: listings_history table (triggers on properties + properties_extension) + one-shot
backfill from property_details.listing_events for pre-trigger history.
Tax reassessment forecast MN · Partial reset (capped growth)
- Current annual tax
- $2,576 · $215/mo
- Projected year-2 tax
- $2,799 · $233/mo
- Expected delta
- +$223/yr (+$19/mo · 8.7%)
ⓘ Screening estimate from a state-policy table — verify with the county assessor before closing.
Climate risk First Street
- Flood 1/10 Low FEMA zone X · 0% chance over 30 yrs
- Wildfire 1/10 Low
- Heat 2/10 Low 7 d/yr ≥99°F today · 15 d/yr by 30 yrs out
- Wind 2/10 Low
- Air quality 2/10 Low 1 unhealthy d/yr today · 1 by 30 yrs out
Nearby sold comps map
Loading sold comps map…
Walkable amenities ~0.75 mi
Loading nearby amenities…
Taxation est. · year 1
- Rental income
- $32,117
- − Mortgage interest
- −$15,119
- − Property taxes
- −$2,576
- − Insurance
- −$1,350
- − Repairs & maintenance
- −$2,569
- − Management
- −$2,569
- − Depreciation
- −$7,852
- Taxable income
- $83
- Est. tax owed @ 24.0%
- −$20
- After-tax cash flow
- $4,443/yr
For passive investors: Depreciation is non-cash, so a rental often shows a tax loss while cash-flowing — sheltering income. Rental losses are passive: they offset passive income freely, and up to $25,000/yr can offset ordinary (W-2) income if you actively participate and your MAGI is under $100k (phasing out to $0 by $150k); unused losses carry forward. On sale, claimed depreciation is recaptured at up to 25%, and gains may owe capital-gains tax (a 1031 exchange can defer both). Figures are a year-1 estimate at your 24.0% rate — not tax advice; consult a CPA.
Schools (NCES district)
- District
- Mankato Public School District
- NCES district ID
- 2718780
- Math proficiency
- 48% ▼ -11.00%
- Reading proficiency
- 56% ▼ -8.00%
- Median HH income
- $49,469
- Composite
- 44.36/100
- National rank
- #2819
- State rank
- #98 of 301 in MN
Livability — North Mankato
- Score
- 80/100
- State rank
- #71
- US rank
- #1734
Category grades
Schools grade is shown separately in the Schools card above.
Census & demographics
- Census place
- North Mankato, MN
- Population (ZIP)
- 15,319
Population outlook (Nicollet County) Hauer SSP2
- Today (2025)
- 34,373 people
- By 2030
- 34,666 · +0.9%
- By 2040
- 34,616 · +0.7%
- By 2050
- 34,340 · -0.1%
- By 2075
- 33,171 · -3.5%
- By 2100
- 31,949 · -7.1%
Race, ethnicity, and origin ACS 2023
- Neighborhood character
- Predominantly White (87%)
- Race & ethnicity
- White 87% Two or more races 7% Hispanic / Latino 5% Black 2% Asian 2%
- Common ancestry
- Portuguese 14% Italian 4% Scottish 2%
- Foreign-born
- 3% · Canada, China
- Languages at home
- 96% English-only · Spanish 1% Other Indo-European 1%
Political lean MEDSL · Nicollet
- 2024 margin
- Toss-up / Even · D 48.8% · R 49.3% · Other 1.9%
- 2008→2024 swing
- -11.0pp toward R · 2008: 10.5pp · 2024: -0.5pp
- All cycles
- 2024: R+0.5 2020: D+3.2 2016: R+3.1 2012: D+7.9 2008: D+10.5
Not yet ingested
- Civics
- —
Market trends
- HPI YoY
- ▼ -138.37%
- Current HPI
- 165.5673
- Rent YoY
- —
- Metro
- —
- State GDP YoY
- ▲ 2.41%
- F500 in state
- 34
Industry mix (Fortune 500 HQ in MN)
| Industry | F500 HQs | Revenue |
|---|---|---|
| Healthcare | 2 | $407B |
|
||
| Retail | 2 | $150B |
|
||
| Consumer Goods | 2 | $32B |
|
||
| Industrial Machinery | 2 | $6B |
|
||
| Agriculture | 1 | $40B |
|
||
| Healthcare / Medical Devices | 1 | $32B |
|
||
Price history
+119.3% since first listed9 events — show timeline
- 2026-06-02 Listed $284,900 RASM
- 2014-08-27 Sold (MLS) $141,500 LSAR
- 2014-08-27 Sold (MLS) $141,500 RASM
- 2014-08-27 Sold (MLS) $141,500 NORTHSTARMLS as Distributed by MLS Grid
- 2014-08-05 Pending — NORTHSTARMLS as Distributed by MLS Grid
- 2014-07-21 Listed $142,700 NORTHSTARMLS as Distributed by MLS Grid
- 2014-07-21 Listed $142,700 LSAR
- 2014-07-21 Listed $142,700 RASM
- 2005-04-06 Sold (Public Records) $129,900 Public Records
Property tax history
+6.6%/yrLatest (2025): $2,576 · +5.8% YoY. Source: county tax records.
Cash-flow waterfall
monthlySold comps — $/sqft
last 12 mo · ≤1 miLoading sold comps…