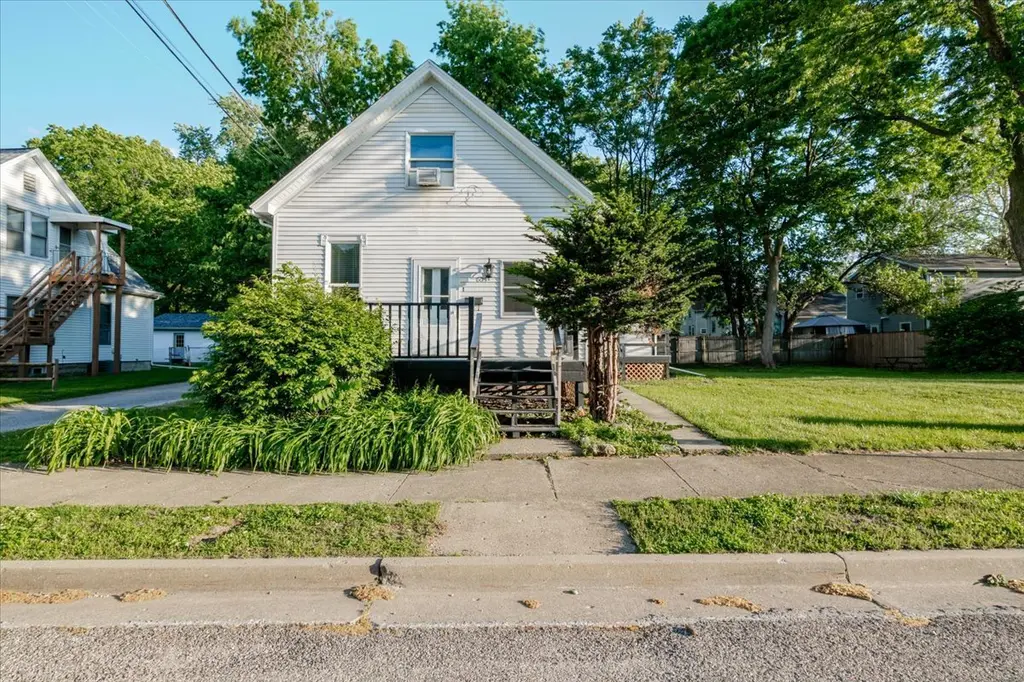
605 E Empire St · Bloomington, IL
Flood risk 1/10 · Minimal
- FEMA flood zone
- X (unshaded)
- Chance of flooding over 30 yrs
- 0.0%
- Est. flood insurance / yr
- $473 – $860
Fire risk 1/10 · Minimal
- Est. fire insurance / yr
- $804 – $1,492
Heat risk 3/10 · Minor
- Hot days now (above 105°F)
- 7 days/yr
- Hot days in 30 yrs
- 18 days/yr
Wind risk 2/10 · Minimal
- Chance of severe wind over 30 yrs
- 1.0%
Air-quality risk 2/10 · Minimal
- Unhealthy air days now
- 1 days/yr
- Unhealthy air days in 30 yrs
- 2 days/yr
Risk factors via First Street. Map © Google.
Why this score? — see what drove the B- grade
The composite is a weighted blend of 9 inputs, each scored 0–100. Each bar is that input's sub-score; the figure is the points it added to the 100-point composite (weight × sub-score).
- Cash flow +28.0/30.0
- DSCR +9.9/10.0
- 1% rule +7.9/10.0
- ARV discount +7.5/15.0
- Rent growth +3.9/5.0
- Livability +3.9/5.0
- Condition / age +2.5/5.0
- Schools +1.5/10.0
- Appreciation +0.0/10.0
$149,900
🖨 Deal sheet 📄 Offer letter ✓ Due diligence
Listing remarks MLS
There are no remarks available.
Key facts
- 5,248 sq ft lot
- 2 parking spots
- Built 1925
Property features AI
Finance
- Other: Zoned MULTI; Lot dimensions approximately 82 x 64 (less than 0.25 acre); Contains two units
- Financial info: No special service area
Exterior
- Parking: Two parking spaces; Driveway
- Utilities: Public water; Public sewer
- Home design: Two- to four-unit building; Fee simple ownership; More than 100 years old; Not a conversion; Not rebuilt or rehabbed
- Construction: Vinyl siding; Asphalt roof; Brick/mortar foundation
- Exterior features: Deck; Porch; School bus service
Interior
- Kitchen: Stove; Refrigerator
- Bedrooms: Three bedrooms
- Bathrooms: Two full bathrooms
- Heating & cooling: Natural gas forced air heating
- Interior features: Six total rooms; Unfinished full basement
- Laundry & utility: Washer; Dryer
Neighborhood map
What this means for you Summary
Snapshot
- This is a 6-bed/4.0-bath other listed at $150k.
Deal economics
- At list price, monthly cash flow is $468 ($6k/yr) — positive.
- The deal already cash-flows at list — no discount required.
- Meets the 1% rule at list price ($2k rent vs $150k).
- Recommended offer: $145k (3.0% below list) — sets the bar for market timing.
- Cap rate 10.0% vs local median 5.4% in Bloomington — top-decile yield for the area; either an underpriced asset or a hidden risk that comps aren't pricing in. Stress-test before assuming the spread holds.
Location & tenants
- Location reads 77/100 on livability (#161 in IL, #2,987 nationally) — a middle-class / working-renter tenant base. Strengths: cost of living A+, housing A+, health & safety A+; Watch: amenities C-, commute F.
- Bloomington SD 87 (urban): math 14% / reading 19% proficiency, ranked #476 of 620 in IL (top 77%) — low school quality limits family demand, transient renter base, plan for 1-2y turnover.
- Zoned schools: Bent Elem School (math 8% / reading 8%, grade F, #1,627 of 2,056 statewide, top 81%, 374 students, 0% FRL); Bloomington Jr High School (math 12% / reading 19%, grade F, #493 of 665 statewide, top 75%, 1,006 students, 0% FRL); Bloomington High School (math 27% / reading 33%, grade F, #179 of 693 statewide, top 27%, 1,503 students, 0% FRL) — zoned schools average 0% FRL vs 51% district-wide (51 pts lower); this property's tenant base skews higher-income than the district average.
- Market conditions: Rents rising fast (+5.6%/yr); 88 active listings in the ZIP; 247 units permitted in McLean County in 2024 (54 in 5+ unit buildings).
- This rent runs 41% of the median local income ($57k/yr) — at the standard rent-burdened threshold; future hikes will face affordability resistance.
Forward outlook
- Local home prices are declining (-3.0%/yr); year-one equity from $1k of loan paydown is wiped out by about $4k of value loss. Plan a longer hold.
- At projected returns (-3.0% appreciation + 5.6% rent growth), your $42k cash investment doubles in ~8 years — after that, you're playing with house money.
Negotiation context
- It's been on market 33 days — a 3% lower offer ($145k) is reasonable based on typical stale-listing flexibility.
- 3 sale attempts since 5y ago with the ask held roughly flat each time — persistent listings suggest the price (not the market) is what's stuck; bring a comps-based counter.
- Current owner paid $130k; 15% above their basis — modest negotiation headroom, anchor on the comps not their cost.
Risks & watch-outs
- Watch-outs: built in 1925 — expect roof / HVAC / electrical / plumbing capex.
Questions for the listing agent
- It's been on market 33 days. Have you received any prior offers? Is the seller open to a 3% concession, seller financing, or rate buy-down credit?
- Built in 1925 — when were the roof, HVAC, electrical panel, plumbing, and water heater last replaced?
- Is there a deadline driving the sale (1031 exchange, divorce, estate, relocation)? That informs how much negotiation room exists.
- What's the average days-on-market for RENTAL listings here right now (not sales)? A rising rental-DOM trend means longer vacancies and softer asking-rent achievability than the comps imply.
- What's the recent tenant-quality profile in this submarket — average credit score on applications, eviction rate, late-payment / NSF rate, and stable-employment percentage? A property-management company in the area should have these aggregated.
- How much new for-sale + rental construction is in the pipeline within 1–3 miles? Heavy new supply typically softens prices + rents 12–24 months out; constrained supply supports both.
Investment metrics
- 1% rule
- 1.29% ✓
- Cap rate
- 10.04%
- Cash-on-cash
- 13.37%
- DSCR
- 1.59
- GRM
- 6.5
CMA / ARV
No comps found within radius.
Projected returns pro-forma
-3.0% appreciation · 5.6% rent growth · sell at horizon
- IRR
- 6.4%
- Equity multiple
- 1.26×
- Total profit
- $10,731
- Equity at exit
- $22,351
- IRR
- 18.0%
- Equity multiple
- 2.68×
- Total profit
- $70,349
- Equity at exit
- $12,961
Cash invested: $41,972 (down + closing). Projections, not guarantees.
Landlord ↔ Tenant lean methodology
- Overall (STATE)
- 43 Moderately Tenant-Leaning
- State Illinois
- 43 Moderately Tenant-Leaning · D+7
- County
- — inherits STATE
- City
- — inherits STATE
ZIP-level market 61701
- Rents YoY
- 5.6%
- Active inventory
- 88
- Price-to-rent
- 6.5×
Monthly cashflow live
- Estimated rent
- $1,934 medium interval (Pro) →
- Mortgage (P&I)
- −$786
- Tax from tax record
- −$212 /mo · $2,543/yr
- Insurance
- −$62
- HOA
- −$0
- Vacancy / Maint / Mgmt
- −$406
- Net cashflow
- $468
Break-even live
UW: 25.0% down · 7.5% · 30yr · 1.5% tax · 5.0% vac · 8.0% maint · 8.0% mgmt
Financing live
Cash to close
- Down payment
- $37,475
- Closing costs
- $4,497
- Reserves months
- —
- Total cash needed
- —
Loan-product check · same deal, 3 products live
Conventional
25% down · 7.5% · 30yr
- Down + closing
- —
- Monthly P&I
- —
- Monthly cashflow
- —
- DSCR
- —
- Eligible?
- —
Personal DTI + credit; lowest rate.
DSCR
20% down · 8.5% · 30yr
- Down + closing
- —
- Monthly P&I
- —
- Monthly cashflow
- —
- DSCR
- —
- Eligible?
- —
No personal income docs; deal must DSCR.
Hard money
10% down · 12.0% · 12mo
- Down + closing
- —
- Monthly P&I
- —
- Monthly cashflow
- —
- DSCR
- —
- Eligible?
- —
Short-term bridge; refi at stabilization.
Listing history 31 events
-
2026-06-19days on market $149,900 Active 33 DOM
-
2026-06-18days on market $149,900 Active 32 DOM
-
2026-06-17days on market $149,900 Active 31 DOM
-
2026-06-16days on market $149,900 Active 30 DOM
-
2026-06-15days on market $149,900 Active 29 DOM
-
2026-06-14days on market $149,900 Active 27 DOM
-
2026-06-13days on market $149,900 Active 26 DOM
-
2026-06-10days on market $149,900 Active 24 DOM
-
2026-06-09remarks 551-char remark
-
2026-06-09days on market $149,900 Active 23 DOM
-
2026-06-08days on market $149,900 Active 22 DOM
-
2026-06-07days on market $149,900 Active 21 DOM
-
2026-06-03pricedays on market $149,900 Active 17 DOM
-
2026-06-02days on market $155,000 Active 16 DOM
-
2026-06-01days on market $155,000 Active 15 DOM
-
2026-05-31days on market $155,000 Active 14 DOM
-
2026-05-30days on market $155,000 Active 13 DOM
-
2026-05-17$155,000 Active
-
2025-04-16soldstatus $130,000
-
2025-04-04soldstatus $130,000 Closed 31-char remark
Show marketing remark (31 chars)
There are no remarks available.
-
2025-02-17historical Contingent - No Showings 31-char remark
Show marketing remark (31 chars)
There are no remarks available.
-
2024-11-11$145,000 Active 31-char remark
Show marketing remark (31 chars)
There are no remarks available.
-
2022-02-16soldstatus $82,500
-
2022-02-11soldstatus $82,500 Closed 374-char remark
Show marketing remark (374 chars)
Nice duplex in good condition. Both units have been updated throughout the years. Both units just signed leases through Jan 2023. Couple of blocks off of IWU campus. Great size lot for a possible building expansion in the future. Off street parking as well as on street parking available. Roof installed in 2010. This property has had positive cash flow for last 5 years.
-
2022-01-24status Active Under Contract (Do Not Show) 374-char remark
Show marketing remark (374 chars)
Nice duplex in good condition. Both units have been updated throughout the years. Both units just signed leases through Jan 2023. Couple of blocks off of IWU campus. Great size lot for a possible building expansion in the future. Off street parking as well as on street parking available. Roof installed in 2010. This property has had positive cash flow for last 5 years.
-
2022-01-20price $85,000 374-char remark
Show marketing remark (374 chars)
Nice duplex in good condition. Both units have been updated throughout the years. Both units just signed leases through Jan 2023. Couple of blocks off of IWU campus. Great size lot for a possible building expansion in the future. Off street parking as well as on street parking available. Roof installed in 2010. This property has had positive cash flow for last 5 years.
-
2021-10-05$89,900 Active 374-char remark
Show marketing remark (374 chars)
Nice duplex in good condition. Both units have been updated throughout the years. Both units just signed leases through Jan 2023. Couple of blocks off of IWU campus. Great size lot for a possible building expansion in the future. Off street parking as well as on street parking available. Roof installed in 2010. This property has had positive cash flow for last 5 years.
-
2014-01-14soldstatus $76,500
-
2008-02-21soldstatus $66,000
-
1995-08-01soldstatus $59,500
-
1994-03-01soldstatus $46,000
ⓘ Source: listings_history table (triggers on properties + properties_extension) + one-shot
backfill from property_details.listing_events for pre-trigger history.
Tax reassessment forecast IL · Partial reset (capped growth)
- Current annual tax
- $2,543 · $212/mo
- Projected year-2 tax
- $2,973 · $248/mo
- Expected delta
- +$430/yr (+$36/mo · 16.9%)
ⓘ Screening estimate from a state-policy table — verify with the county assessor before closing.
Climate risk First Street
- Flood 1/10 Low FEMA zone X (unshaded) · 0% chance over 30 yrs
- Wildfire 1/10 Low
- Heat 3/10 Moderate 7 d/yr ≥105°F today · 18 d/yr by 30 yrs out
- Wind 2/10 Low 100% chance of damaging wind over 30 yrs
- Air quality 2/10 Low 1 unhealthy d/yr today · 2 by 30 yrs out
Nearby sold comps map
Loading sold comps map…
Walkable amenities ~0.75 mi
Loading nearby amenities…
Taxation est. · year 1
- Rental income
- $23,212
- − Mortgage interest
- −$8,397
- − Property taxes
- −$2,543
- − Insurance
- −$750
- − Repairs & maintenance
- −$1,857
- − Management
- −$1,857
- − Depreciation
- −$4,361
- Taxable income
- $3,448
- Est. tax owed @ 24.0%
- −$828
- After-tax cash flow
- $4,784/yr
For passive investors: Depreciation is non-cash, so a rental often shows a tax loss while cash-flowing — sheltering income. Rental losses are passive: they offset passive income freely, and up to $25,000/yr can offset ordinary (W-2) income if you actively participate and your MAGI is under $100k (phasing out to $0 by $150k); unused losses carry forward. On sale, claimed depreciation is recaptured at up to 25%, and gains may owe capital-gains tax (a 1031 exchange can defer both). Figures are a year-1 estimate at your 24.0% rate — not tax advice; consult a CPA.
Schools (NCES district)
- District
- Bloomington SD 87
- NCES district ID
- 1706480
- Math proficiency
- 14% ▼ -7.00%
- Reading proficiency
- 19% ▼ -7.00%
- Median HH income
- $50,544
- Composite
- 15.05/100
- National rank
- #9351
- State rank
- #476 of 620 in IL
Livability — Bloomington
- Score
- 77/100
- State rank
- #161
- US rank
- #2987
Category grades
Schools grade is shown separately in the Schools card above.
Census & demographics
- Census place
- Bloomington, IL
- County
- McLean County · 126,490 people
- City population
- 72,415
- Metro
- Bloomington, IL
- Population (ZIP)
- 35,136
- Household income
- $57,130
- Rent vs Own
- Severe rent burden
- 1493.0
Population outlook (McLean County) Hauer SSP2
- Today (2025)
- 176,468 people
- By 2030
- 178,002 · +0.9%
- By 2040
- 178,592 · +1.2%
- By 2050
- 177,090 · +0.4%
- By 2075
- 173,224 · -1.8%
- By 2100
- 158,425 · -10.2%
Race, ethnicity, and origin ACS 2023
- Neighborhood character
- Predominantly White (70%)
- Race & ethnicity
- White 70% Black 13% Two or more races 9% Hispanic / Latino 9% Asian 3%
- Hispanic origin (detail)
- Mexican 7%
- Common ancestry
- Romanian 3% Slovak 2% Italian 1%
- Foreign-born
- 6% · Canada, Philippines, Vietnam
- Languages at home
- 91% English-only · Spanish 5% Other Asian/Pacific 1% Other Indo-European 1%
Political lean MEDSL · McLean
- 2024 margin
- Toss-up / Even · D 51.6% · R 46.8% · Other 1.6%
- 2008→2024 swing
- +3.7pp toward D · 2008: 1.2pp · 2024: 4.9pp
- All cycles
- 2024: D+4.9 2020: D+3.9 2016: R+1.5 2012: R+11.1 2008: D+1.2
Not yet ingested
- Civics
- —
Market trends
- HPI YoY
- ▼ -115.13%
- Current HPI
- 172.3659
- Rent YoY
- ▲ 5.60%
- Metro
- Bloomington, IL
- State GDP YoY
- ▲ 1.59%
- F500 in state
- 60
Industry mix (Fortune 500 HQ in IL)
| Industry | F500 HQs | Revenue |
|---|---|---|
| Insurance | 4 | $201B |
|
||
| Consumer Goods | 4 | $87B |
|
||
| Industrial Machinery | 3 | $64B |
|
||
| Healthcare | 2 | $55B |
|
||
| Retail / Pharmacy | 1 | $148B |
|
||
| Agriculture / Food | 1 | $86B |
|
||
Price history
+237.0% since first listed14 events — show timeline
- 2026-05-17 Listed $155,000 MRED as Distributed by MLS Grid
- 2025-04-16 Sold (Public Records) $130,000 Public Records
- 2025-04-04 Sold (MLS) $130,000 MRED as Distributed by MLS Grid
- 2025-02-17 Contingent — MRED as Distributed by MLS Grid
- 2024-11-11 Listed $145,000 MRED as Distributed by MLS Grid
- 2022-02-16 Sold (Public Records) $82,500 Public Records
- 2022-02-11 Sold (MLS) $82,500 MRED as Distributed by MLS Grid
- 2022-01-24 Pending — MRED as Distributed by MLS Grid
- 2022-01-20 Price Changed $85,000 MRED as Distributed by MLS Grid
- 2021-10-05 Listed $89,900 MRED as Distributed by MLS Grid
- 2014-01-14 Sold (Public Records) $76,500 Public Records
- 2008-02-21 Sold (Public Records) $66,000 Public Records
- 1995-08-01 Sold (Public Records) $59,500 Public Records
- 1994-03-01 Sold (Public Records) $46,000 Public Records
Property tax history
+2.5%/yrLatest (2023): $2,543 · +10.0% YoY. Source: county tax records.
Cash-flow waterfall
monthlySold comps — $/sqft
last 12 mo · ≤1 miLoading sold comps…