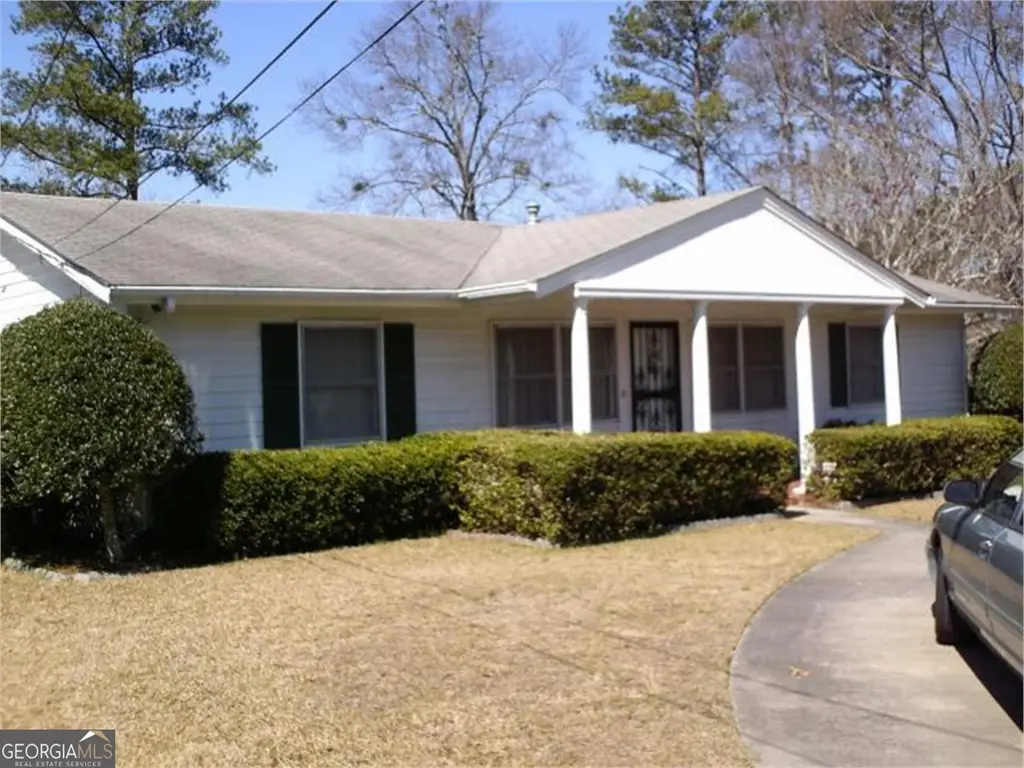
504 Webster Dr · Manchester, GA
Flood risk 1/10 · Minimal
- FEMA flood zone
- X (unshaded)
- Chance of flooding over 30 yrs
- 0.0%
- Est. flood insurance / yr
- $507 – $1,088
Fire risk 2/10 · Minimal
- Est. fire insurance / yr
- $963 – $1,789
Heat risk 6/10 · Moderate
- Hot days now (above 106°F)
- 7 days/yr
- Hot days in 30 yrs
- 20 days/yr
Wind risk 6/10 · Moderate
- Chance of severe wind over 30 yrs
- 62.0%
Air-quality risk 2/10 · Minimal
- Unhealthy air days now
- 2 days/yr
- Unhealthy air days in 30 yrs
- 2 days/yr
Risk factors via First Street. Map © Google.
Why this score? — see what drove the C+ grade
The composite is a weighted blend of 9 inputs, each scored 0–100. Each bar is that input's sub-score; the figure is the points it added to the 100-point composite (weight × sub-score).
- Cash flow +22.3/30.0
- ARV discount +10.0/15.0
- Appreciation +10.0/10.0
- DSCR +7.1/10.0
- 1% rule +4.6/10.0
- Livability +2.8/5.0
- Rent growth +2.5/5.0
- Condition / age +2.5/5.0
- Schools +1.7/10.0
$151,500
🖨 Deal sheet (PDF) 📄 Offer letter ✓ Due diligence
Listing remarks MLS
This home has charm written all over it. Built in 1959, this home is located in a well established neighborhood. The front porch has a pretty tile floor and is large enough for rocking chairs. There is a split bedroom plan with all 4 bedrooms being a nice size. There is a sweet back screened porch that over looks the back yard. This home is just waiting for the right family.
Key facts
- Tile floor
- Back screened porch
- Back yard
Tags
Neighborhood map
What this means for you Summary
Snapshot
- This is a 3-bed/2.0-bath single-family listed at $152k.
Deal economics
- At list price, monthly cash flow is $250 ($3k/yr) — positive.
- The deal already cash-flows at list — no discount required.
- To meet the 1% rule (rent ≥ 1% of price), the offer needs to be $145k (4.3% below list).
- Recommended offer: $138k (9.0% below list) — sets the bar for market timing.
- Cap rate 8.3% vs local median 5.1% in Manchester — top-decile yield for the area; either an underpriced asset or a hidden risk that comps aren't pricing in. Stress-test before assuming the spread holds.
Location & tenants
- Location reads 55/100 on livability (#525 in GA) — a working-class tenant base; expect higher turnover. Strengths: cost of living A+, housing A+; Watch: schools F, crime D-, amenities F.
- Meriwether County (rural): math 18% / reading 22% proficiency, ranked #144 of 174 in GA (top 83%) — low school quality limits family demand, transient renter base, plan for 1-2y turnover; 71% free/reduced lunch — lower-income household profile, screen leases tightly.
- Market conditions: 45 active listings in the ZIP; 1 comparable units currently listed for rent nearby; 180 units permitted in Meriwether County in 2024 (0 in 5+ unit buildings).
Forward outlook
- In year one you build about $16k of equity ($1k loan paydown + $15k appreciation (10.0% local appreciation)).
- Meriwether County population projected at -28% by 2050 — secular population decline; favor cash flow + early exit over multi-decade hold.
- At projected returns (10.0% appreciation + 3.0% rent growth), your $42k cash investment doubles in ~3 years — after that, you're playing with house money.
- By year 3, paydown + projected appreciation supports a ~$41k cash-out refi (75% LTV) — recoverable capital for the next deal without selling this one.
Negotiation context
- It's been on market 113 days — a 9% lower offer ($138k) is reasonable based on typical stale-listing flexibility.
- 6 sale attempts since 13y ago with the ask held roughly flat each time — persistent listings suggest the price (not the market) is what's stuck; bring a comps-based counter.
- Current owner paid $56k; list at $152k implies a 171% gain — meaningful room to come down on a strong offer.
Risks & watch-outs
- Watch-outs: built in 1959 — expect roof / HVAC / electrical / plumbing capex.
- Climate carrying-cost: major wind risk, 62% chance of damaging wind over 30y; extreme-heat days projected 7→20/yr by 2055 (HVAC capex compounding) — expect insurance premiums to compound above CPI over the hold.
Questions for the listing agent
- It's been on market 113 days. Have you received any prior offers? Is the seller open to a 9% concession, seller financing, or rate buy-down credit?
- Built in 1959 — when were the roof, HVAC, electrical panel, plumbing, and water heater last replaced?
- Why hasn't it sold? Are there any deal-killer items the seller is aware of (foundation, flood, title, zoning, code violations)?
- Is there a deadline driving the sale (1031 exchange, divorce, estate, relocation)? That informs how much negotiation room exists.
- Schools are F-rated, which usually means shorter tenancies and higher turnover. Who's the typical renter profile here, and what's been the actual vacancy rate?
- Crime grade is D in this area — have there been break-ins, vandalism, or insurance claims at this property in the last 3 years? What carrier currently insures it and at what premium?
- What's the average days-on-market for RENTAL listings here right now (not sales)? A rising rental-DOM trend means longer vacancies and softer asking-rent achievability than the comps imply.
- What's the recent tenant-quality profile in this submarket — average credit score on applications, eviction rate, late-payment / NSF rate, and stable-employment percentage? A property-management company in the area should have these aggregated.
- How much new for-sale + rental construction is in the pipeline within 1–3 miles? Heavy new supply typically softens prices + rents 12–24 months out; constrained supply supports both.
Investment metrics
- 1% rule
- 0.96% ✗
- Cap rate
- 8.27%
- Cash-on-cash
- 7.07%
- DSCR
- 1.31
- GRM
- 8.7
CMA / ARV
- ARV (median comp)
- $160,327
- List price
- $151,500
- Delta
- -5.51%
- Verdict
- FAIR
- Comps
- 20 within 1.0 mi
Show comp detail 12 sales within ~0.75 mi
| Address | Dist | Beds/Ba | Sqft | Sold | Price | $/sf | Match |
|---|---|---|---|---|---|---|---|
| 819 Nebula Rd | 0.30mi | 3/1.0 | 1,316 (+1%) | 9mo | $150,000 | $114 | 72 |
| 614 Peach St | 0.35mi | 2/2.0 (-1) | 1,312 (+1%) | 9mo | $111,500 | $85 | 70 |
| 904 Linda Ln | 0.46mi | 3/2.0 | 1,325 (+2%) | 7mo | $177,000 | $134 | 69 |
| 607 Farris Blvd | 0.21mi | 2/2.0 (-1) | 1,260 (-3%) | 14mo | $140,000 | $111 | 69 |
| 602 Parkman Dr | 0.32mi | 3/1.5 | 1,352 (+4%) | 9mo | $140,000 | $104 | 68 |
| 603 Parkman Dr | 0.32mi | 3/1.5 | 1,352 (+4%) | 9mo | $140,000 | $104 | 68 |
| 506 Webster Dr | 0.02mi | 3/1.5 | 1,107 (-15%) | 10mo | $160,500 | $145 | 64 |
| 104 4th St | 0.64mi | 3/2.0 | 1,344 (+4%) | 10mo | $138,000 | $103 | 56 |
| 504 W Main St | 0.43mi | 2/1.0 (-1) | 1,238 (-5%) | 12mo | $117,500 | $95 | 54 |
| 922 Linda Ln | 0.61mi | 3/2.0 | 1,148 (-12%) | 3mo | $84,500 | $74 | 50 |
| 415 Broad St | 0.64mi | 3/1.5 | 1,438 (+11%) | 15mo | $130,000 | $90 | 38 |
| 933 Linda Ln | 0.71mi | 3/2.0 | 1,492 (+15%) | 17mo | $199,900 | $134 | 28 |
Match score weights: distance 35% · size 25% · config 20% · recency 20%. Top-matched comps best support the ARV.
Projected returns pro-forma
10.0% appreciation · 3.0% rent growth · sell at horizon
- IRR
- 29.4%
- Equity multiple
- 3.32×
- Total profit
- $98,364
- Equity at exit
- $136,483
- IRR
- 25.5%
- Equity multiple
- 7.53×
- Total profit
- $277,001
- Equity at exit
- $294,331
Cash invested: $42,420 (down + closing). Projections, not guarantees.
Landlord ↔ Tenant lean methodology
- Overall (STATE)
- 90 Strongly Landlord-Friendly
- State Georgia
- 90 Strongly Landlord-Friendly · R+3
- County
- — inherits STATE
- City
- — inherits STATE
ZIP-level market 31816
- Home prices YoY
- 8.7%
- Active inventory
- 45
- Price-to-rent
- 8.7×
Monthly cashflow live
- Estimated rent
- $1,450 medium interval (Pro) →
- Mortgage (P&I)
- −$794
- Tax from tax record
- −$38 /mo · $454/yr
- Insurance
- −$63
- HOA
- −$0
- Vacancy / Maint / Mgmt
- −$304
- Net cashflow
- $250
Break-even live
Sensitivity live
| Price | -10% $336 | -5% $293 | +0% $250 | +5% $207 | +10% $164 |
|---|---|---|---|---|---|
| Rent | -10% $135 | -5% $193 | +0% $250 | +5% $307 | +10% $365 |
| Rate | -1.0pp $326 | -0.5pp $289 | base $250 | +0.5pp $211 | +1.0pp $171 |
UW: 25.0% down · 7.5% · 30yr · 1.5% tax · 5.0% vac · 8.0% maint · 8.0% mgmt
Financing live
Cash to close
- Down payment
- $37,875
- Closing costs
- $4,545
- Reserves months
- —
- Total cash needed
- —
Loan-product check · same deal, 3 products live
Conventional
25% down · 7.5% · 30yr
- Down + closing
- —
- Monthly P&I
- —
- Monthly cashflow
- —
- DSCR
- —
- Eligible?
- —
Personal DTI + credit; lowest rate.
DSCR
20% down · 8.5% · 30yr
- Down + closing
- —
- Monthly P&I
- —
- Monthly cashflow
- —
- DSCR
- —
- Eligible?
- —
No personal income docs; deal must DSCR.
Hard money
10% down · 12.0% · 12mo
- Down + closing
- —
- Monthly P&I
- —
- Monthly cashflow
- —
- DSCR
- —
- Eligible?
- —
Short-term bridge; refi at stabilization.
Rent comps 1 comps
| Address | Beds | Baths | Sqft | Rent | $/sqft | DOM | Units | Dist |
|---|---|---|---|---|---|---|---|---|
| 213 Walker Ave Manchester, GA | 4.0 | 2.5 | 1600 | $1,450 | $0.91 | 20d | 1 | 0.43mi |
Listing history 31 events
-
2026-06-19days on market $151,500 Active 113 DOM
-
2026-06-18days on market $151,500 Active 112 DOM
-
2026-06-17days on market $151,500 Active 111 DOM
-
2026-06-16days on market $151,500 Active 110 DOM
-
2026-06-15days on market $151,500 Active 109 DOM
-
2026-06-14days on market $151,500 Active 107 DOM
-
2026-06-12days on market $151,500 Active 106 DOM
-
2026-06-09days on market $151,500 Active 103 DOM
-
2026-06-08days on market $151,500 Active 102 DOM
-
2026-06-07days on market $151,500 Active 101 DOM
-
2026-06-05days on market $151,500 Active 98 DOM
-
2026-06-03days on market $151,500 Active 97 DOM
-
2026-06-02days on market $151,500 Active 96 DOM
-
2026-06-01days on market $151,500 Active 95 DOM
-
2026-05-31days on market $151,500 Active 94 DOM
-
2026-05-30days on market $151,500 Active 93 DOM
-
2026-04-09price $151,500 379-char remark
Show marketing remark (313 chars)
This home was built in 1959 and has charm written all over it. Located in an area of older established homes. A split bedroom plan with all 4 bedrooms are good size. Front porch has a very pretty tile floor and large enough for rocking chairs. Back screened porch lookings over the back yard. Such a sweet home !!
-
2026-04-09price $151,500 313-char remark
Show marketing remark (313 chars)
This home was built in 1959 and has charm written all over it. Located in an area of older established homes. A split bedroom plan with all 4 bedrooms are good size. Front porch has a very pretty tile floor and large enough for rocking chairs. Back screened porch lookings over the back yard. Such a sweet home !!
-
2026-03-03status Back On Market 379-char remark
Show marketing remark (379 chars)
This home has charm written all over it. Built in 1959, this home is located in a well established neighborhood. The front porch has a pretty tile floor and is large enough for rocking chairs. There is a split bedroom plan with all 4 bedrooms being a nice size. There is a sweet back screened porch that over looks the back yard. This home is just waiting for the right family.
-
2026-03-02status Active 313-char remark
Show marketing remark (313 chars)
This home was built in 1959 and has charm written all over it. Located in an area of older established homes. A split bedroom plan with all 4 bedrooms are good size. Front porch has a very pretty tile floor and large enough for rocking chairs. Back screened porch lookings over the back yard. Such a sweet home !!
-
2026-02-18status Under Contract 379-char remark
Show marketing remark (313 chars)
This home was built in 1959 and has charm written all over it. Located in an area of older established homes. A split bedroom plan with all 4 bedrooms are good size. Front porch has a very pretty tile floor and large enough for rocking chairs. Back screened porch lookings over the back yard. Such a sweet home !!
-
2026-02-18status Pending 313-char remark
Show marketing remark (313 chars)
This home was built in 1959 and has charm written all over it. Located in an area of older established homes. A split bedroom plan with all 4 bedrooms are good size. Front porch has a very pretty tile floor and large enough for rocking chairs. Back screened porch lookings over the back yard. Such a sweet home !!
-
2026-02-13$154,900 Active 313-char remark
Show marketing remark (313 chars)
This home was built in 1959 and has charm written all over it. Located in an area of older established homes. A split bedroom plan with all 4 bedrooms are good size. Front porch has a very pretty tile floor and large enough for rocking chairs. Back screened porch lookings over the back yard. Such a sweet home !!
-
2026-02-12$154,900 New 379-char remark
Show marketing remark (379 chars)
This home has charm written all over it. Built in 1959, this home is located in a well established neighborhood. The front porch has a pretty tile floor and is large enough for rocking chairs. There is a split bedroom plan with all 4 bedrooms being a nice size. There is a sweet back screened porch that over looks the back yard. This home is just waiting for the right family.
-
2020-01-11historical
-
2019-11-08price $86,500
-
2019-10-18$91,500 New
-
2015-06-05soldstatus $55,900
-
2014-09-26historical
-
2014-05-29price $68,000 Reduced
-
2013-09-26$69,000 New
ⓘ Source: listings_history table (triggers on properties + properties_extension) + one-shot
backfill from property_details.listing_events for pre-trigger history.
Tax reassessment forecast GA · Resets to sale price
- Current annual tax
- $454 · $38/mo
- Projected year-2 tax
- $1,394 · $116/mo
- Expected delta
- +$939/yr (+$78/mo · 206.7%)
ⓘ Screening estimate from a state-policy table — verify with the county assessor before closing.
Climate risk First Street
- Flood 1/10 Low FEMA zone X (unshaded) · 0% chance over 30 yrs
- Wildfire 2/10 Low
- Heat 6/10 Major 7 d/yr ≥106°F today · 20 d/yr by 30 yrs out
- Wind 6/10 Major 62% chance of damaging wind over 30 yrs
- Air quality 2/10 Low 2 unhealthy d/yr today · 2 by 30 yrs out
Nearby sold comps map
Loading sold comps map…
Walkable amenities ~0.75 mi
Loading nearby amenities…
Taxation est. · year 1
- Rental income
- $17,400
- − Mortgage interest
- −$8,486
- − Property taxes
- −$454
- − Insurance
- −$758
- − Repairs & maintenance
- −$1,392
- − Management
- −$1,392
- − Depreciation
- −$4,407
- Taxable income
- $510
- Est. tax owed @ 24.0%
- −$122
- After-tax cash flow
- $2,878/yr
For passive investors: Depreciation is non-cash, so a rental often shows a tax loss while cash-flowing — sheltering income. Rental losses are passive: they offset passive income freely, and up to $25,000/yr can offset ordinary (W-2) income if you actively participate and your MAGI is under $100k (phasing out to $0 by $150k); unused losses carry forward. On sale, claimed depreciation is recaptured at up to 25%, and gains may owe capital-gains tax (a 1031 exchange can defer both). Figures are a year-1 estimate at your 24.0% rate — not tax advice; consult a CPA.
Schools (NCES district)
- District
- Meriwether County
- NCES district ID
- 1303630
- Math proficiency
- 18% ▼ -11.00%
- Reading proficiency
- 22% ▼ -6.00%
- Median HH income
- $36,287
- Composite
- 16.59/100
- National rank
- #9175
- State rank
- #144 of 174 in GA
Livability — Manchester
- Score
- 55/100
- State rank
- #525
- US rank
- #23555
Category grades
Schools grade is shown separately in the Schools card above.
Census & demographics
- Census place
- Manchester, GA
- Population (ZIP)
- 4,872
Population outlook (Meriwether County) Hauer SSP2
- Today (2025)
- 19,554 people
- By 2030
- 18,482 · -5.5%
- By 2040
- 16,204 · -17.1%
- By 2050
- 14,030 · -28.2%
- By 2075
- 9,539 · -51.2%
- By 2100
- 6,136 · -68.6%
Race, ethnicity, and origin ACS 2023
- Race & ethnicity
- Black 49% White 48% Two or more races 2%
- Common ancestry
- Portuguese 1% Italian 1% Slovak 1%
- Foreign-born
- 0%
Political lean MEDSL · Meriwether
- 2024 margin
- Strong R (+25.5) · D 37.1% · R 62.6%
- 2008→2024 swing
- -20.0pp toward R · 2008: -5.4pp · 2024: -25.5pp
- All cycles
- 2024: R+25.5 2020: R+20.6 2016: R+15.4 2012: R+5.7 2008: R+5.4
Not yet ingested
- Civics
- —
Market trends
- HPI YoY
- ▲ 23.75%
- Current HPI
- 298.3716
- Rent YoY
- —
- Metro
- —
- State GDP YoY
- ▲ 2.66%
- F500 in state
- 28
Industry mix (Fortune 500 HQ in GA)
| Industry | F500 HQs | Revenue |
|---|---|---|
| Paper / Packaging | 2 | $29B |
|
||
| Retail | 1 | $160B |
|
||
| Transportation / Logistics | 1 | $91B |
|
||
| Airlines | 1 | $62B |
|
||
| Consumer Goods | 1 | $47B |
|
||
| Utilities | 1 | $25B |
|
||
Price history
+119.6% since first listed15 events — show timeline
- 2026-04-09 Price Changed $151,500 GAMLS
- 2026-04-09 Price Changed $151,500 CBOR
- 2026-03-03 Relisted — GAMLS
- 2026-03-02 Relisted — CBOR
- 2026-02-18 Pending — GAMLS
- 2026-02-18 Pending — CBOR
- 2026-02-13 Listed $154,900 CBOR
- 2026-02-12 Listed $154,900 GAMLS
- 2020-01-11 Listing Removed — GAMLS
- 2019-11-08 Price Changed $86,500 GAMLS
- 2019-10-18 Listed $91,500 GAMLS
- 2015-06-05 Sold (Public Records) $55,900 Public Records
- 2014-09-26 Listing Removed — GAMLS
- 2014-05-29 Price Changed $68,000 GAMLS
- 2013-09-26 Listed $69,000 GAMLS
Property tax history
+5.2%/yrLatest (2025): $454 · -0.8% YoY. Source: county tax records.
Cash-flow waterfall
monthlySold comps — $/sqft
last 12 mo · ≤1 miLoading sold comps…