 🌊 Lakefront
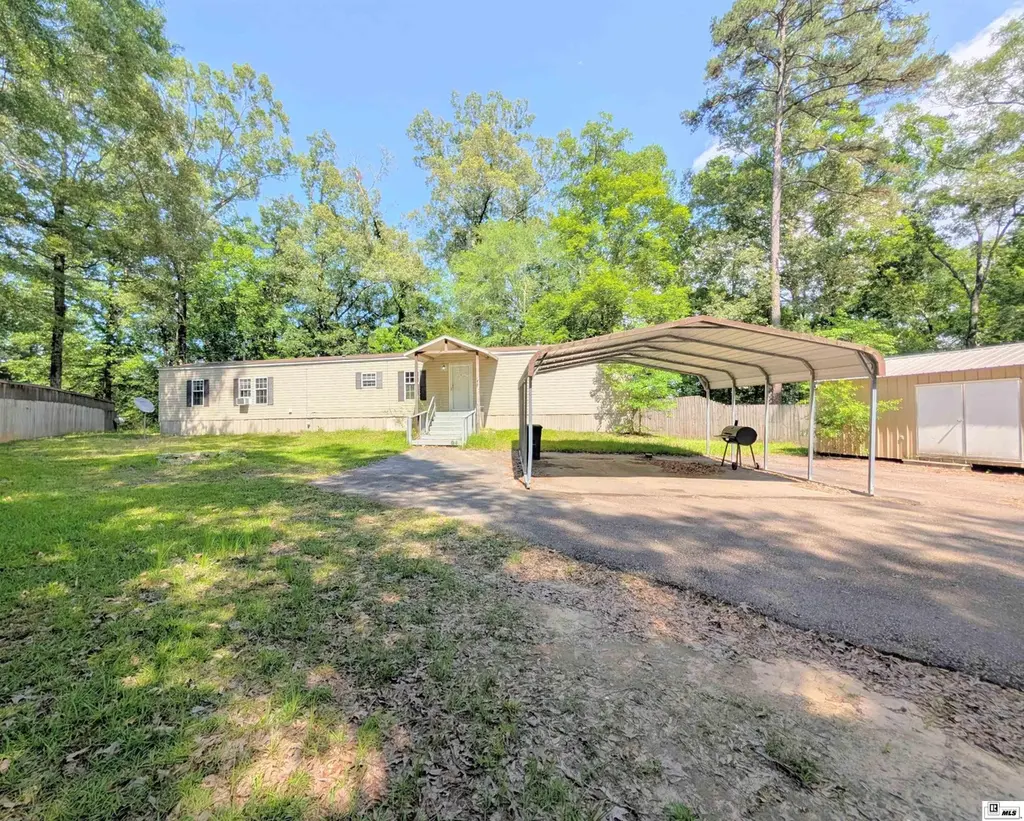
119 Bud Davidson Rd · Farmerville, LA
Flood risk No data
- FEMA flood zone
- —
- Chance of flooding over 30 yrs
- —
- Est. flood insurance / yr
- —
Fire risk No data
- Est. fire insurance / yr
- —
Heat risk No data
- Hot days now (above threshold)
- —
- Hot days in 30 yrs
- —
Wind risk No data
- Chance of severe wind over 30 yrs
- —
Air-quality risk No data
- Unhealthy air days now
- —
- Unhealthy air days in 30 yrs
- —
Risk factors via First Street. Map © Google.
Why this score? — see what drove the D+ grade
The composite is a weighted blend of 9 inputs, each scored 0–100. Each bar is that input's sub-score; the figure is the points it added to the 100-point composite (weight × sub-score).
- Cash flow +17.5/30.0
- ARV discount +7.5/15.0
- DSCR +5.5/10.0
- Appreciation +5.0/10.0
- 1% rule +3.8/10.0
- Livability +2.9/5.0
- Rent growth +2.5/5.0
- Condition / age +2.5/5.0
- Schools +1.3/10.0
$120,000
🖨 Deal sheet 📄 Offer letter ✓ Due diligence
Listing remarks
Waterfront Opportunity on Corney Bayou! Nestled on 1.36 acres with approximately 160 feet of water frontage, this property offers a rare chance to enjoy the peaceful beauty of Corney Bayou at Hog Pen Landing, just under 15 minutes from Farmerville and only minutes from Lake D'Arbonne. Located along the designated Scenic Byway, this area is known for its outstanding fishing, paddling, duck hunting, and abundant wildlife as Corney Bayou transitions into Lake D'Arbonne. One of the biggest advantages of this waterfront property is that it is located in Flood Zone X, meaning flood insurance is not typically required by lenders. The home is situated on a publicly maintained road and features a co
Key facts
- 1.36 acres
- Public boat ramp
- Concrete driveway
Tags
Property features AI
Finance
- Other: Located in the Lakeview subdivision
- HOA & community: No association amenities
Exterior
- Parking: 2-car garage; Carport
- Utilities: Public water; Natural gas not available
- Home design: Manufactured home (single wide); One story; Entry level: 1; Residential property
- Construction: Vinyl siding; Composition roof
- Exterior features: Screened, covered patio/porch; Wood fencing; Lakefront waterfront; Landscaped, wooded, and cleared yard; Scenic views; Storage structure
Interior
- Kitchen: Dishwasher; Refrigerator; Microwave; Range hood; Electric range; Electric water heater
- Bedrooms: 3 bedrooms on the main level
- Bathrooms: 2 full bathrooms (both on the main level)
- Heating & cooling: Central electric heat; Central air conditioning; Ceiling fans
- Interior features: Ceiling fans; Walk-in closet(s); Double pane windows; Crawl space basement
Neighborhood map
What this means for you Summary
Snapshot
- This is a 3-bed/2.0-bath manufactured listed at $120k.
Deal economics
- At list price, monthly cash flow is $92 ($1k/yr) — positive.
- The deal already cash-flows at list — no discount required.
- To meet the 1% rule (rent ≥ 1% of price), the offer needs to be $106k (12.1% below list).
- Recommended offer: $106k (12.1% below list) — sets the bar for 1% rule.
- Cap rate 7.2% vs local median 5.6% in Farmerville — meaningfully above typical; check what's discounted (condition, days-on-market, listing class) to confirm the premium yield is real.
Location & tenants
- Location reads 57/100 on livability (#321 in LA) — a working-class tenant base; expect higher turnover. Strengths: cost of living A+, housing A+; Watch: health & safety D, crime F, amenities F.
- Union Parish (rural): math 12% / reading 20% proficiency, ranked #74 of 98 in LA (top 76%) — low school quality limits family demand, transient renter base, plan for 1-2y turnover; 76% free/reduced lunch — lower-income household profile, screen leases tightly.
- Market conditions: 18 active listings in the ZIP; 2 units permitted in Union Parish in 2024 (0 in 5+ unit buildings).
Forward outlook
- In year one you build about $768 of equity ($830 loan paydown + $-62 appreciation (-0.1% local appreciation)).
- Union County population projected at -14% by 2050 — secular population decline; favor cash flow + early exit over multi-decade hold.
- At projected returns (-0.1% appreciation + 3.0% rent growth), your $34k cash investment doubles in ~10 years — after that, you're playing with house money.
Negotiation context
- Only 10 days on market — expect competitive offers; lowballing is unlikely to land.
- Current owner paid $95k; 26% above their basis — modest negotiation headroom, anchor on the comps not their cost.
Questions for the listing agent
- Is there a deadline driving the sale (1031 exchange, divorce, estate, relocation)? That informs how much negotiation room exists.
- Crime grade is F in this area — have there been break-ins, vandalism, or insurance claims at this property in the last 3 years? What carrier currently insures it and at what premium?
- The area grade is low — what's the realistic commute time and amenity access for the typical tenant pool here? Any planned neighborhood developments (good or bad) we should know about?
- This sits on a lake — are riparian / water-frontage rights deeded with the parcel? Any dock permits, shoreline easements, or HOA water-use restrictions?
- What's the documented flood / surge / shoreline-erosion history here (FEMA AND non-FEMA — e.g., storm surge, creek backup, septic-field saturation)?
- Any water-quality or seasonal algae-bloom issues that affect tenant satisfaction or short-term-rental demand?
- What's the average days-on-market for RENTAL listings here right now (not sales)? A rising rental-DOM trend means longer vacancies and softer asking-rent achievability than the comps imply.
- What's the recent tenant-quality profile in this submarket — average credit score on applications, eviction rate, late-payment / NSF rate, and stable-employment percentage? A property-management company in the area should have these aggregated.
- How much new for-sale + rental construction is in the pipeline within 1–3 miles? Heavy new supply typically softens prices + rents 12–24 months out; constrained supply supports both.
Investment metrics
- 1% rule
- 0.88% ✗
- Cap rate
- 7.22%
- Cash-on-cash
- 3.30%
- DSCR
- 1.15
- GRM
- 9.5
CMA / ARV
No comps found within radius.
Projected returns pro-forma
-0.05% appreciation · 3.0% rent growth · sell at horizon
- IRR
- 1.3%
- Equity multiple
- 1.06×
- Total profit
- $2,039
- Equity at exit
- $34,536
- IRR
- 6.8%
- Equity multiple
- 1.73×
- Total profit
- $24,604
- Equity at exit
- $41,269
Cash invested: $33,600 (down + closing). Projections, not guarantees.
Landlord ↔ Tenant lean methodology
- Overall (STATE)
- 90 Strongly Landlord-Friendly
- State Louisiana
- 90 Strongly Landlord-Friendly · R+12
- County
- — inherits STATE
- City
- — inherits STATE
ZIP-level market 71222
- Home prices YoY
- -0.1%
- Active inventory
- 18
- Price-to-rent
- 9.5×
Monthly cashflow live
- Estimated rent
- $1,055 medium interval (Pro) →
- Mortgage (P&I)
- −$629
- Tax from tax record
- −$62 /mo · $745/yr
- Insurance
- −$50
- HOA
- −$0
- Vacancy / Maint / Mgmt
- −$222
- Net cashflow
- $92
Break-even live
UW: 25.0% down · 7.5% · 30yr · 1.5% tax · 5.0% vac · 8.0% maint · 8.0% mgmt
Financing live
Cash to close
- Down payment
- $30,000
- Closing costs
- $3,600
- Reserves months
- —
- Total cash needed
- —
Loan-product check · same deal, 3 products live
Conventional
25% down · 7.5% · 30yr
- Down + closing
- —
- Monthly P&I
- —
- Monthly cashflow
- —
- DSCR
- —
- Eligible?
- —
Personal DTI + credit; lowest rate.
DSCR
20% down · 8.5% · 30yr
- Down + closing
- —
- Monthly P&I
- —
- Monthly cashflow
- —
- DSCR
- —
- Eligible?
- —
No personal income docs; deal must DSCR.
Hard money
10% down · 12.0% · 12mo
- Down + closing
- —
- Monthly P&I
- —
- Monthly cashflow
- —
- DSCR
- —
- Eligible?
- —
Short-term bridge; refi at stabilization.
Listing history 9 events
-
2026-06-19days on market $120,000 Active 10 DOM
-
2026-06-18days on market $120,000 Active 9 DOM
-
2026-06-17days on market $120,000 Active 8 DOM
-
2026-06-16days on market $120,000 Active 7 DOM
-
2026-06-15days on market $120,000 Active 6 DOM
-
2026-06-14days on market $120,000 Active 4 DOM
-
2026-06-13days on market $120,000 Active 3 DOM
-
2026-06-10remarks 699-char remark
-
2026-06-10$120,000 Active 1 DOM
ⓘ Source: listings_history table (triggers on properties + properties_extension) + one-shot
backfill from property_details.listing_events for pre-trigger history.
Tax reassessment forecast LA · Resets to sale price
- Current annual tax
- $745 · $62/mo
- Projected year-2 tax
- $745 · $62/mo
- Expected delta
- $0/yr ($0/mo · 0.0%)
ⓘ Screening estimate from a state-policy table — verify with the county assessor before closing.
Nearby sold comps map
Loading sold comps map…
Walkable amenities ~0.75 mi
Loading nearby amenities…
Taxation est. · year 1
- Rental income
- $12,663
- − Mortgage interest
- −$6,722
- − Property taxes
- −$745
- − Insurance
- −$600
- − Repairs & maintenance
- −$1,013
- − Management
- −$1,013
- − Depreciation
- −$3,491
- Taxable loss
- −$921
- Est. tax savings @ 24.0%
- +$221
- After-tax cash flow
- $1,328/yr
For passive investors: Depreciation is non-cash, so a rental often shows a tax loss while cash-flowing — sheltering income. Rental losses are passive: they offset passive income freely, and up to $25,000/yr can offset ordinary (W-2) income if you actively participate and your MAGI is under $100k (phasing out to $0 by $150k); unused losses carry forward. On sale, claimed depreciation is recaptured at up to 25%, and gains may owe capital-gains tax (a 1031 exchange can defer both). Figures are a year-1 estimate at your 24.0% rate — not tax advice; consult a CPA.
Schools (NCES district)
- District
- Union Parish
- NCES district ID
- 2201770
- Math proficiency
- 12% ▼ -37.00%
- Reading proficiency
- 20% ▼ -34.00%
- Median HH income
- $37,279
- Composite
- 13.35/100
- National rank
- #9537
- State rank
- #74 of 98 in LA
Livability — Farmerville
- Score
- 57/100
- State rank
- #321
- US rank
- #21826
Category grades
Schools grade is shown separately in the Schools card above.
Census & demographics
- Population (ZIP)
- 2,621
Population outlook (Union County) Hauer SSP2
- Today (2025)
- 21,722 people
- By 2030
- 21,226 · -2.3%
- By 2040
- 20,026 · -7.8%
- By 2050
- 18,682 · -14.0%
- By 2075
- 15,725 · -27.6%
- By 2100
- 12,509 · -42.4%
Race, ethnicity, and origin ACS 2023
- Neighborhood character
- Diverse neighborhood (Simpson 0.57)
- Race & ethnicity
- White 56% Black 33% Hispanic / Latino 9% Two or more races 5%
- Hispanic origin (detail)
- Mexican 8%
- Common ancestry
- Slovak 1% Lithuanian 1% Italian 1%
- Foreign-born
- 5% · Canada
- Languages at home
- 94% English-only · Spanish 6%
Political lean MEDSL · Union
- 2024 margin
- Solid R (+57.0) · D 21.1% · R 78.0%
- 2008→2024 swing
- -15.4pp toward R · 2008: -41.5pp · 2024: -57.0pp
- All cycles
- 2024: R+57.0 2020: R+51.4 2016: R+48.5 2012: R+41.7 2008: R+41.5
Not yet ingested
- Civics
- —
Market trends
- HPI YoY
- ▼ -0.05%
- Current HPI
- 77.4222
- Rent YoY
- —
- Metro
- —
- State GDP YoY
- ▲ 3.29%
- F500 in state
- 10
Industry mix (Fortune 500 HQ in LA)
| Industry | F500 HQs | Revenue |
|---|---|---|
| Telecommunications | 2 | $23B |
|
||
| Utilities | 1 | $12B |
|
||
| Wholesale / Distribution | 1 | $5B |
|
||
| Advertising | 1 | $2B |
|
||
Price history
+26.3% since first listed2 events — show timeline
- 2026-06-09 Listed $120,000 NELABOR
- 2018-02-26 Sold (Public Records) $95,000 Public Records
Property tax history
+10.1%/yrLatest (2025): $745 · +0.0% YoY. Source: county tax records.
Cash-flow waterfall
monthlySold comps — $/sqft
last 12 mo · ≤1 miLoading sold comps…