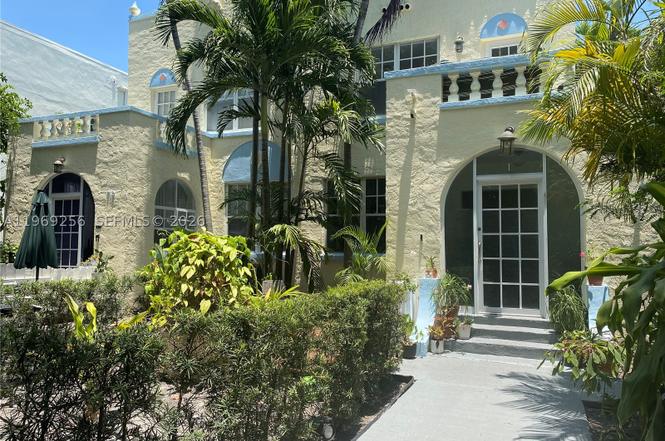
719 Meridian Ave #7 · Miami Beach, FL
Flood risk 9/10 · Severe
- FEMA flood zone
- AE
- Chance of flooding over 30 yrs
- 0.99%
- Est. flood insurance / yr
- $1,737 – $8,500
Fire risk 3/10 · Minor
- Est. fire insurance / yr
- $947 – $1,759
Heat risk 10/10 · Severe
- Hot days now (above 101°F)
- 8 days/yr
- Hot days in 30 yrs
- 33 days/yr
Wind risk 10/10 · Severe
- Chance of severe wind over 30 yrs
- 99.0%
Air-quality risk 2/10 · Minimal
- Unhealthy air days now
- 1 days/yr
- Unhealthy air days in 30 yrs
- 1 days/yr
Risk factors via First Street. Map © Google.
Why this score? — see what drove the B- grade
The composite is a weighted blend of 9 inputs, each scored 0–100. Each bar is that input's sub-score; the figure is the points it added to the 100-point composite (weight × sub-score).
- Cash flow +26.4/30.0
- 1% rule +10.0/10.0
- DSCR +9.0/10.0
- ARV discount +7.5/15.0
- Schools +4.2/10.0
- Livability +4.0/5.0
- Appreciation +3.9/10.0
- Condition / age +2.5/5.0
- Rent growth +2.4/5.0
$235,000
🖨 Deal sheet 📄 Offer letter ✓ Due diligence
Listing remarks
Villa Veneto small charming private boutique building located in the most famous Art Deco District walkable tree - lined street close to Flamingo Park, Lincoln Rd Mall, Dining, Shops and Beaches! Remodeled 1 spacious bedroom, 1 bath with Living, Dining and Modern kitchen SS appliances, Washer , Dryer and Central AC! Wood floors thru -out, Low Maint. includes water/trash, Large Pet Friendly community . Come. .. . Live the affordable vacation lifestyle South Beach has to offer! Tenant occupied until Nov 2026.
Key facts
- Flamingo park
- Art deco district
- Tree lined street
Tags
Property features AI
Finance
- Other: Annual tax information available
- Financial info: Pets allowed with size limit; more than 20 lbs allowed
- HOA & community: Monthly HOA fee; HOA fee covers association management, common areas, hot water, insurance, legal/accounting, grounds maintenance, structure maintenance, reserve fund, roof, sewer, and trash; 8 units in the community
Exterior
- Parking: On-street parking
- Security: Closed-circuit cameras
- Utilities: Central heating and cooling; Electric water heater
- Home design: 2-story building; Entry located on level 2; Attached property
- Construction: Block construction; Resale property
- Exterior features: Fenced property; Complex is fenced
Interior
- Kitchen: Electric range; Microwave; Dishwasher; Refrigerator
- Bedrooms: Bedroom located on the main level
- Flooring: Hardwood; Wood
- Bathrooms: 1 full bathroom
- Heating & cooling: Central heating; Central air conditioning
- Interior features: Second-floor entry; Bedroom on main level
- Laundry & utility: Washer; Dryer; Electric water heater
Neighborhood map
What this means for you Summary
Snapshot
- This is a 1-bed/1.0-bath condo listed at $235k.
Deal economics
- At list price, monthly cash flow is $191 ($2k/yr) — positive.
- The deal already cash-flows at list — no discount required.
- Meets the 1% rule at list price ($4k rent vs $235k).
- Recommended offer: $221k (6.0% below list) — sets the bar for market timing.
- Cap rate 9.4% vs local median 1.5% in Miami Beach — top-decile yield for the area; either an underpriced asset or a hidden risk that comps aren't pricing in. Stress-test before assuming the spread holds.
Location & tenants
- Location reads 80/100 on livability (#108 in FL, #1,672 nationally) — a professional / high-income tenant draw. Strengths: crime A+, commute A+, health & safety A+; Watch: housing C-, amenities D-, cost of living F.
- Miami-Dade (suburban): math 45% / reading 54% proficiency, ranked #40 of 73 in FL (top 55%) — families likely to look elsewhere, expect single-tenant / working-renter base with shorter leases; 64% free/reduced lunch — lower-income household profile, screen leases tightly.
- Market conditions: Rents soft (-0.4%/yr); 1208 active listings in the ZIP; 2 comparable units currently listed for rent nearby; 10,051 units permitted in Miami-Dade County in 2024 (7,758 in 5+ unit buildings).
- At $3,588/mo this rent would consume 62% of the median local household income ($70k/yr) (locally 4052% of renters already pay >50% of income on rent) — very limited rent-growth headroom before tenants either downsize or default.
Forward outlook
- Local home prices are declining (-2.2%/yr); year-one equity from $2k of loan paydown is wiped out by about $5k of value loss. Plan a longer hold.
- Miami-Dade County population projected at +28% by 2050 — long-run rental-demand tailwind backs the buy-and-hold thesis.
Negotiation context
- It's been on market 71 days — a 6% lower offer ($221k) is reasonable based on typical stale-listing flexibility.
- 5 sale attempts with the ask held roughly flat each time — persistent listings suggest the price (not the market) is what's stuck; bring a comps-based counter.
Risks & watch-outs
- Watch-outs: flood insurance adds $427/mo; built in 1928 — expect roof / HVAC / electrical / plumbing capex.
- Climate carrying-cost: in FEMA flood zone AE (mandatory federal flood insurance); severe wind risk, 99% chance of damaging wind over 30y; extreme-heat days projected 8→33/yr by 2055 (HVAC capex compounding) — expect insurance premiums to compound above CPI over the hold.
Questions for the listing agent
- It's been on market 71 days. Have you received any prior offers? Is the seller open to a 6% concession, seller financing, or rate buy-down credit?
- Built in 1928 — when were the roof, HVAC, electrical panel, plumbing, and water heater last replaced?
- What's the actual annual flood-insurance premium (NFIP or private), and is the property in a SFHA with mandatory coverage?
- What does the HOA fee cover, when was the last increase, and are there any pending special assessments or reserve-fund shortfalls?
- Any open or pending special assessments — roof, HVAC, plumbing, elevator, façade? What's the per-unit balance and payoff schedule, and is the seller paying it off at close or rolling it to the buyer?
- Why hasn't it sold? Are there any deal-killer items the seller is aware of (foundation, flood, title, zoning, code violations)?
- Is there a deadline driving the sale (1031 exchange, divorce, estate, relocation)? That informs how much negotiation room exists.
- Schools are A-rated — typically a magnet for longer-tenancy family renters. What's the average tenant stay here, and is there a school-zone premium baked into asking?
- What's the average days-on-market for RENTAL listings here right now (not sales)? A rising rental-DOM trend means longer vacancies and softer asking-rent achievability than the comps imply.
- What's the recent tenant-quality profile in this submarket — average credit score on applications, eviction rate, late-payment / NSF rate, and stable-employment percentage? A property-management company in the area should have these aggregated.
- How much new apartment / multifamily construction is in the pipeline within 1–3 miles? Heavy new supply (>2% of stock underway) typically softens rents 12–24 months out; light construction supports rent growth.
Investment metrics
- 1% rule
- 1.53% ✓
- Cap rate
- 9.45%
- Cash-on-cash
- 11.26%
- DSCR
- 1.50
- GRM
- 5.5
CMA / ARV
No comps found within radius.
Projected returns pro-forma
-2.19% appreciation · 0.0% rent growth · sell at horizon
- IRR
- -11.2%
- Equity multiple
- 0.58×
- Total profit
- $-27,671
- Equity at exit
- $43,636
- IRR
- -9.9%
- Equity multiple
- 0.40×
- Total profit
- $-39,169
- Equity at exit
- $35,398
Cash invested: $65,800 (down + closing). Projections, not guarantees.
Landlord ↔ Tenant lean methodology
- Overall (STATE)
- 87 Strongly Landlord-Friendly
- State Florida
- 87 Strongly Landlord-Friendly · R+3
- County
- — inherits STATE
- City
- — inherits STATE
ZIP-level market 33139
- Home prices YoY
- -0.8%
- Rents YoY
- -0.4%
- Active inventory
- 1208
- Price-to-rent
- 5.5×
Monthly cashflow live
- Estimated rent
- $3,588 medium interval (Pro) →
- Mortgage (P&I)
- −$1,232
- Tax from tax record
- −$280 /mo · $3,358/yr
- Insurance
- −$98
- Flood insurance flood zone
- −$427 /mo · $5,118/yr
- HOA
- −$607
- Vacancy / Maint / Mgmt
- −$754
- Net cashflow
- $191
Break-even live
UW: 25.0% down · 7.5% · 30yr · 1.5% tax · 5.0% vac · 8.0% maint · 8.0% mgmt
Financing live
Cash to close
- Down payment
- $58,750
- Closing costs
- $7,050
- Reserves months
- —
- Total cash needed
- —
Loan-product check · same deal, 3 products live
Conventional
25% down · 7.5% · 30yr
- Down + closing
- —
- Monthly P&I
- —
- Monthly cashflow
- —
- DSCR
- —
- Eligible?
- —
Personal DTI + credit; lowest rate.
DSCR
20% down · 8.5% · 30yr
- Down + closing
- —
- Monthly P&I
- —
- Monthly cashflow
- —
- DSCR
- —
- Eligible?
- —
No personal income docs; deal must DSCR.
Hard money
10% down · 12.0% · 12mo
- Down + closing
- —
- Monthly P&I
- —
- Monthly cashflow
- —
- DSCR
- —
- Eligible?
- —
Short-term bridge; refi at stabilization.
Rent comps 2 comps
| Address | Beds | Baths | Sqft | Rent | $/sqft | DOM | Units | Dist |
|---|---|---|---|---|---|---|---|---|
| 1602 Meridian Ave Miami Beach, FL | 4.0 | 1.0–3.0 | 917 | $6,932 | $7.56 | 14d | 1 | 0.85mi |
| 15713 Fisher Island Dr #15713 Miami Beach, FL | 2.0 | 1.5 | 670 | $20,000 | $29.85 | 24d | 1 | 1.39mi |
HOA detail condo
- Monthly dues
- $607 · $7,284/yr
- Likely covers
- watertrash
- Assessments
- None detected in remarks — confirm with the listing agent.
Listing history 15 events
-
2026-06-04statusdays on market $235,000 Pending 71 DOM
-
2026-06-03days on market $235,000 Active 70 DOM
-
2026-06-02days on market $235,000 Active 69 DOM
-
2026-06-01days on market $235,000 Active 68 DOM
-
2026-05-31days on market $235,000 Active 67 DOM
-
2026-04-13status Active
-
2026-03-11status Pending
-
2026-02-19$235,000 Active
-
2026-02-13historical
-
2025-11-07historical $1,750
-
2025-10-16$1,750
-
2025-10-03status Active
-
2025-08-25status Pending
-
2025-08-13$235,000 Active
-
2007-07-13soldstatus $215,000
ⓘ Source: listings_history table (triggers on properties + properties_extension) + one-shot
backfill from property_details.listing_events for pre-trigger history.
Tax reassessment forecast FL · Resets to sale price
- Current annual tax
- $3,358 · $280/mo
- Projected year-2 tax
- $3,358 · $280/mo
- Expected delta
- $0/yr ($0/mo · 0.0%)
ⓘ Screening estimate from a state-policy table — verify with the county assessor before closing.
Climate risk First Street
- Flood 9/10 Extreme FEMA zone AE · 99% chance over 30 yrs
- Wildfire 3/10 Moderate
- Heat 10/10 Extreme 8 d/yr ≥101°F today · 33 d/yr by 30 yrs out
- Wind 10/10 Extreme 99% chance of damaging wind over 30 yrs
- Air quality 2/10 Low 1 unhealthy d/yr today · 1 by 30 yrs out
Nearby sold comps map
Loading sold comps map…
Walkable amenities ~0.75 mi
Loading nearby amenities…
Taxation est. · year 1
- Rental income
- $43,058
- − Mortgage interest
- −$13,164
- − Property taxes
- −$3,358
- − Insurance
- −$6,294
- − Repairs & maintenance
- −$3,445
- − Management
- −$3,445
- − HOA
- −$7,284
- − Depreciation
- −$6,836
- Taxable loss
- −$767
- Est. tax savings @ 24.0%
- +$184
- After-tax cash flow
- $2,476/yr
For passive investors: Depreciation is non-cash, so a rental often shows a tax loss while cash-flowing — sheltering income. Rental losses are passive: they offset passive income freely, and up to $25,000/yr can offset ordinary (W-2) income if you actively participate and your MAGI is under $100k (phasing out to $0 by $150k); unused losses carry forward. On sale, claimed depreciation is recaptured at up to 25%, and gains may owe capital-gains tax (a 1031 exchange can defer both). Figures are a year-1 estimate at your 24.0% rate — not tax advice; consult a CPA.
Schools (NCES district)
- District
- Miami-Dade
- NCES district ID
- 1200390
- Math proficiency
- 45% ▼ -16.00%
- Reading proficiency
- 54% ▼ -5.00%
- Median HH income
- $43,928
- Composite
- 41.76/100
- National rank
- #3397
- State rank
- #40 of 73 in FL
Livability — Miami Beach
- Score
- 80/100
- State rank
- #108
- US rank
- #1672
Category grades
Schools grade is shown separately in the Schools card above.
Census & demographics
- Census place
- Miami Beach, FL
- County
- Miami-Dade County · 2,697,751 people
- City population
- 90,533
- Metro
- Miami-Fort Lauderdale-Pompano Beach, FL
- Population (ZIP)
- 33,753
- Household income
- $69,793
- Rent vs Own
- Severe rent burden
- 4052.0
Population outlook (Miami-Dade County) Hauer SSP2
- Today (2025)
- 3,126,439 people
- By 2030
- 3,325,765 · +6.4%
- By 2040
- 3,697,561 · +18.3%
- By 2050
- 4,012,134 · +28.3%
- By 2075
- 4,605,612 · +47.3%
- By 2100
- 4,866,598 · +55.7%
Race, ethnicity, and origin ACS 2023
- Neighborhood character
- Diverse neighborhood (Simpson 0.58)
- Race & ethnicity
- Hispanic / Latino 51% White 40% Two or more races 17% Black 4% Asian 3%
- Hispanic origin (detail)
- Mexican 2% Puerto Rican 2% Cuban 15% Salvadoran 3%
- Common ancestry
- Lithuanian 3% Scotch-Irish 2% Romanian 2%
- Foreign-born
- 56% · Canada, Jamaica, Dominican Republic
- Languages at home
- 37% English-only · Spanish 49% Other Indo-European 5% French/Haitian/Cajun 3%
Political lean MEDSL · Miami-Dade
- 2024 margin
- R (+11.4) · D 43.9% · R 55.4%
- 2008→2024 swing
- -27.6pp toward R · 2008: 16.1pp · 2024: -11.4pp
- All cycles
- 2024: R+11.4 2020: D+7.3 2016: D+29.6 2012: D+23.7 2008: D+16.1
Not yet ingested
- Civics
- —
Market trends
- HPI YoY
- ▼ -2.19%
- Current HPI
- 277.9321
- Rent YoY
- ▼ -0.36%
- Metro
- Miami-Fort Lauderdale-Pompano Beach, FL
- State GDP YoY
- ▲ 3.28%
- F500 in state
- 36
Industry mix (Fortune 500 HQ in FL)
| Industry | F500 HQs | Revenue |
|---|---|---|
| Industrial Technology | 2 | $29B |
|
||
| Insurance | 2 | $17B |
|
||
| Retail | 1 | $60B |
|
||
| Technology Distribution | 1 | $58B |
|
||
| Homebuilding | 1 | $35B |
|
||
| Technology Manufacturing | 1 | $35B |
|
||
Price history
+9.3% since first listed10 events — show timeline
- 2026-04-13 Relisted — MARMLS
- 2026-03-11 Pending — MARMLS
- 2026-02-19 Listed $235,000 MARMLS
- 2026-02-13 Listing Removed — MARMLS
- 2025-11-07 Rental Removed $1,750 MARMLS
- 2025-10-16 Listed for Rent $1,750 MARMLS
- 2025-10-03 Relisted — MARMLS
- 2025-08-25 Pending — MARMLS
- 2025-08-13 Listed $235,000 MARMLS
- 2007-07-13 Sold (MLS) $215,000 MARMLS
Property tax history
+5.0%/yrLatest (2025): $3,358 · +4.5% YoY. Source: county tax records.
Cash-flow waterfall
monthlySold comps — $/sqft
last 12 mo · ≤1 miLoading sold comps…