34228 Magnolia Wood Dr · Watson, LA
Flood risk 1/10 · Minimal
- FEMA flood zone
- X (unshaded)
- Chance of flooding over 30 yrs
- 0.0%
- Est. flood insurance / yr
- $507 – $1,088
Fire risk 3/10 · Minor
- Est. fire insurance / yr
- $1,269 – $2,357
Heat risk 8/10 · Major
- Hot days now (above 108°F)
- 7 days/yr
- Hot days in 30 yrs
- 20 days/yr
Wind risk 9/10 · Severe
- Chance of severe wind over 30 yrs
- 99.0%
Air-quality risk 3/10 · Minor
- Unhealthy air days now
- 2 days/yr
- Unhealthy air days in 30 yrs
- 3 days/yr
Risk factors via First Street. Map © Google.
Why this score? — see what drove the B+ grade
The composite is a weighted blend of 9 inputs, each scored 0–100. Each bar is that input's sub-score; the figure is the points it added to the 100-point composite (weight × sub-score).
- Cash flow +30.0/30.0
- ARV discount +13.2/15.0
- 1% rule +10.0/10.0
- DSCR +10.0/10.0
- Schools +4.0/10.0
- Livability +3.6/5.0
- Rent growth +2.5/5.0
- Condition / age +2.2/5.0
- Appreciation +0.0/10.0
$70,000
🖨 Deal sheet 📄 Offer letter ✓ Due diligence
Listing remarks MLS
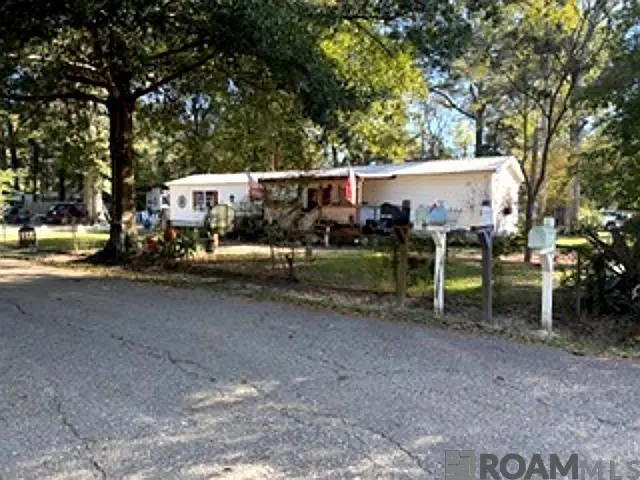
Nice 3BR/2BA mobile home on a corner lot in Denham Springs, located less than 1.5 miles from shopping, restaurants, and grocery stores. Enjoy a quiet neighborhood with a covered front porch leading into an open floor plan with built-in shelving in the living room. Split bedroom layout offers privacy, with a spacious primary suite. Covered back deck off the kitchen is perfect for outdoor dining. Did not flood in August 2016.
Key facts
- Covered front porch
- Open floor plan
- Split bedroom layout
Tags
Property features AI
Exterior
- Parking: Open parking
- Utilities: Public water; Public sewer
- Home design: Single-story manufactured home; Residential property in the Live Oak subdivision; Corner lot location
- Construction: Vinyl siding; 1 story
- Exterior features: Metal roof
Interior
- Bathrooms: 2 full bathrooms
- Heating & cooling: Central heating; Central air conditioning
- Interior features: Central heating; Central air conditioning
Neighborhood map
What this means for you Summary
Snapshot
- This is a 3-bed/2.0-bath manufactured listed at $70k. Condition is rated fair.
Deal economics
- At list price, monthly cash flow is $820 ($10k/yr) — positive.
- The deal already cash-flows at list — no discount required.
- Meets the 1% rule at list price ($2k rent vs $70k).
- Cap rate 20.3% vs local median 4.8% in Watson — top-decile yield for the area; either an underpriced asset or a hidden risk that comps aren't pricing in. Stress-test before assuming the spread holds.
Location & tenants
- Location reads 71/100 on livability (#50 in LA) — a middle-class / working-renter tenant base. Strengths: schools A+, crime A+, employment A+; Watch: amenities F, commute F, health & safety F.
- Livingston Parish (suburban): math 40% / reading 52% proficiency, ranked #13 of 98 in LA (top 13%) — families likely to look elsewhere, expect single-tenant / working-renter base with shorter leases.
- Market conditions: 342 active listings in the ZIP; 1 comparable units currently listed for rent nearby; 794 units permitted in Livingston Parish in 2024 (99 in 5+ unit buildings).
Forward outlook
- Local home prices are declining (-3.0%/yr); year-one equity from $484 of loan paydown is wiped out by about $2k of value loss. Plan a longer hold.
- Livingston County population projected at +27% by 2050 — long-run rental-demand tailwind backs the buy-and-hold thesis.
- At projected returns (-3.0% appreciation + 3.0% rent growth), your $20k cash investment doubles in ~3 years — after that, you're playing with house money.
Negotiation context
- Only 1 days on market — expect competitive offers; lowballing is unlikely to land.
- 8 sale attempts since 11y ago with the ask held roughly flat each time — persistent listings suggest the price (not the market) is what's stuck; bring a comps-based counter.
Risks & watch-outs
- Climate carrying-cost: severe wind risk, 99% chance of damaging wind over 30y; extreme-heat days projected 7→20/yr by 2055 (HVAC capex compounding) — expect insurance premiums to compound above CPI over the hold.
Questions for the listing agent
- Have any recent inspections been done? Can we get a copy of the seller's disclosures and any deferred-maintenance estimates?
- Is there a deadline driving the sale (1031 exchange, divorce, estate, relocation)? That informs how much negotiation room exists.
- Schools are A-rated — typically a magnet for longer-tenancy family renters. What's the average tenant stay here, and is there a school-zone premium baked into asking?
- What's the average days-on-market for RENTAL listings here right now (not sales)? A rising rental-DOM trend means longer vacancies and softer asking-rent achievability than the comps imply.
- What's the recent tenant-quality profile in this submarket — average credit score on applications, eviction rate, late-payment / NSF rate, and stable-employment percentage? A property-management company in the area should have these aggregated.
- How much new for-sale + rental construction is in the pipeline within 1–3 miles? Heavy new supply typically softens prices + rents 12–24 months out; constrained supply supports both.
Investment metrics
- 1% rule
- 2.36% ✓
- Cap rate
- 20.35%
- Cash-on-cash
- 50.19%
- DSCR
- 3.23
- GRM
- 3.5
CMA / ARV
- ARV (on-the-fly)
- $80,142
- Comps found
- 1
Show comp detail 1 sale within ~0.75 mi
| Address | Dist | Beds/Ba | Sqft | Sold | Price | $/sf | Match |
|---|---|---|---|---|---|---|---|
| 7726 Impson St | 0.04mi | 3/2.0 | 927 (-14%) | 1mo | $68,900 | $74 | 73 |
Match score weights: distance 35% · size 25% · config 20% · recency 20%. Top-matched comps best support the ARV.
Projected returns pro-forma
-3.0% appreciation · 3.0% rent growth · sell at horizon
- IRR
- 47.9%
- Equity multiple
- 3.09×
- Total profit
- $40,892
- Equity at exit
- $10,437
- IRR
- 53.6%
- Equity multiple
- 6.25×
- Total profit
- $102,938
- Equity at exit
- $6,052
Cash invested: $19,600 (down + closing). Projections, not guarantees.
Landlord ↔ Tenant lean methodology
- Overall (STATE)
- 90 Strongly Landlord-Friendly
- State Louisiana
- 90 Strongly Landlord-Friendly · R+12
- County
- — inherits STATE
- City
- — inherits STATE
ZIP-level market 70706
- Active inventory
- 342
- Price-to-rent
- 3.5×
Monthly cashflow live
- Estimated rent
- $1,650 medium interval (Pro) →
- Mortgage (P&I)
- −$367
- Tax est. 1.5%
- −$88 /mo · $1,050/yr
- Insurance
- −$29
- HOA
- −$0
- Vacancy / Maint / Mgmt
- −$346
- Net cashflow
- $820
Break-even live
UW: 25.0% down · 7.5% · 30yr · 1.5% tax · 5.0% vac · 8.0% maint · 8.0% mgmt
Financing live
Cash to close
- Down payment
- $17,500
- Closing costs
- $2,100
- Reserves months
- —
- Total cash needed
- —
Loan-product check · same deal, 3 products live
Conventional
25% down · 7.5% · 30yr
- Down + closing
- —
- Monthly P&I
- —
- Monthly cashflow
- —
- DSCR
- —
- Eligible?
- —
Personal DTI + credit; lowest rate.
DSCR
20% down · 8.5% · 30yr
- Down + closing
- —
- Monthly P&I
- —
- Monthly cashflow
- —
- DSCR
- —
- Eligible?
- —
No personal income docs; deal must DSCR.
Hard money
10% down · 12.0% · 12mo
- Down + closing
- —
- Monthly P&I
- —
- Monthly cashflow
- —
- DSCR
- —
- Eligible?
- —
Short-term bridge; refi at stabilization.
Rent comps 1 comps
| Address | Beds | Baths | Sqft | Rent | $/sqft | DOM | Units | Dist |
|---|---|---|---|---|---|---|---|---|
| 33260 Louisiana 16 Unit 10 Denham Springs, LA | 2.0 | 2.0 | 1045 | $1,650 | $1.58 | 43d | 1 | 0.96mi |
Listing history 14 events
-
2026-05-01status Pending
-
2026-04-29$70,000 Active
Show marketing remark (427 chars)
Nice 3BR/2BA mobile home on a corner lot in Denham Springs, located less than 1.5 miles from shopping, restaurants, and grocery stores. Enjoy a quiet neighborhood with a covered front porch leading into an open floor plan with built-in shelving in the living room. Split bedroom layout offers privacy, with a spacious primary suite. Covered back deck off the kitchen is perfect for outdoor dining. Did not flood in August 2016.
-
2026-04-29$70,000 427-char remark
Show marketing remark (427 chars)
Nice 3BR/2BA mobile home on a corner lot in Denham Springs, located less than 1.5 miles from shopping, restaurants, and grocery stores. Enjoy a quiet neighborhood with a covered front porch leading into an open floor plan with built-in shelving in the living room. Split bedroom layout offers privacy, with a spacious primary suite. Covered back deck off the kitchen is perfect for outdoor dining. Did not flood in August 2016.
-
2017-07-15historical
-
2017-04-05price $70,000
-
2017-02-03$75,000 Active
-
2017-02-03$70,000
-
2017-01-16historical
-
2016-07-16$70,000 Active
-
2016-07-16$70,000
-
2016-06-29historical
-
2016-02-19price $80,000
-
2015-10-22$85,000 Active
-
2015-10-22$80,000
ⓘ Source: listings_history table (triggers on properties + properties_extension) + one-shot
backfill from property_details.listing_events for pre-trigger history.
Climate risk First Street
- Flood 1/10 Low FEMA zone X (unshaded) · 0% chance over 30 yrs
- Wildfire 3/10 Moderate
- Heat 8/10 Severe 7 d/yr ≥108°F today · 20 d/yr by 30 yrs out
- Wind 9/10 Extreme 99% chance of damaging wind over 30 yrs
- Air quality 3/10 Moderate 2 unhealthy d/yr today · 3 by 30 yrs out
Nearby sold comps map
Loading sold comps map…
Walkable amenities ~0.75 mi
Loading nearby amenities…
Taxation est. · year 1
- Rental income
- $19,800
- − Mortgage interest
- −$3,921
- − Property taxes
- −$1,050
- − Insurance
- −$350
- − Repairs & maintenance
- −$1,584
- − Management
- −$1,584
- − Depreciation
- −$2,036
- Taxable income
- $9,275
- Est. tax owed @ 24.0%
- −$2,226
- After-tax cash flow
- $7,611/yr
For passive investors: Depreciation is non-cash, so a rental often shows a tax loss while cash-flowing — sheltering income. Rental losses are passive: they offset passive income freely, and up to $25,000/yr can offset ordinary (W-2) income if you actively participate and your MAGI is under $100k (phasing out to $0 by $150k); unused losses carry forward. On sale, claimed depreciation is recaptured at up to 25%, and gains may owe capital-gains tax (a 1031 exchange can defer both). Figures are a year-1 estimate at your 24.0% rate — not tax advice; consult a CPA.
Condition & rehab AI · 6 photos
This mobile home requires significant repairs and maintenance to improve its condition and value. Exterior siding and roof repairs are critical to prevent further damage and improve curb appeal.
Repairs flagged
- Major exterior siding — Significant damage
- Major roof — Worn condition
- Major flooring — Worn carpet
- Major interior walls — Paint peeling
Value-add opportunities
- Both Paint exterior — Enhances curb appeal and value
- Both Replace carpet — Improves comfort and value
- Both Paint interior walls — Enhances interior appearance and value
Renovation cost estimate screening
| Repair item | Severity | Est. cost |
|---|---|---|
| exterior siding · Significant damage | Major | $15,000–50,000 |
| roof · Worn condition | Major | $15,000–50,000 |
| flooring · Worn carpet | Major | $15,000–50,000 |
| interior walls · Paint peeling | Major | $15,000–50,000 |
| Total estimated repair cost · 4 items | $60,000–200,000 |
Value-add ROI direction
- Both Paint exterior — Enhances curb appeal and value ↑
- Both Replace carpet — Improves comfort and value ↑
- Both Paint interior walls — Enhances interior appearance and value ↑
ⓘ Cost ranges are severity-bucket heuristics (US national rule-of-thumb). Get contractor quotes + a written scope before underwriting a rehab budget.
Schools (NCES district)
- District
- Livingston Parish
- NCES district ID
- 2201020
- Math proficiency
- 40% ▼ -38.00%
- Reading proficiency
- 52% ▼ -32.00%
- Median HH income
- $56,755
- Composite
- 40.07/100
- National rank
- #3811
- State rank
- #13 of 98 in LA
Livability — Watson
- Score
- 71/100
- State rank
- #50
- US rank
- #7247
Category grades
Schools grade is shown separately in the Schools card above.
Census & demographics
- Population (ZIP)
- 22,621
Population outlook (Livingston County) Hauer SSP2
- Today (2025)
- 158,511 people
- By 2030
- 168,241 · +6.1%
- By 2040
- 186,252 · +17.5%
- By 2050
- 201,516 · +27.1%
- By 2075
- 231,217 · +45.9%
- By 2100
- 241,697 · +52.5%
Race, ethnicity, and origin ACS 2023
- Neighborhood character
- Predominantly White (86%)
- Race & ethnicity
- White 86% Black 6% Hispanic / Latino 5% Two or more races 4%
- Hispanic origin (detail)
- Common ancestry
- Lithuanian 15% Slovak 2% Italian 1%
- Foreign-born
- 1% · Canada, China
Political lean MEDSL · Livingston
- 2024 margin
- Solid R (+68.5) · D 15.1% · R 83.6% · Other 1.3%
- 2008→2024 swing
- +3.4pp toward D · 2008: -71.9pp · 2024: -68.5pp
- All cycles
- 2024: R+68.5 2020: R+70.0 2016: R+72.5 2012: R+70.4 2008: R+71.9
Not yet ingested
- Civics
- —
Market trends
- HPI YoY
- ▼ -88.82%
- Current HPI
- 160.2185
- Rent YoY
- —
- Metro
- —
- State GDP YoY
- ▲ 3.29%
- F500 in state
- 10
Industry mix (Fortune 500 HQ in LA)
| Industry | F500 HQs | Revenue |
|---|---|---|
| Telecommunications | 2 | $23B |
|
||
| Utilities | 1 | $12B |
|
||
| Wholesale / Distribution | 1 | $5B |
|
||
| Advertising | 1 | $2B |
|
||
Price history
-12.5% since first listed14 events — show timeline
- 2026-05-01 Pending — GBRMLS
- 2026-04-29 Listed $70,000 AcadianaMLS
- 2026-04-29 Listed $70,000 GBRMLS
- 2017-07-15 Delisted — GBRMLS
- 2017-04-05 Price Changed $70,000 GBRMLS
- 2017-02-03 Listed $75,000 GBRMLS
- 2017-02-03 Listed $70,000 AcadianaMLS
- 2017-01-16 Delisted — GBRMLS
- 2016-07-16 Listed $70,000 GBRMLS
- 2016-07-16 Listed $70,000 AcadianaMLS
- 2016-06-29 Delisted — GBRMLS
- 2016-02-19 Price Changed $80,000 GBRMLS
- 2015-10-22 Listed $85,000 GBRMLS
- 2015-10-22 Listed $80,000 AcadianaMLS
Cash-flow waterfall
monthlySold comps — $/sqft
last 12 mo · ≤1 miLoading sold comps…