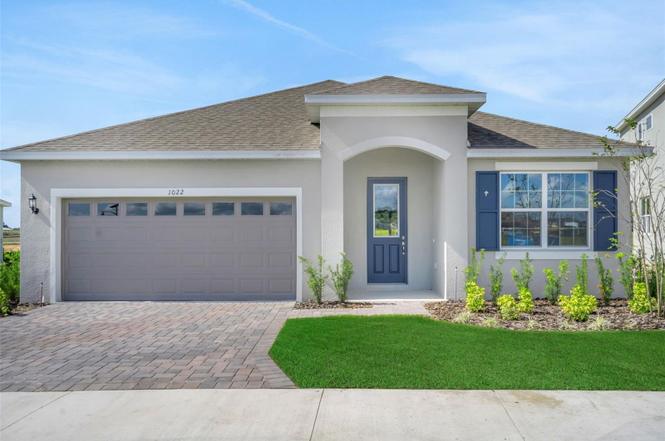
1022 Swamp Chestnut Loop · Lady Lake, FL
Flood risk 4/10 · Minor
- FEMA flood zone
- X (unshaded)
- Chance of flooding over 30 yrs
- 0.2%
- Est. flood insurance / yr
- $507 – $1,088
Fire risk 5/10 · Moderate
- Est. fire insurance / yr
- $947 – $1,759
Heat risk 9/10 · Severe
- Hot days now (above 108°F)
- 7 days/yr
- Hot days in 30 yrs
- 23 days/yr
Wind risk 9/10 · Severe
- Chance of severe wind over 30 yrs
- 99.0%
Air-quality risk 3/10 · Minor
- Unhealthy air days now
- 2 days/yr
- Unhealthy air days in 30 yrs
- 4 days/yr
Risk factors via First Street. Map © Google.
Why this score? — see what drove the D grade
The composite is a weighted blend of 9 inputs, each scored 0–100. Each bar is that input's sub-score; the figure is the points it added to the 100-point composite (weight × sub-score).
- Cash flow +11.7/30.0
- ARV discount +7.8/15.0
- Schools +4.2/10.0
- 1% rule +3.9/10.0
- Rent growth +3.5/5.0
- Livability +3.5/5.0
- DSCR +3.4/10.0
- Condition / age +2.5/5.0
- Appreciation +0.0/10.0
$345,560
🖨 Deal sheet (PDF) 📄 Offer letter ✓ Due diligence
Listing remarks
One or more photo(s) has been virtually staged. Beautifully designed open floor plan perfect for modern living and entertaining. Boasting 4 spacious bedrooms and 2 full bathrooms, this home also includes a versatile flex space—ideal for a home office, playroom, or formal dining area to suit your lifestyle. The kitchen is a chef’s dream, complete with sleek quartz countertops, 42-inch cabinetry, and ample prep space for hosting or everyday meals. Retreat to the luxurious master suite, offering two oversized walk-in closets and a spa-inspired walk-in shower for ultimate comfort and convenience.
Key facts
- 6,960 sq ft lot
- 2 garage spots
- Community pool
Neighborhood map
What this means for you Summary
Snapshot
- This is a 4-bed/2.0-bath single-family listed at $346k.
Deal economics
- At list price, monthly cash flow is $-103 ($-1k/yr) — negative.
- To cash-flow at today's rent, offer at most $331k (4.3% below list).
- To meet the 1% rule (rent ≥ 1% of price), the offer needs to be $306k (11.4% below list).
- Recommended offer: $304k (12.0% below list) — sets the bar for market timing.
- Cap rate 5.9% vs local median 4.1% in Lady Lake — top-decile yield for the area; either an underpriced asset or a hidden risk that comps aren't pricing in. Stress-test before assuming the spread holds.
Location & tenants
- Location reads 69/100 on livability (#457 in FL) — a middle-class / working-renter tenant base. Strengths: cost of living A+, housing A+, health & safety A-; Watch: employment D, amenities F, commute F.
- Lake (suburban): math 49% / reading 50% proficiency, ranked #37 of 73 in FL (top 51%) — families likely to look elsewhere, expect single-tenant / working-renter base with shorter leases.
- Zoned schools: The Villages Elementary of Lady Lake School (math 63% / reading 61%, grade B, #608 of 2,144 statewide, top 29%, 761 students, 61% FRL); Carver Middle School (math 41% / reading 41%, grade F, #353 of 571 statewide, top 63%, 837 students, 65% FRL); Leesburg High School (math 24% / reading 32%, grade F, #464 of 667 statewide, top 70%, 1,641 students, 58% FRL).
- Market conditions: Rents rising fast (+4.0%/yr); 586 active listings in the ZIP; 2 comparable units currently listed for rent nearby; 4,799 units permitted in Lake County in 2024 (814 in 5+ unit buildings).
- At $3,063/mo this rent would consume 63% of the median local household income ($59k/yr) (locally 1047% of renters already pay >50% of income on rent) — very limited rent-growth headroom before tenants either downsize or default.
Forward outlook
- Local home prices are declining (-3.0%/yr); year-one equity from $2k of loan paydown is wiped out by about $10k of value loss. Plan a longer hold.
- Lake County population projected at +37% by 2050 — long-run rental-demand tailwind backs the buy-and-hold thesis.
Negotiation context
- It's been on market 135 days — a 12% lower offer ($304k) is reasonable based on typical stale-listing flexibility.
- 2 sale attempts; this cycle's ask has dropped $36k (9%) from the opening price — seller is motivated, your offer sets the floor, not the list.
Risks & watch-outs
- Climate carrying-cost: severe wind risk, 99% chance of damaging wind over 30y; moderate wildfire risk; extreme-heat days projected 7→23/yr by 2055 (HVAC capex compounding) — expect insurance premiums to compound above CPI over the hold.
Questions for the listing agent
- What do current leases actually rent for vs. the listed asking? Can we see a recent rent roll and the last 12 months of T-12 income?
- It's been on market 135 days. Have you received any prior offers? Is the seller open to a 12% concession, seller financing, or rate buy-down credit?
- What does the HOA fee cover, when was the last increase, and are there any pending special assessments or reserve-fund shortfalls?
- Why hasn't it sold? Are there any deal-killer items the seller is aware of (foundation, flood, title, zoning, code violations)?
- Is there a deadline driving the sale (1031 exchange, divorce, estate, relocation)? That informs how much negotiation room exists.
- Schools are B-rated — typically a magnet for longer-tenancy family renters. What's the average tenant stay here, and is there a school-zone premium baked into asking?
- The area grade is low — what's the realistic commute time and amenity access for the typical tenant pool here? Any planned neighborhood developments (good or bad) we should know about?
- What's the average days-on-market for RENTAL listings here right now (not sales)? A rising rental-DOM trend means longer vacancies and softer asking-rent achievability than the comps imply.
- What's the recent tenant-quality profile in this submarket — average credit score on applications, eviction rate, late-payment / NSF rate, and stable-employment percentage? A property-management company in the area should have these aggregated.
- How much new for-sale + rental construction is in the pipeline within 1–3 miles? Heavy new supply typically softens prices + rents 12–24 months out; constrained supply supports both.
Investment metrics
- 1% rule
- 0.89% ✗
- Cap rate
- 5.94%
- Cash-on-cash
- -1.27%
- DSCR
- 0.94
- GRM
- 9.4
CMA / ARV
- ARV (on-the-fly)
- $348,150
- Comps found
- 9
Show comp detail 9 sales within ~0.75 mi
| Address | Dist | Beds/Ba | Sqft | Sold | Price | $/sf | Match |
|---|---|---|---|---|---|---|---|
| 998 Swamp Chestnut Loop | 0.09mi | 4/3.0 | 2,110 (0%) | 2mo | $322,990 | $153 | 90 |
| 708 Sunshower Dr | 0.30mi | 4/2.0 | 2,110 (0%) | 9mo | $416,143 | $197 | 79 |
| 744 Sunshower Dr | 0.30mi | 4/2.5 | 1,938 (-8%) | 1mo | $312,990 | $162 | 70 |
| 858 Sunshower Dr | 0.17mi | 3/2.5 (-1) | 2,281 (+8%) | 4mo | $299,990 | $132 | 68 |
| 862 Sunshower Dr | 0.17mi | 4/3.0 | 2,417 (+14%) | 0mo | $312,990 | $129 | 64 |
| 716 Sunshower Dr | 0.45mi | 4/3.0 | 2,417 (+14%) | 9mo | $399,000 | $165 | 43 |
| 1509 Trenton Ln | 0.75mi | 3/2.0 (-1) | 1,989 (-6%) | 11mo | $499,000 | $251 | 42 |
| 349 Pacolet Ter | 0.71mi | 3/2.5 (-1) | 2,043 (-3%) | 20mo | $495,000 | $242 | 38 |
| 367 Troy Loop | 0.75mi | 3/2.0 (-1) | 1,835 (-13%) | 6mo | $399,900 | $218 | 33 |
Match score weights: distance 35% · size 25% · config 20% · recency 20%. Top-matched comps best support the ARV.
Projected returns pro-forma
-3.0% appreciation · 4.03% rent growth · sell at horizon
- IRR
- -17.1%
- Equity multiple
- 0.39×
- Total profit
- $-59,194
- Equity at exit
- $51,524
- IRR
- -7.1%
- Equity multiple
- 0.52×
- Total profit
- $-45,999
- Equity at exit
- $29,878
Cash invested: $96,757 (down + closing). Projections, not guarantees.
Landlord ↔ Tenant lean methodology
- Overall (STATE)
- 87 Strongly Landlord-Friendly
- State Florida
- 87 Strongly Landlord-Friendly · R+3
- County
- — inherits STATE
- City
- — inherits STATE
ZIP-level market 32159
- Home prices YoY
- -16.0%
- Rents YoY
- 4.0%
- Active inventory
- 586
- Price-to-rent
- 9.4×
Monthly cashflow live
- Estimated rent
- $3,063 medium interval (Pro) →
- Mortgage (P&I)
- −$1,812
- Tax est. 1.5%
- −$432 /mo · $5,183/yr
- Insurance
- −$144
- HOA
- −$134
- Vacancy / Maint / Mgmt
- −$643
- Net cashflow
- $-103
Break-even live
Sensitivity live
| Price | -10% $136 | -5% $17 | +0% $-103 | +5% $-222 | +10% $-341 |
|---|---|---|---|---|---|
| Rent | -10% $-345 | -5% $-224 | +0% $-103 | +5% $18 | +10% $139 |
| Rate | -1.0pp $71 | -0.5pp $-15 | base $-103 | +0.5pp $-192 | +1.0pp $-283 |
UW: 25.0% down · 7.5% · 30yr · 1.5% tax · 5.0% vac · 8.0% maint · 8.0% mgmt
Financing live
Cash to close
- Down payment
- $86,390
- Closing costs
- $10,367
- Reserves months
- —
- Total cash needed
- —
Loan-product check · same deal, 3 products live
Conventional
25% down · 7.5% · 30yr
- Down + closing
- —
- Monthly P&I
- —
- Monthly cashflow
- —
- DSCR
- —
- Eligible?
- —
Personal DTI + credit; lowest rate.
DSCR
20% down · 8.5% · 30yr
- Down + closing
- —
- Monthly P&I
- —
- Monthly cashflow
- —
- DSCR
- —
- Eligible?
- —
No personal income docs; deal must DSCR.
Hard money
10% down · 12.0% · 12mo
- Down + closing
- —
- Monthly P&I
- —
- Monthly cashflow
- —
- DSCR
- —
- Eligible?
- —
Short-term bridge; refi at stabilization.
Rent comps 2 comps
| Address | Beds | Baths | Sqft | Rent | $/sqft | DOM | Units | Dist |
|---|---|---|---|---|---|---|---|---|
| 1220 Turtle Island Rd Lady Lake, FL | 3.0 | 2.0 | 1504 | $2,000 | $1.33 | 25d | 1 | 0.85mi |
| 2111 Jem Path The Villages, FL | 3.0 | 2.0 | 2000 | $5,800 | $2.90 | 23d | 1 | 1.48mi |
HOA detail
- Monthly dues
- $134 · $1,608/yr
Listing history 8 events
-
2026-03-28status Pending
-
2026-03-27status Active
-
2026-03-27price $345,560
-
2026-03-27status Pending
-
2026-03-16price $365,990
-
2026-02-09price $377,990
-
2025-11-22price $374,990
-
2025-11-13$381,659 Active
ⓘ Source: listings_history table (triggers on properties + properties_extension) + one-shot
backfill from property_details.listing_events for pre-trigger history.
Climate risk First Street
- Flood 4/10 Moderate FEMA zone X (unshaded) · 20% chance over 30 yrs
- Wildfire 5/10 Major
- Heat 9/10 Extreme 7 d/yr ≥108°F today · 23 d/yr by 30 yrs out
- Wind 9/10 Extreme 99% chance of damaging wind over 30 yrs
- Air quality 3/10 Moderate 2 unhealthy d/yr today · 4 by 30 yrs out
Nearby sold comps map
Loading sold comps map…
Walkable amenities ~0.75 mi
Loading nearby amenities…
Taxation est. · year 1
- Rental income
- $36,752
- − Mortgage interest
- −$19,357
- − Property taxes
- −$5,183
- − Insurance
- −$1,728
- − Repairs & maintenance
- −$2,940
- − Management
- −$2,940
- − HOA
- −$1,608
- − Depreciation
- −$10,053
- Taxable loss
- −$7,057
- Est. tax savings @ 24.0%
- +$1,694
- After-tax cash flow
- $463/yr
For passive investors: Depreciation is non-cash, so a rental often shows a tax loss while cash-flowing — sheltering income. Rental losses are passive: they offset passive income freely, and up to $25,000/yr can offset ordinary (W-2) income if you actively participate and your MAGI is under $100k (phasing out to $0 by $150k); unused losses carry forward. On sale, claimed depreciation is recaptured at up to 25%, and gains may owe capital-gains tax (a 1031 exchange can defer both). Figures are a year-1 estimate at your 24.0% rate — not tax advice; consult a CPA.
Schools (NCES district)
- District
- Lake
- NCES district ID
- 1201050
- Math proficiency
- 49% ▼ -7.00%
- Reading proficiency
- 50% ▼ -4.00%
- Median HH income
- $46,632
- Composite
- 42.05/100
- National rank
- #3327
- State rank
- #37 of 73 in FL
Livability — Lady Lake
- Score
- 69/100
- State rank
- #457
- US rank
- #8302
Category grades
Schools grade is shown separately in the Schools card above.
Census & demographics
- Census place
- Lady Lake, FL
- County
- Lake County · 364,602 people
- City population
- 32,107
- Metro
- Orlando-Kissimmee-Sanford, FL
- Population (ZIP)
- 32,107
- Household income
- $58,518
- Rent vs Own
- Severe rent burden
- 1047.0
Population outlook (Lake County) Hauer SSP2
- Today (2025)
- 386,640 people
- By 2030
- 417,107 · +7.9%
- By 2040
- 476,676 · +23.3%
- By 2050
- 531,296 · +37.4%
- By 2075
- 648,303 · +67.7%
- By 2100
- 698,530 · +80.7%
Race, ethnicity, and origin ACS 2023
- Neighborhood character
- Predominantly White (86%)
- Race & ethnicity
- White 86% Hispanic / Latino 6% Two or more races 5% Black 4% Asian 1%
- Hispanic origin (detail)
- Puerto Rican 3%
- Common ancestry
- Romanian 4% Lithuanian 3% Slovak 3%
- Foreign-born
- 5% · Canada, Jamaica
- Languages at home
- 93% English-only · Spanish 4% German/W. Germanic 1% Other Indo-European 1%
Political lean MEDSL · Lake
- 2024 margin
- Strong R (+24.7) · D 37.3% · R 62.0%
- 2008→2024 swing
- -11.2pp toward R · 2008: -13.5pp · 2024: -24.7pp
- All cycles
- 2024: R+24.7 2020: R+20.0 2016: R+23.1 2012: R+17.1 2008: R+13.5
Not yet ingested
- Civics
- —
Market trends
- HPI YoY
- ▼ -45.24%
- Current HPI
- 237.6208
- Rent YoY
- ▲ 4.03%
- Metro
- Orlando-Kissimmee-Sanford, FL
- State GDP YoY
- ▲ 3.28%
- F500 in state
- 36
Industry mix (Fortune 500 HQ in FL)
| Industry | F500 HQs | Revenue |
|---|---|---|
| Industrial Technology | 2 | $29B |
|
||
| Insurance | 2 | $17B |
|
||
| Retail | 1 | $60B |
|
||
| Technology Distribution | 1 | $58B |
|
||
| Homebuilding | 1 | $35B |
|
||
| Technology Manufacturing | 1 | $35B |
|
||
Price history
-9.5% since first listed8 events — show timeline
- 2026-03-28 Pending — Stellar MLS as Distributed by MLS Grid
- 2026-03-27 Relisted — Stellar MLS as Distributed by MLS Grid
- 2026-03-27 Price Changed $345,560 Stellar MLS as Distributed by MLS Grid
- 2026-03-27 Pending — Stellar MLS as Distributed by MLS Grid
- 2026-03-16 Price Changed $365,990 Stellar MLS as Distributed by MLS Grid
- 2026-02-09 Price Changed $377,990 Stellar MLS as Distributed by MLS Grid
- 2025-11-22 Price Changed $374,990 Stellar MLS as Distributed by MLS Grid
- 2025-11-13 Listed $381,659 Stellar MLS as Distributed by MLS Grid
Cash-flow waterfall
monthlySold comps — $/sqft
last 12 mo · ≤1 miLoading sold comps…