2115 62nd St · Lubbock, TX
Flood risk 6/10 · Moderate
- FEMA flood zone
- X (shaded)
- Chance of flooding over 30 yrs
- 0.71%
- Est. flood insurance / yr
- $507 – $1,088
Fire risk 1/10 · Minimal
- Est. fire insurance / yr
- $1,222 – $2,270
Heat risk 5/10 · Moderate
- Hot days now (above 99°F)
- 7 days/yr
- Hot days in 30 yrs
- 21 days/yr
Wind risk 2/10 · Minimal
- Chance of severe wind over 30 yrs
- —
Air-quality risk 2/10 · Minimal
- Unhealthy air days now
- 1 days/yr
- Unhealthy air days in 30 yrs
- 1 days/yr
Risk factors via First Street. Map © Google.
Why this score? — see what drove the D- grade
The composite is a weighted blend of 9 inputs, each scored 0–100. Each bar is that input's sub-score; the figure is the points it added to the 100-point composite (weight × sub-score).
- ARV discount +10.8/15.0
- Cash flow +8.6/30.0
- Livability +4.0/5.0
- Rent growth +3.5/5.0
- 1% rule +3.1/10.0
- Schools +3.1/10.0
- Condition / age +2.5/5.0
- DSCR +2.4/10.0
- Appreciation +0.0/10.0
$200,000
🖨 Deal sheet (PDF) 📄 Offer letter ✓ Due diligence
Listing remarks MLS
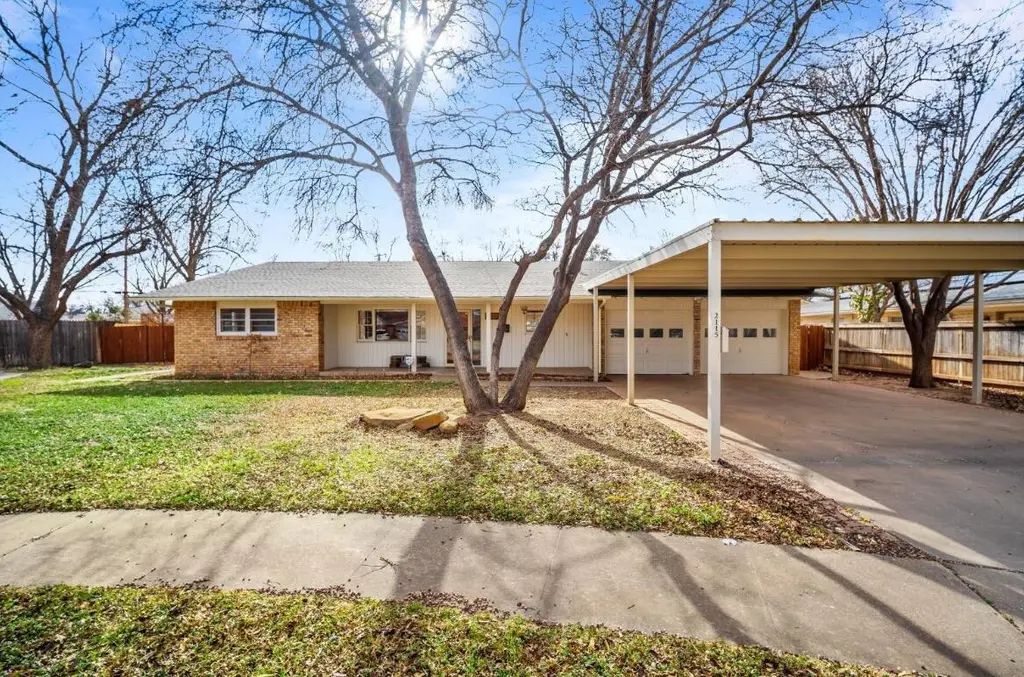
Discover this spacious 3 bedroom, 2 bath, 2 garage home with quick access to the South Loop! Tucked away in a quiet cul de sac, this charming property is ready for you to make it your own. With 2,174 square feet of living space, the home offers generous room to grow and live comfortably. Enjoy ample parking with both a 2 car garage and an additional 2 car carport. The large lot features a welcoming patio, a handy storage shed, and a newly stained fence—perfect for outdoor relaxation or weekend projects. Full of potential, this home is an excellent opportunity for homeowners, students, or investors. Schedule your showing today and see how this great house can become your next home!
Key facts
- Welcoming patio
- Quiet cul de sac
- Handy storage shed
Tags
Neighborhood map
What this means for you Summary
Snapshot
- This is a 3-bed/2.0-bath single-family listed at $200k.
Deal economics
- At list price, monthly cash flow is $-173 ($-2k/yr) — negative.
- To cash-flow at today's rent, offer at most $169k (15.3% below list).
- To meet the 1% rule (rent ≥ 1% of price), the offer needs to be $161k (19.5% below list).
- Recommended offer: $161k (19.5% below list) — sets the bar for 1% rule.
Location & tenants
- Location reads 80/100 on livability (#37 in TX, #1,749 nationally) — a professional / high-income tenant draw. Strengths: commute A+, cost of living A+, housing A+; Watch: employment C-, crime F.
- Lubbock ISD (urban): math 36% / reading 39% proficiency, ranked #481 of 826 in TX (top 58%) — families likely to look elsewhere, expect single-tenant / working-renter base with shorter leases; 60% free/reduced lunch — lower-income household profile, screen leases tightly.
- Zoned schools: Bayless El (math 47% / reading 33%, grade F, #1,514 of 4,322 statewide, top 36%, 518 students, 94% FRL); Atkins Middle (math 24% / reading 33%, grade F, #1,122 of 1,662 statewide, top 69%, 542 students, 87% FRL); Monterey H S (math 28% / reading 37%, grade F, #1,029 of 1,632 statewide, top 64%, 2,114 students, 72% FRL) — zoned schools average 84% FRL vs 60% district-wide (24 pts higher); higher-poverty schools than district average — tighter screening recommended.
- Market conditions: Rents rising (+3.9%/yr); 110 active listings in the ZIP; 25 comparable units currently listed for rent nearby; rentals lingering (median 46d on market — plan ~5-8 weeks vacancy on turnover, expect pricing pressure); 52% of comp listings sitting > 30 days — soft ceiling on asking rent; 2,219 units permitted in Lubbock County in 2024 (252 in 5+ unit buildings).
- This rent runs 40% of the median local income ($49k/yr) — at the standard rent-burdened threshold; future hikes will face affordability resistance.
Forward outlook
- Local home prices are declining (-3.0%/yr); year-one equity from $1k of loan paydown is wiped out by about $6k of value loss. Plan a longer hold.
- Lubbock County population projected at +39% by 2050 — long-run rental-demand tailwind backs the buy-and-hold thesis.
Negotiation context
- It's been on market 121 days — a 12% lower offer ($176k) is reasonable based on typical stale-listing flexibility.
- 2 sale attempts since 3y ago; this cycle's ask has dropped $17k (8%) from the opening price — seller is motivated, your offer sets the floor, not the list.
Risks & watch-outs
- Climate carrying-cost: major flood risk; extreme-heat days projected 7→21/yr by 2055 (HVAC capex compounding) — expect insurance premiums to compound above CPI over the hold.
Questions for the listing agent
- What do current leases actually rent for vs. the listed asking? Can we see a recent rent roll and the last 12 months of T-12 income?
- It's been on market 121 days. Have you received any prior offers? Is the seller open to a 19% concession, seller financing, or rate buy-down credit?
- Built in 1962 — when were the roof, HVAC, electrical panel, plumbing, and water heater last replaced?
- Why hasn't it sold? Are there any deal-killer items the seller is aware of (foundation, flood, title, zoning, code violations)?
- Is there a deadline driving the sale (1031 exchange, divorce, estate, relocation)? That informs how much negotiation room exists.
- Schools are D-rated, which usually means shorter tenancies and higher turnover. Who's the typical renter profile here, and what's been the actual vacancy rate?
- Crime grade is F in this area — have there been break-ins, vandalism, or insurance claims at this property in the last 3 years? What carrier currently insures it and at what premium?
- The area grade is low — what's the realistic commute time and amenity access for the typical tenant pool here? Any planned neighborhood developments (good or bad) we should know about?
- What's the average days-on-market for RENTAL listings here right now (not sales)? A rising rental-DOM trend means longer vacancies and softer asking-rent achievability than the comps imply.
- What's the recent tenant-quality profile in this submarket — average credit score on applications, eviction rate, late-payment / NSF rate, and stable-employment percentage? A property-management company in the area should have these aggregated.
- How much new for-sale + rental construction is in the pipeline within 1–3 miles? Heavy new supply typically softens prices + rents 12–24 months out; constrained supply supports both.
Investment metrics
- 1% rule
- 0.81% ✗
- Cap rate
- 5.26%
- Cash-on-cash
- -3.70%
- DSCR
- 0.84
- GRM
- 10.4
CMA / ARV
- ARV (median comp)
- $215,985
- List price
- $200,000
- Delta
- -7.40%
- Verdict
- FAIR
- Comps
- 3 within 2.0 mi
Projected returns pro-forma
-3.0% appreciation · 3.87% rent growth · sell at horizon
- IRR
- -21.5%
- Equity multiple
- 0.25×
- Total profit
- $-41,921
- Equity at exit
- $29,821
- IRR
- -13.0%
- Equity multiple
- 0.21×
- Total profit
- $-44,472
- Equity at exit
- $17,292
Cash invested: $56,000 (down + closing). Projections, not guarantees.
Landlord ↔ Tenant lean methodology
- Overall (STATE)
- 87 Strongly Landlord-Friendly
- State Texas
- 87 Strongly Landlord-Friendly · R+5
- County
- — inherits STATE
- City
- — inherits STATE
ZIP-level market 79412
- Home prices YoY
- -15.3%
- Rents YoY
- 3.9%
- Active inventory
- 110
- Price-to-rent
- 10.4×
Monthly cashflow live
- Estimated rent
- $1,610 high interval (Pro) →
- Mortgage (P&I)
- −$1,049
- Tax from tax record
- −$313 /mo · $3,751/yr
- Insurance
- −$83
- HOA
- −$0
- Vacancy / Maint / Mgmt
- −$338
- Net cashflow
- $-173
Break-even live
Sensitivity live
| Price | -10% $-59 | -5% $-116 | +0% $-173 | +5% $-229 | +10% $-286 |
|---|---|---|---|---|---|
| Rent | -10% $-300 | -5% $-236 | +0% $-173 | +5% $-109 | +10% $-45 |
| Rate | -1.0pp $-72 | -0.5pp $-122 | base $-173 | +0.5pp $-224 | +1.0pp $-277 |
UW: 25.0% down · 7.5% · 30yr · 1.5% tax · 5.0% vac · 8.0% maint · 8.0% mgmt
Financing live
Cash to close
- Down payment
- $50,000
- Closing costs
- $6,000
- Reserves months
- —
- Total cash needed
- —
Loan-product check · same deal, 3 products live
Conventional
25% down · 7.5% · 30yr
- Down + closing
- —
- Monthly P&I
- —
- Monthly cashflow
- —
- DSCR
- —
- Eligible?
- —
Personal DTI + credit; lowest rate.
DSCR
20% down · 8.5% · 30yr
- Down + closing
- —
- Monthly P&I
- —
- Monthly cashflow
- —
- DSCR
- —
- Eligible?
- —
No personal income docs; deal must DSCR.
Hard money
10% down · 12.0% · 12mo
- Down + closing
- —
- Monthly P&I
- —
- Monthly cashflow
- —
- DSCR
- —
- Eligible?
- —
Short-term bridge; refi at stabilization.
Rent comps 25 comps
| Address | Beds | Baths | Sqft | Rent | $/sqft | DOM | Units | Dist |
|---|---|---|---|---|---|---|---|---|
| 2117 65th St Lubbock, TX | 3.0 | 2.0 | 2285 | $1,975 | $0.86 | 23d | 1 | 0.17mi |
| 2115 66th St Lubbock, TX | 4.0 | 2.0 | 2160 | $1,795 | $0.83 | 23d | 1 | 0.28mi |
| 2310 59th St Lubbock, TX | 3.0 | 2.5 | 2637 | $1,900 | $0.72 | 45d | 1 | 0.32mi |
| 2121 56th St Lubbock, TX | 3.0 | 2.0 | 2047 | $1,999 | $0.98 | 23d | 1 | 0.37mi |
| 1923 67th St Lubbock, TX | 4.0 | 2.0 | 1467 | $1,525 | $1.04 | 45d | 1 | 0.38mi |
| 1927 71st St Lubbock, TX | 4.0 | 2.0 | 1807 | $1,600 | $0.89 | 23d | 1 | 0.62mi |
| 7006 Avenue S Lubbock, TX | 4.0 | 2.0 | 1498 | $1,800 | $1.20 | 45d | 1 | 0.64mi |
| 2726 68th St Lubbock, TX | 4.0 | 2.0 | 1524 | $1,800 | $1.18 | 45d | 1 | 0.66mi |
| 2730 68th St Lubbock, TX | 4.0 | 3.0 | 2050 | $1,999 | $0.98 | 23d | 1 | 0.70mi |
| 7304 Avenue W Lubbock, TX | 3.0 | 2.0 | 1500 | $999 | $0.67 | 15d | 1 | 0.71mi |
| 2725 63rd St Unit FS Lubbock, TX | 3.0 | 2.0 | 1624 | $1,599 | $0.98 | 45d | 1 | 0.76mi |
| 7406 Waco Ave Unit C Lubbock, TX | 2.0 | 1.0 | 1831 | $750 | $0.41 | 45d | 1 | 0.83mi |
| 1816 75th St Lubbock, TX | 4.0 | 2.0 | 1516 | $2,000 | $1.32 | 23d | 1 | 0.84mi |
| 2107 48th St Lubbock, TX | 3.0 | 1.0 | 1956 | $1,200 | $0.61 | 45d | 1 | 0.86mi |
| 1923 76th St Lubbock, TX | 3.0 | 2.0 | 1622 | $1,699 | $1.05 | 45d | 1 | 0.87mi |
| 1915 76th St Lubbock, TX | 3.0 | 2.0 | 1911 | $1,550 | $0.81 | 15d | 1 | 0.88mi |
| 1940 77th St Lubbock, TX | 3.0 | 2.0 | 1700 | $1,500 | $0.88 | 45d | 1 | 0.88mi |
| 2823 54th St Lubbock, TX | 3.0 | 2.0 | 1725 | $1,825 | $1.06 | 45d | 1 | 1.02mi |
| 1625 79th Pl Lubbock, TX | 3.0 | 2.0 | 1541 | $1,650 | $1.07 | 46d | 1 | 1.18mi |
| 1718 43rd St Lubbock, TX | 4.0 | 2.0 | 1870 | $1,075 | $0.57 | 23d | 1 | 1.25mi |
| 3236 63rd St Lubbock, TX | 3.0 | 2.5 | 1818 | $1,524 | $0.84 | 15d | 1 | 1.32mi |
| 1115 80th St Unit A Lubbock, TX | 3.0 | 2.0 | 1443 | $1,250 | $0.87 | 45d | 1 | 1.40mi |
| 3107 75th St Unit B Lubbock, TX | 2.0 | 2.0 | 1400 | $1,250 | $0.89 | 23d | 1 | 1.41mi |
| 1113 80th St Unit A Lubbock, TX | 3.0 | 2.0 | 1443 | $1,250 | $0.87 | 45d | 1 | 1.41mi |
| 2609 41st St Lubbock, TX | 3.0 | 2.0 | 1469 | $1,550 | $1.06 | 23d | 1 | 1.43mi |
Listing history 25 events
-
2026-06-22days on market $200,000 Active 121 DOM
-
2026-06-18days on market $200,000 Active 118 DOM
-
2026-06-17days on market $200,000 Active 117 DOM
-
2026-06-16days on market $200,000 Active 116 DOM
-
2026-06-15days on market $200,000 Active 115 DOM
-
2026-06-14days on market $200,000 Active 113 DOM
-
2026-06-13days on market $200,000 Active 112 DOM
-
2026-06-10days on market $200,000 Active 110 DOM
-
2026-06-09days on market $200,000 Active 109 DOM
-
2026-06-08days on market $200,000 Active 108 DOM
-
2026-06-07days on market $200,000 Active 107 DOM
-
2026-06-05days on market $200,000 Active 104 DOM
-
2026-06-03days on market $200,000 Active 103 DOM
-
2026-06-02days on market $200,000 Active 102 DOM
-
2026-06-01days on market $200,000 Active 101 DOM
-
2026-05-31days on market $200,000 Active 100 DOM
-
2026-05-30days on market $200,000 Active 99 DOM
-
2026-05-06price $210,000 695-char remark
Show marketing remark (695 chars)
Discover this spacious 3 bedroom, 2 bath, 2 garage home with quick access to the South Loop! Tucked away in a quiet cul de sac, this charming property is ready for you to make it your own. With 2,174 square feet of living space, the home offers generous room to grow and live comfortably. Enjoy ample parking with both a 2 car garage and an additional 2 car carport. The large lot features a welcoming patio, a handy storage shed, and a newly stained fence—perfect for outdoor relaxation or weekend projects. Full of potential, this home is an excellent opportunity for homeowners, students, or investors. Schedule your showing today and see how this great house can become your next home!
-
2026-02-19$217,400 Active 695-char remark
Show marketing remark (695 chars)
Discover this spacious 3 bedroom, 2 bath, 2 garage home with quick access to the South Loop! Tucked away in a quiet cul de sac, this charming property is ready for you to make it your own. With 2,174 square feet of living space, the home offers generous room to grow and live comfortably. Enjoy ample parking with both a 2 car garage and an additional 2 car carport. The large lot features a welcoming patio, a handy storage shed, and a newly stained fence—perfect for outdoor relaxation or weekend projects. Full of potential, this home is an excellent opportunity for homeowners, students, or investors. Schedule your showing today and see how this great house can become your next home!
-
2023-04-03soldstatus
-
2023-03-31soldstatus Closed 525-char remark
Show marketing remark (525 chars)
Spacious 3/2/2 with South Loop access! This adorable home is tucked away in a cul-de-sac and ready for you to add your touch! With 3 large bedrooms, 2 bathrooms and 2174 square feet this home has room to grow! Extra parking is included with a 2 car garage plus a 2 car carport. This home is situated on a large lot with a nice patio, storage shed and newly stained fence. This house has tons of potential and would be great for homeowners, students or investors so make your appointment today to make this great house a home!
-
2023-02-22status Pending 525-char remark
Show marketing remark (525 chars)
Spacious 3/2/2 with South Loop access! This adorable home is tucked away in a cul-de-sac and ready for you to add your touch! With 3 large bedrooms, 2 bathrooms and 2174 square feet this home has room to grow! Extra parking is included with a 2 car garage plus a 2 car carport. This home is situated on a large lot with a nice patio, storage shed and newly stained fence. This house has tons of potential and would be great for homeowners, students or investors so make your appointment today to make this great house a home!
-
2023-02-03$195,000 Active 525-char remark
Show marketing remark (525 chars)
Spacious 3/2/2 with South Loop access! This adorable home is tucked away in a cul-de-sac and ready for you to add your touch! With 3 large bedrooms, 2 bathrooms and 2174 square feet this home has room to grow! Extra parking is included with a 2 car garage plus a 2 car carport. This home is situated on a large lot with a nice patio, storage shed and newly stained fence. This house has tons of potential and would be great for homeowners, students or investors so make your appointment today to make this great house a home!
-
2013-08-12soldstatus
-
2012-07-16soldstatus
ⓘ Source: listings_history table (triggers on properties + properties_extension) + one-shot
backfill from property_details.listing_events for pre-trigger history.
Tax reassessment forecast TX · Resets to sale price
- Current annual tax
- $3,751 · $313/mo
- Projected year-2 tax
- $3,751 · $313/mo
- Expected delta
- $0/yr ($0/mo · 0.0%)
ⓘ Screening estimate from a state-policy table — verify with the county assessor before closing.
Climate risk First Street
- Flood 6/10 Major FEMA zone X (shaded) · 71% chance over 30 yrs
- Wildfire 1/10 Low
- Heat 5/10 Major 7 d/yr ≥99°F today · 21 d/yr by 30 yrs out
- Wind 2/10 Low
- Air quality 2/10 Low 1 unhealthy d/yr today · 1 by 30 yrs out
Nearby sold comps map
Loading sold comps map…
Walkable amenities ~0.75 mi
Loading nearby amenities…
Taxation est. · year 1
- Rental income
- $19,323
- − Mortgage interest
- −$11,203
- − Property taxes
- −$3,751
- − Insurance
- −$1,000
- − Repairs & maintenance
- −$1,546
- − Management
- −$1,546
- − Depreciation
- −$5,818
- Taxable loss
- −$5,541
- Est. tax savings @ 24.0%
- +$1,330
- After-tax cash flow
- $-742/yr
For passive investors: Depreciation is non-cash, so a rental often shows a tax loss while cash-flowing — sheltering income. Rental losses are passive: they offset passive income freely, and up to $25,000/yr can offset ordinary (W-2) income if you actively participate and your MAGI is under $100k (phasing out to $0 by $150k); unused losses carry forward. On sale, claimed depreciation is recaptured at up to 25%, and gains may owe capital-gains tax (a 1031 exchange can defer both). Figures are a year-1 estimate at your 24.0% rate — not tax advice; consult a CPA.
Schools (NCES district)
- District
- Lubbock ISD
- NCES district ID
- 4828500
- Math proficiency
- 36% ▼ -8.00%
- Reading proficiency
- 39% ▼ -1.00%
- Median HH income
- $39,820
- Composite
- 31.44/100
- National rank
- #5984
- State rank
- #481 of 826 in TX
Livability — Lubbock
- Score
- 80/100
- State rank
- #37
- US rank
- #1749
Category grades
Schools grade is shown separately in the Schools card above.
Census & demographics
- Census place
- Lubbock, TX
- County
- Lubbock County · 293,542 people
- City population
- 283,030
- Metro
- Lubbock, TX
- Population (ZIP)
- 15,018
- Household income
- $48,878
- Rent vs Own
- Severe rent burden
- 676.0
Population outlook (Lubbock County) Hauer SSP2
- Today (2025)
- 345,960 people
- By 2030
- 371,449 · +7.4%
- By 2040
- 424,539 · +22.7%
- By 2050
- 481,150 · +39.1%
- By 2075
- 633,467 · +83.1%
- By 2100
- 746,853 · +115.9%
Race, ethnicity, and origin ACS 2023
- Neighborhood character
- Diverse neighborhood (Simpson 0.56)
- Race & ethnicity
- Hispanic / Latino 61% Two or more races 25% White 25% Black 10%
- Hispanic origin (detail)
- Mexican 51% Puerto Rican 2%
- Common ancestry
- Lithuanian 1% Serbian 1% Italian 1%
- Foreign-born
- 5% · Canada
- Languages at home
- 67% English-only · Spanish 32% Arabic 1%
Political lean MEDSL · Lubbock
- 2024 margin
- Solid R (+39.5) · D 29.7% · R 69.2% · Other 1.0%
- 2008→2024 swing
- -2.8pp toward R · 2008: -36.7pp · 2024: -39.5pp
- All cycles
- 2024: R+39.5 2020: R+32.2 2016: R+38.4 2012: R+40.9 2008: R+36.7
Not yet ingested
- Civics
- —
Market trends
- HPI YoY
- ▼ -33.95%
- Current HPI
- 188.4033
- Rent YoY
- ▲ 3.87%
- Metro
- Lubbock, TX
- State GDP YoY
- ▲ 3.95%
- F500 in state
- 110
Industry mix (Fortune 500 HQ in TX)
| Industry | F500 HQs | Revenue |
|---|---|---|
| Energy | 16 | $1,198B |
|
||
| Technology | 5 | $198B |
|
||
| Engineering / Construction | 4 | $72B |
|
||
| Energy Services | 3 | $60B |
|
||
| Utilities | 3 | $41B |
|
||
| Healthcare | 2 | $330B |
|
||
Price history
+7.7% since first listed8 events — show timeline
- 2026-05-06 Price Changed $210,000 LARMLS
- 2026-02-19 Listed $217,400 LARMLS
- 2023-04-03 Sold (Public Records) — Public Records
- 2023-03-31 Sold (MLS) — LARMLS
- 2023-02-22 Pending — LARMLS
- 2023-02-03 Listed $195,000 LARMLS
- 2013-08-12 Sold (Public Records) — Public Records
- 2012-07-16 Sold (Public Records) — Public Records
Property tax history
+3.5%/yrLatest (2025): $3,751 · -4.9% YoY. Source: county tax records.
Cash-flow waterfall
monthlySold comps — $/sqft
last 12 mo · ≤1 miLoading sold comps…