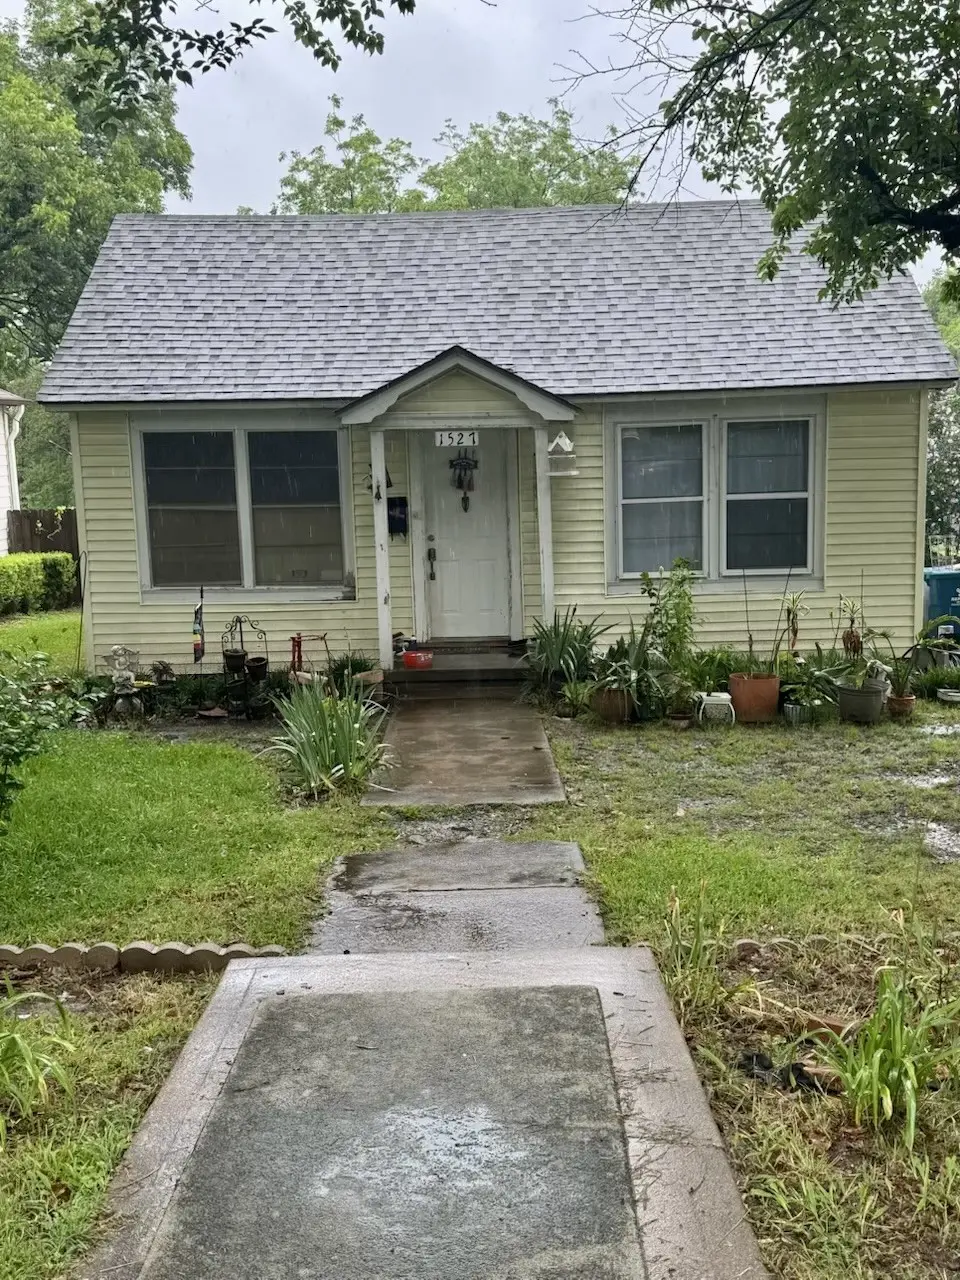
1527 W Gandy St · Denison, TX
Flood risk 1/10 · Minimal
- FEMA flood zone
- X (unshaded)
- Chance of flooding over 30 yrs
- 0.0%
- Est. flood insurance / yr
- $507 – $1,088
Fire risk 4/10 · Minor
- Est. fire insurance / yr
- $1,222 – $2,270
Heat risk 6/10 · Moderate
- Hot days now (above 109°F)
- 7 days/yr
- Hot days in 30 yrs
- 21 days/yr
Wind risk 4/10 · Minor
- Chance of severe wind over 30 yrs
- 20.0%
Air-quality risk 3/10 · Minor
- Unhealthy air days now
- 3 days/yr
- Unhealthy air days in 30 yrs
- 3 days/yr
Risk factors via First Street. Map © Google.
Why this score? — see what drove the B- grade
The composite is a weighted blend of 9 inputs, each scored 0–100. Each bar is that input's sub-score; the figure is the points it added to the 100-point composite (weight × sub-score).
- Cash flow +30.0/30.0
- 1% rule +10.0/10.0
- DSCR +10.0/10.0
- ARV discount +7.5/15.0
- Schools +3.7/10.0
- Livability +3.7/5.0
- Rent growth +2.5/5.0
- Condition / age +2.5/5.0
- Appreciation +0.0/10.0
$69,900
🖨 Deal sheet 📄 Offer letter ✓ Due diligence
Listing remarks
Opportunity awaits with this charming property full of character and potential. Featuring beautiful original oak flooring, a spacious storage barn/workshop, and several major system updates already completed including the roof, plumbing, and electrical. This home is ideal for an investor, flipper, or buyer looking to bring their vision to life. The property offers solid bones with room to update and customize the kitchen, bathroom, windows, and interior finishes to your taste. Some siding installation and pier and beam leveling may be needed, along with repairs from a previous roof leak that has already been addressed with the newer roof. Large storage building in the backyard provides addi
Key facts
- Major system updates
- Newer roof
- Storage barn
Tags
Property features AI
Finance
- Financial info: Lease not considered
Exterior
- Utilities: Public water; Public sewer
- Home design: Residential property; Built in 1945; Pillar/post/pier foundation; Composition roof
- Construction: Asbestos siding; Wood siding construction
- Exterior features: Subdivision lot
Interior
- Bedrooms: Primary bedroom on the first floor; Additional bedroom on the first floor
- Bathrooms: 1 full bathroom
- Heating & cooling: Central heating; Electric heating; Gas heating; Central air conditioning; Electric cooling
- Interior features: 2 total rooms
Neighborhood map
What this means for you Summary
Snapshot
- This is a 2-bed/1.0-bath single-family listed at $70k.
Deal economics
- At list price, monthly cash flow is $505 ($6k/yr) — positive.
- The deal already cash-flows at list — no discount required.
- Meets the 1% rule at list price ($1k rent vs $70k).
- Cap rate 15.0% vs local median 3.8% in Denison — top-decile yield for the area; either an underpriced asset or a hidden risk that comps aren't pricing in. Stress-test before assuming the spread holds.
Location & tenants
- Location reads 73/100 on livability (#221 in TX) — a middle-class / working-renter tenant base. Strengths: cost of living A+, housing A+, crime A; Watch: health & safety D+, amenities F, commute F.
- Denison ISD (urban): math 43% / reading 44% proficiency, ranked #315 of 826 in TX (top 38%) — families likely to look elsewhere, expect single-tenant / working-renter base with shorter leases.
- Zoned schools: Denison H S (math 53% / reading 53%, grade C-, #437 of 1,632 statewide, top 27%, 1,310 students, 58% FRL) — zoned schools at 58% FRL track the district average.
- Market conditions: Rents flat; 485 active listings in the ZIP; 40 comparable units currently listed for rent nearby; rentals lingering (median 44d on market — plan ~5-8 weeks vacancy on turnover, expect pricing pressure); 60% of comp listings sitting > 30 days — soft ceiling on asking rent; 2,272 units permitted in Grayson County in 2024 (750 in 5+ unit buildings).
Forward outlook
- Local home prices are declining (-3.0%/yr); year-one equity from $483 of loan paydown is wiped out by about $2k of value loss. Plan a longer hold.
- Grayson County population projected at +12% by 2050 — modest demand growth; plan on rents tracking national, not racing it.
- At projected returns (-3.0% appreciation + 0.1% rent growth), your $20k cash investment doubles in ~5 years — after that, you're playing with house money.
Negotiation context
- Only 7 days on market — expect competitive offers; lowballing is unlikely to land.
Risks & watch-outs
- Watch-outs: property tax is 3.2% of price; built in 1945 — expect roof / HVAC / electrical / plumbing capex.
- Climate carrying-cost: extreme-heat days projected 7→21/yr by 2055 (HVAC capex compounding) — expect insurance premiums to compound above CPI over the hold.
Questions for the listing agent
- Built in 1945 — when were the roof, HVAC, electrical panel, plumbing, and water heater last replaced?
- Property tax is high relative to price — has the assessment been appealed recently, and will the sale trigger a re-assessment?
- Is there a deadline driving the sale (1031 exchange, divorce, estate, relocation)? That informs how much negotiation room exists.
- Schools are D-rated, which usually means shorter tenancies and higher turnover. Who's the typical renter profile here, and what's been the actual vacancy rate?
- What's the average days-on-market for RENTAL listings here right now (not sales)? A rising rental-DOM trend means longer vacancies and softer asking-rent achievability than the comps imply.
- What's the recent tenant-quality profile in this submarket — average credit score on applications, eviction rate, late-payment / NSF rate, and stable-employment percentage? A property-management company in the area should have these aggregated.
- How much new for-sale + rental construction is in the pipeline within 1–3 miles? Heavy new supply typically softens prices + rents 12–24 months out; constrained supply supports both.
Investment metrics
- 1% rule
- 1.97% ✓
- Cap rate
- 14.96%
- Cash-on-cash
- 30.95%
- DSCR
- 2.38
- GRM
- 4.2
CMA / ARV
- ARV (on-the-fly)
- $157,920
- Comps found
- 12
Show comp detail 12 sales within ~0.75 mi
| Address | Dist | Beds/Ba | Sqft | Sold | Price | $/sf | Match |
|---|---|---|---|---|---|---|---|
| 1320 W Morton St | 0.23mi | 3/2.0 (+1) | 1,160 (+4%) | 4mo | $94,900 | $82 | 71 |
| 816 Leeper Dr | 0.48mi | 2/1.0 | 1,071 (-4%) | 2mo | $165,000 | $154 | 69 |
| 1231 W Main St | 0.30mi | 2/1.5 | 1,203 (+7%) | 4mo | $184,900 | $154 | 69 |
| 829 W Sears St | 0.64mi | 2/1.0 | 1,134 (+1%) | 3mo | $159,000 | $140 | 66 |
| 1231 W Woodard St | 0.28mi | 2/1.0 | 1,257 (+12%) | 2mo | $150,000 | $119 | 66 |
| 1612 W Bond St | 0.20mi | 2/2.0 | 1,273 (+14%) | 1mo | $200,000 | $157 | 63 |
| 1609 W Woodard St | 0.08mi | 3/2.0 (+1) | 1,288 (+15%) | 1mo | $239,900 | $186 | 61 |
| 1221 W Crawford St | 0.39mi | 3/1.0 (+1) | 1,032 (-8%) | 4mo | $145,000 | $141 | 60 |
| 917 W Sears St | 0.57mi | 3/1.0 (+1) | 1,197 (+7%) | 3mo | $99,900 | $83 | 55 |
| 811 W Woodard St | 0.67mi | 2/2.0 | 1,202 (+7%) | 0mo | $199,000 | $166 | 52 |
| 925 W Nelson St | 0.72mi | 3/2.0 (+1) | 1,168 (+4%) | 1mo | $87,500 | $75 | 50 |
| 1131 W Shepherd St | 0.65mi | 3/1.0 (+1) | 960 (-14%) | 2mo | $74,900 | $78 | 39 |
Match score weights: distance 35% · size 25% · config 20% · recency 20%. Top-matched comps best support the ARV.
Projected returns pro-forma
-3.0% appreciation · 0.05% rent growth · sell at horizon
- IRR
- 22.0%
- Equity multiple
- 1.87×
- Total profit
- $16,933
- Equity at exit
- $10,422
- IRR
- 27.9%
- Equity multiple
- 3.10×
- Total profit
- $41,120
- Equity at exit
- $6,044
Cash invested: $19,572 (down + closing). Projections, not guarantees.
Landlord ↔ Tenant lean methodology
- Overall (STATE)
- 87 Strongly Landlord-Friendly
- State Texas
- 87 Strongly Landlord-Friendly · R+5
- County
- — inherits STATE
- City
- — inherits STATE
ZIP-level market 75020
- Rents YoY
- 0.1%
- Active inventory
- 485
- Price-to-rent
- 4.2×
Monthly cashflow live
- Estimated rent
- $1,376 high interval (Pro) →
- Mortgage (P&I)
- −$367
- Tax from tax record
- −$187 /mo · $2,242/yr
- Insurance
- −$29
- HOA
- −$0
- Vacancy / Maint / Mgmt
- −$289
- Net cashflow
- $505
Break-even live
UW: 25.0% down · 7.5% · 30yr · 1.5% tax · 5.0% vac · 8.0% maint · 8.0% mgmt
Financing live
Cash to close
- Down payment
- $17,475
- Closing costs
- $2,097
- Reserves months
- —
- Total cash needed
- —
Loan-product check · same deal, 3 products live
Conventional
25% down · 7.5% · 30yr
- Down + closing
- —
- Monthly P&I
- —
- Monthly cashflow
- —
- DSCR
- —
- Eligible?
- —
Personal DTI + credit; lowest rate.
DSCR
20% down · 8.5% · 30yr
- Down + closing
- —
- Monthly P&I
- —
- Monthly cashflow
- —
- DSCR
- —
- Eligible?
- —
No personal income docs; deal must DSCR.
Hard money
10% down · 12.0% · 12mo
- Down + closing
- —
- Monthly P&I
- —
- Monthly cashflow
- —
- DSCR
- —
- Eligible?
- —
Short-term bridge; refi at stabilization.
Rent comps 40 comps
| Address | Beds | Baths | Sqft | Rent | $/sqft | DOM | Units | Dist |
|---|---|---|---|---|---|---|---|---|
| 1326 W Sears St Denison, TX | 2.0 | 1.0 | 1318 | $1,350 | $1.02 | 20d | 1 | 0.19mi |
| 108 N Eddy Ave Denison, TX | 1.0 | 1.0 | 882 | $1,100 | $1.25 | 43d | 1 | 0.27mi |
| 1231 W Main St Denison, TX | 2.0 | 1.5 | 1203 | $1,575 | $1.31 | 20d | 1 | 0.28mi |
| 1721 W Walker St Denison, TX | 2.0 | 1.0 | 1322 | $1,400 | $1.06 | 43d | 1 | 0.36mi |
| 1905 W Morton St #20 Denison, TX | 2.0 | 1.5 | 1008 | $1,250 | $1.24 | 43d | 1 | 0.41mi |
| 1602 W Elm St Denison, TX | 3.0 | 2.0 | 1141 | $1,495 | $1.31 | 43d | 1 | 0.44mi |
| 1131 W Owing St Denison, TX | 3.0 | 2.0 | 1135 | $1,695 | $1.49 | 43d | 1 | 0.46mi |
| 1016 W Gandy St #4 Denison, TX | 2.0 | 1.5 | 1000 | $1,100 | $1.10 | 43d | 1 | 0.46mi |
| 1703 W Elm St Denison, TX | 2.0 | 1.0 | 800 | $875 | $1.09 | 20d | 1 | 0.48mi |
| 1701 W Elm St Denison, TX | 2.0 | 1.0 | 800 | $900 | $1.12 | 20d | 1 | 0.48mi |
| 1004 W Gandy St Denison, TX | 3.0 | 1.0 | 1250 | $1,299 | $1.04 | 20d | 1 | 0.49mi |
| 1120 W Owing St Denison, TX | 3.0 | 2.0 | 1090 | $1,225 | $1.12 | 20d | 1 | 0.50mi |
| 1731 W Elm St Denison, TX | 3.0 | 2.0 | 1200 | $1,550 | $1.29 | 20d | 1 | 0.52mi |
| 1731 W Elm St Denison, TX | 3.0 | 2.0 | 1200 | $1,575 | $1.31 | 43d | 1 | 0.52mi |
| 1311 W Day St Denison, TX | 2.0 | 1.0 | 1188 | $1,050 | $0.88 | 20d | 1 | 0.64mi |
| 820 W Crawford St Denison, TX | 2.0 | 1.0 | 996 | $1,250 | $1.26 | 20d | 1 | 0.69mi |
| 817 W Owing St Denison, TX | 1.0 | 1.0 | 700 | $800 | $1.14 | 20d | 1 | 0.71mi |
| 731 W Morton St Denison, TX | 3.0 | 2.0 | 1298 | $1,500 | $1.16 | 43d | 1 | 0.72mi |
| 1022 W Shepherd St #1022 Denison, TX | 3.0 | 2.5 | 1322 | $1,450 | $1.10 | 20d | 1 | 0.72mi |
| 731 W Bond St Denison, TX | 3.0 | 2.0 | 1297 | $1,595 | $1.23 | 20d | 1 | 0.74mi |
| 102 Lum Ln Unit 101 Denison, TX | 3.0 | 2.0 | 1158 | $1,600 | $1.38 | 43d | 1 | 0.74mi |
| 715 W Chestnut St Denison, TX | 2.0 | 2.0 | 1273 | $1,300 | $1.02 | 43d | 1 | 0.76mi |
| 727 W Johnson St Unit A Denison, TX | 3.0 | 2.5 | 1238 | $1,450 | $1.17 | 43d | 1 | 0.80mi |
| 921 W Day St Denison, TX | 3.0 | 2.0 | 1212 | $1,500 | $1.24 | 43d | 1 | 0.81mi |
| 617 W Gandy St Unit 3 Denison, TX | 2.0 | 2.0 | 750 | $1,200 | $1.60 | 43d | 1 | 0.82mi |
| 626 W Chestnut St Denison, TX | 2.0 | 1.0 | 1132 | $1,300 | $1.15 | 20d | 1 | 0.83mi |
| 626 W Crawford St Unit 101 Denison, TX | 2.0 | 2.0 | 950 | $950 | $1.00 | 20d | 1 | 0.85mi |
| 1011 S Perry Ave Denison, TX | 2.0 | 2.0 | 1079 | $1,350 | $1.25 | 43d | 1 | 0.87mi |
| 610 W Owing St Denison, TX | 3.0 | 2.0 | 1108 | $1,395 | $1.26 | 43d | 1 | 0.90mi |
| 1829 Ridgewood Rd Denison, TX | 3.0 | 1.0 | 1040 | $1,100 | $1.06 | 43d | 1 | 0.90mi |
| 527 W Walker St Denison, TX | 3.0 | 2.0 | 1300 | $1,675 | $1.29 | 43d | 1 | 0.93mi |
| 613 W Elm St Unit 613 Denison, TX | 3.0 | 2.0 | 1375 | $1,525 | $1.11 | 44d | 1 | 0.95mi |
| 410 S Mirick Ave Denison, TX | 3.0 | 2.0 | 1100 | $1,300 | $1.18 | 43d | 1 | 0.96mi |
| 411 S Fannin Ave #411 Denison, TX | 3.0 | 2.5 | 1322 | $1,450 | $1.10 | 20d | 1 | 1.01mi |
| 1011 S Armstrong Ave Unit A Denison, TX | 2.0 | 1.0 | 1400 | $1,500 | $1.07 | 43d | 1 | 1.05mi |
| 818 W Texas St Denison, TX | 3.0 | 1.0 | 720 | $1,100 | $1.53 | 20d | 1 | 1.07mi |
| 1035-1033 Ray Dr Denison, TX | 3.0 | 3.0 | 1328 | $1,450 | $1.09 | 43d | 1 | 1.09mi |
| 320 W Bond St Denison, TX | 3.0 | 2.0 | 1278 | $1,500 | $1.17 | 44d | 1 | 1.09mi |
| 317 W Main St #203 Denison, TX | 1.0 | 1.0 | 1000 | $1,600 | $1.60 | 43d | 1 | 1.10mi |
| 317 W Main St Unit 202 Denison, TX | 1.0 | 1.0 | 1000 | $1,700 | $1.70 | 43d | 1 | 1.10mi |
Listing history 9 events
-
2026-06-05statusdays on market $69,900 Pending 7 DOM
-
2026-06-03days on market $69,900 Active 6 DOM
-
2026-06-02days on market $69,900 Active 5 DOM
-
2026-06-01days on market $69,900 Active 4 DOM
-
2026-05-31days on market $69,900 Active 3 DOM
-
2026-05-30days on market $69,900 Active 2 DOM
-
2026-05-28$69,900 Active
-
2007-01-18soldstatus
-
1960-01-15soldstatus
ⓘ Source: listings_history table (triggers on properties + properties_extension) + one-shot
backfill from property_details.listing_events for pre-trigger history.
Tax reassessment forecast TX · Resets to sale price
- Current annual tax
- $2,242 · $187/mo
- Projected year-2 tax
- $2,242 · $187/mo
- Expected delta
- $0/yr ($0/mo · 0.0%)
ⓘ Screening estimate from a state-policy table — verify with the county assessor before closing.
Climate risk First Street
- Flood 1/10 Low FEMA zone X (unshaded) · 0% chance over 30 yrs
- Wildfire 4/10 Moderate
- Heat 6/10 Major 7 d/yr ≥109°F today · 21 d/yr by 30 yrs out
- Wind 4/10 Moderate 20% chance of damaging wind over 30 yrs
- Air quality 3/10 Moderate 3 unhealthy d/yr today · 3 by 30 yrs out
Nearby sold comps map
Loading sold comps map…
Walkable amenities ~0.75 mi
Loading nearby amenities…
Taxation est. · year 1
- Rental income
- $16,515
- − Mortgage interest
- −$3,915
- − Property taxes
- −$2,242
- − Insurance
- −$350
- − Repairs & maintenance
- −$1,321
- − Management
- −$1,321
- − Depreciation
- −$2,033
- Taxable income
- $5,332
- Est. tax owed @ 24.0%
- −$1,280
- After-tax cash flow
- $4,777/yr
For passive investors: Depreciation is non-cash, so a rental often shows a tax loss while cash-flowing — sheltering income. Rental losses are passive: they offset passive income freely, and up to $25,000/yr can offset ordinary (W-2) income if you actively participate and your MAGI is under $100k (phasing out to $0 by $150k); unused losses carry forward. On sale, claimed depreciation is recaptured at up to 25%, and gains may owe capital-gains tax (a 1031 exchange can defer both). Figures are a year-1 estimate at your 24.0% rate — not tax advice; consult a CPA.
Schools (NCES district)
- District
- Denison ISD
- NCES district ID
- 4816710
- Math proficiency
- 43% ▼ -7.00%
- Reading proficiency
- 44% ▼ -3.00%
- Median HH income
- $41,650
- Composite
- 36.6/100
- National rank
- #4629
- State rank
- #315 of 826 in TX
Livability — Denison
- Score
- 73/100
- State rank
- #221
- US rank
- #5428
Category grades
Schools grade is shown separately in the Schools card above.
Census & demographics
- Census place
- Denison, TX
- County
- Grayson County · 108,053 people
- City population
- 34,008
- Metro
- Sherman-Denison, TX
- Population (ZIP)
- 24,835
- Household income
- $71,605
- Rent vs Own
- Severe rent burden
- 997.0
Population outlook (Grayson County) Hauer SSP2
- Today (2025)
- 134,540 people
- By 2030
- 138,653 · +3.1%
- By 2040
- 145,958 · +8.5%
- By 2050
- 151,218 · +12.4%
- By 2075
- 161,802 · +20.3%
- By 2100
- 159,036 · +18.2%
Race, ethnicity, and origin ACS 2023
- Neighborhood character
- Predominantly White (73%)
- Race & ethnicity
- White 73% Hispanic / Latino 13% Two or more races 9% Black 6%
- Hispanic origin (detail)
- Mexican 11%
- Common ancestry
- Slovak 5% Serbian 2% Portuguese 2%
- Foreign-born
- 4% · Canada
- Languages at home
- 93% English-only · Spanish 6%
Political lean MEDSL · Grayson
- 2024 margin
- Solid R (+54.3) · D 22.5% · R 76.7%
- 2008→2024 swing
- -16.4pp toward R · 2008: -37.9pp · 2024: -54.3pp
- All cycles
- 2024: R+54.3 2020: R+49.9 2016: R+53.1 2012: R+48.0 2008: R+37.9
Not yet ingested
- Civics
- —
Market trends
- HPI YoY
- ▼ -295.96%
- Current HPI
- 257.1806
- Rent YoY
- ▬ 0.05%
- Metro
- Sherman-Denison, TX
- State GDP YoY
- ▲ 3.95%
- F500 in state
- 110
Industry mix (Fortune 500 HQ in TX)
| Industry | F500 HQs | Revenue |
|---|---|---|
| Energy | 16 | $1,198B |
|
||
| Technology | 5 | $198B |
|
||
| Engineering / Construction | 4 | $72B |
|
||
| Energy Services | 3 | $60B |
|
||
| Utilities | 3 | $41B |
|
||
| Healthcare | 2 | $330B |
|
||
Price history
3 events — show timeline
- 2026-05-28 Listed $69,900 HARMLS
- 2007-01-18 Sold (Public Records) — Public Records
- 1960-01-15 Sold (Public Records) — Public Records
Property tax history
+5.1%/yrLatest (2025): $2,242 · +9.8% YoY. Source: county tax records.
Cash-flow waterfall
monthlySold comps — $/sqft
last 12 mo · ≤1 miLoading sold comps…