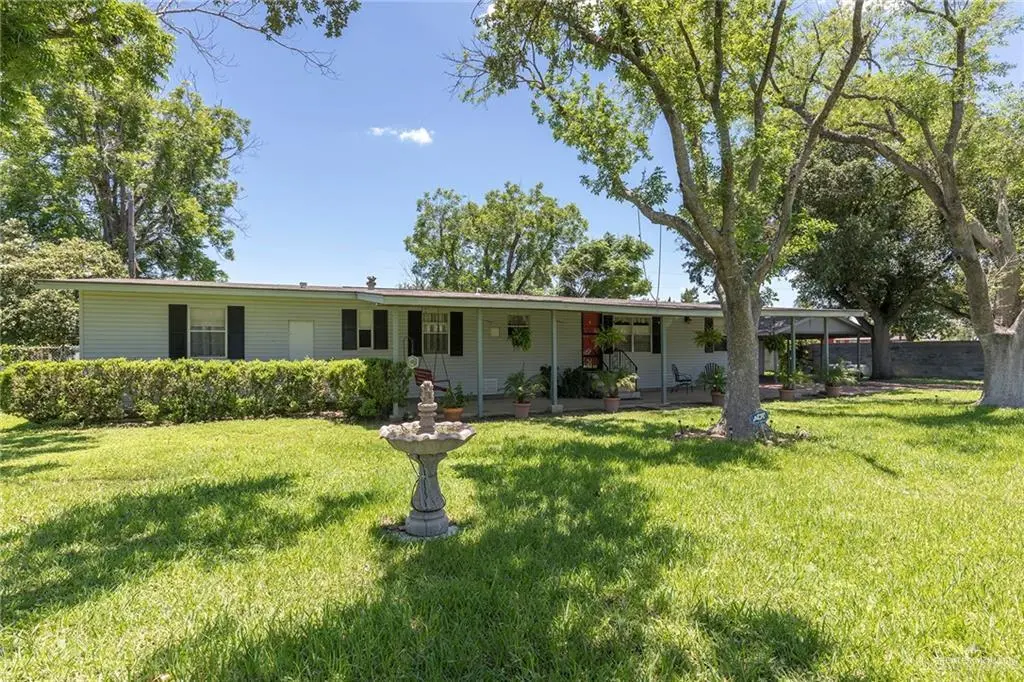
1624 Grovewood Rd · Palmhurst, TX
Flood risk 1/10 · Minimal
- FEMA flood zone
- X
- Chance of flooding over 30 yrs
- 0.0%
- Est. flood insurance / yr
- $507 – $1,088
Fire risk 5/10 · Moderate
- Est. fire insurance / yr
- $1,222 – $2,270
Heat risk 9/10 · Severe
- Hot days now (above 111°F)
- 7 days/yr
- Hot days in 30 yrs
- 20 days/yr
Wind risk 8/10 · Major
- Chance of severe wind over 30 yrs
- 99.0%
Air-quality risk 2/10 · Minimal
- Unhealthy air days now
- 1 days/yr
- Unhealthy air days in 30 yrs
- 2 days/yr
Risk factors via First Street. Map © Google.
Why this score? — see what drove the C grade
The composite is a weighted blend of 9 inputs, each scored 0–100. Each bar is that input's sub-score; the figure is the points it added to the 100-point composite (weight × sub-score).
- Cash flow +18.6/30.0
- Appreciation +10.0/10.0
- ARV discount +7.5/15.0
- DSCR +5.9/10.0
- 1% rule +4.7/10.0
- Schools +3.4/10.0
- Livability +3.2/5.0
- Rent growth +3.1/5.0
- Condition / age +2.5/5.0
$195,000
🖨 Deal sheet 📄 Offer letter ✓ Due diligence
Listing remarks
Welcome home to peaceful country-style living with all the space you've been looking for! Walk in and experience the large living and dining areas plus a home office and additional sun room area for entertaining! The rooms have ample space & pretty windows for lots of natural light. A great place to call your own! This charming property features spacious living areas, generously sized bedrooms, a bright kitchen with abundant cabinetry and a large screened-in porch perfect for enjoying the outdoors year-round. So much foliage and large Pecan trees with a cool Southeast breeze! Step outside and fall in love with the expansive yard shaded by mature trees, offering plenty of room for gard
Key facts
- Bright kitchen
- Expansive yard
- Sun room
Tags
Property features AI
Finance
- HOA & community: No association
Exterior
- Parking: Total of 3 parking spaces; Detached garage (1 garage space) with garage door opener, garage faces rear; Carport providing 2 covered spaces; 3 covered parking spaces total
- Security: Motorized gate
- Utilities: Public water; City sewer; Cable available; Paved road access
- Home design: Not new construction
- Construction: Siding exterior; Metal roof; Pillar/post/pier and slab foundation; Built on a 0.5-acre lot
- Exterior features: Mature trees; Motorized gate; Workshop / storage structure; Covered patio; Deck / balcony / porch; Patio slab; Screened patio
Interior
- Kitchen: Smooth electric cooktop / electric range; Dishwasher; Microwave; Refrigerator; Laminate countertops
- Bedrooms: Split bedrooms
- Flooring: Laminate flooring
- Bathrooms: One full bathroom; One half bathroom
- Heating & cooling: Central heating (electric); Central air conditioning (electric)
- Interior features: Laminate countertops; Bonus room; Ceiling fans; Office / study; Split-bedroom layout; Drapes on windows; Electric water heater (located separately); Smooth electric cooktop / electric range; Dishwasher; Microwave; Refrigerator; Washer and Dryer
- Laundry & utility: Laundry room; Washer; Dryer; Electric water heater
Neighborhood map
What this means for you Summary
Snapshot
- This is a 3-bed/2.0-bath manufactured listed at $195k.
Deal economics
- At list price, monthly cash flow is $189 ($2k/yr) — positive.
- The deal already cash-flows at list — no discount required.
- To meet the 1% rule (rent ≥ 1% of price), the offer needs to be $188k (3.4% below list).
- Recommended offer: $188k (3.4% below list) — sets the bar for 1% rule.
- Cap rate 7.5% vs local median 0.3% in Palmhurst — top-decile yield for the area; either an underpriced asset or a hidden risk that comps aren't pricing in. Stress-test before assuming the spread holds.
Location & tenants
- Location reads 63/100 on livability (#895 in TX) — a middle-class / working-renter tenant base. Strengths: housing A+, cost of living B+, employment B; Watch: crime C-, amenities F, commute F.
- Sharyland ISD (urban): math 34% / reading 44% proficiency, ranked #406 of 826 in TX (top 49%) — families likely to look elsewhere, expect single-tenant / working-renter base with shorter leases.
- Zoned schools: Jessie L Jensen El (math 12% / reading 22%, grade F, #3,836 of 4,322 statewide, top 91%, 543 students, 88% FRL); Sharyland North J H (math 46% / reading 42%, grade D, #512 of 1,662 statewide, top 32%, 806 students, 74% FRL) — zoned schools average 81% FRL vs 55% district-wide (26 pts higher); higher-poverty schools than district average — tighter screening recommended.
- Market conditions: Rents rising (+2.5%/yr); 623 active listings in the ZIP; 13 comparable units currently listed for rent nearby; rentals at typical pace (median 23d on market — plan ~3-4 weeks tenant-placement turnaround); 46% of comp listings sitting > 30 days — soft ceiling on asking rent; 7,378 units permitted in Hidalgo County in 2024 (641 in 5+ unit buildings).
- This rent runs 41% of the median local income ($55k/yr) — at the standard rent-burdened threshold; future hikes will face affordability resistance.
Forward outlook
- In year one you build about $21k of equity ($1k loan paydown + $20k appreciation (10.0% local appreciation)).
- Hidalgo County population projected at +28% by 2050 — long-run rental-demand tailwind backs the buy-and-hold thesis.
- At projected returns (10.0% appreciation + 2.5% rent growth), your $55k cash investment doubles in ~3 years — after that, you're playing with house money.
- By year 2, paydown + projected appreciation supports a ~$34k cash-out refi (75% LTV) — recoverable capital for the next deal without selling this one.
Negotiation context
- It's been on market 17 days — a 2% lower offer ($192k) is reasonable based on typical stale-listing flexibility.
Risks & watch-outs
- Climate carrying-cost: severe wind risk, 99% chance of damaging wind over 30y; moderate wildfire risk; extreme-heat days projected 7→20/yr by 2055 (HVAC capex compounding) — expect insurance premiums to compound above CPI over the hold.
Questions for the listing agent
- Is there a deadline driving the sale (1031 exchange, divorce, estate, relocation)? That informs how much negotiation room exists.
- What's the average days-on-market for RENTAL listings here right now (not sales)? A rising rental-DOM trend means longer vacancies and softer asking-rent achievability than the comps imply.
- What's the recent tenant-quality profile in this submarket — average credit score on applications, eviction rate, late-payment / NSF rate, and stable-employment percentage? A property-management company in the area should have these aggregated.
- How much new for-sale + rental construction is in the pipeline within 1–3 miles? Heavy new supply typically softens prices + rents 12–24 months out; constrained supply supports both.
Investment metrics
- 1% rule
- 0.97% ✗
- Cap rate
- 7.46%
- Cash-on-cash
- 4.16%
- DSCR
- 1.19
- GRM
- 8.6
CMA / ARV
No comps found within radius.
Projected returns pro-forma
10.0% appreciation · 2.45% rent growth · sell at horizon
- IRR
- 27.1%
- Equity multiple
- 3.15×
- Total profit
- $117,230
- Equity at exit
- $175,671
- IRR
- 23.5%
- Equity multiple
- 7.11×
- Total profit
- $333,673
- Equity at exit
- $378,842
Cash invested: $54,600 (down + closing). Projections, not guarantees.
Landlord ↔ Tenant lean methodology
- Overall (STATE)
- 87 Strongly Landlord-Friendly
- State Texas
- 87 Strongly Landlord-Friendly · R+5
- County
- — inherits STATE
- City
- — inherits STATE
ZIP-level market 78573
- Home prices YoY
- 8.0%
- Rents YoY
- 2.5%
- Active inventory
- 623
- Price-to-rent
- 8.6×
Monthly cashflow live
- Estimated rent
- $1,884 high interval (Pro) →
- Mortgage (P&I)
- −$1,023
- Tax from tax record
- −$195 /mo · $2,336/yr
- Insurance
- −$81
- HOA
- −$0
- Vacancy / Maint / Mgmt
- −$396
- Net cashflow
- $189
Break-even live
UW: 25.0% down · 7.5% · 30yr · 1.5% tax · 5.0% vac · 8.0% maint · 8.0% mgmt
Financing live
Cash to close
- Down payment
- $48,750
- Closing costs
- $5,850
- Reserves months
- —
- Total cash needed
- —
Loan-product check · same deal, 3 products live
Conventional
25% down · 7.5% · 30yr
- Down + closing
- —
- Monthly P&I
- —
- Monthly cashflow
- —
- DSCR
- —
- Eligible?
- —
Personal DTI + credit; lowest rate.
DSCR
20% down · 8.5% · 30yr
- Down + closing
- —
- Monthly P&I
- —
- Monthly cashflow
- —
- DSCR
- —
- Eligible?
- —
No personal income docs; deal must DSCR.
Hard money
10% down · 12.0% · 12mo
- Down + closing
- —
- Monthly P&I
- —
- Monthly cashflow
- —
- DSCR
- —
- Eligible?
- —
Short-term bridge; refi at stabilization.
Rent comps 13 comps
| Address | Beds | Baths | Sqft | Rent | $/sqft | DOM | Units | Dist |
|---|---|---|---|---|---|---|---|---|
| 2225 Dorado Dr Mission, TX | 3.0 | 2.5 | 1839 | $2,100 | $1.14 | 21d | 1 | 0.79mi |
| 2313 Dorado Dr Mission, TX | 3.0 | 2.5 | 1800 | $2,100 | $1.17 | 43d | 1 | 0.83mi |
| 2319 Dorado Dr Mission, TX | 3.0 | 2.5 | 1583 | $1,900 | $1.20 | 43d | 1 | 0.85mi |
| 1412 E 28th St Mission, TX | 4.0 | 3.0 | 2068 | $2,300 | $1.11 | 23d | 1 | 1.18mi |
| 3108 Highland Park Ave Mission, TX | 4.0 | 2.0 | 1400 | $1,800 | $1.29 | 18d | 1 | 1.23mi |
| 3401 N Mayberry Rd Mission, TX | 3.0 | 2.0 | 1150 | $961 | $0.84 | 43d | 1 | 1.31mi |
| 2516 Wisteria Dr Mission, TX | 4.0 | 3.0 | 2066 | $2,800 | $1.36 | 14d | 1 | 1.35mi |
| 2514 Yarrow St Mission, TX | 3.0 | 2.0 | 1682 | $2,700 | $1.61 | 23d | 1 | 1.38mi |
| 3104 E Kennedy Ave Alton, TX | 3.0 | 2.5 | 1642 | $2,600 | $1.58 | 43d | 1 | 1.38mi |
| 2609 May Ave Mission, TX | 3.0 | 2.0 | 1670 | $1,800 | $1.08 | 43d | 1 | 1.38mi |
| 1420 S Xanthia St Unit 6 Alton, TX | 3.0 | 2.0 | 1065 | $1,350 | $1.27 | 23d | 1 | 1.44mi |
| 1421 S Yankton St Unit 6 Alton, TX | 3.0 | 2.0 | 1065 | $1,350 | $1.27 | 23d | 1 | 1.45mi |
| 2111 E 25th St Mission, TX | 3.0 | 2.5 | 2239 | $2,000 | $0.89 | 43d | 1 | 1.49mi |
Listing history 12 events
-
2026-06-18days on market $195,000 Active 17 DOM
-
2026-06-17days on market $195,000 Active 16 DOM
-
2026-06-16days on market $195,000 Active 15 DOM
-
2026-06-15days on market $195,000 Active 14 DOM
-
2026-06-14days on market $195,000 Active 12 DOM
-
2026-06-10days on market $195,000 Active 9 DOM
-
2026-06-09days on market $195,000 Active 8 DOM
-
2026-06-08days on market $195,000 Active 7 DOM
-
2026-06-07days on market $195,000 Active 6 DOM
-
2026-06-03days on market $195,000 Active 2 DOM
-
2026-06-02remarks 695-char remark
-
2026-06-02$195,000 Active 1 DOM
ⓘ Source: listings_history table (triggers on properties + properties_extension) + one-shot
backfill from property_details.listing_events for pre-trigger history.
Tax reassessment forecast TX · Resets to sale price
- Current annual tax
- $2,336 · $195/mo
- Projected year-2 tax
- $3,568 · $297/mo
- Expected delta
- +$1,232/yr (+$103/mo · 52.8%)
ⓘ Screening estimate from a state-policy table — verify with the county assessor before closing.
Climate risk First Street
- Flood 1/10 Low FEMA zone X · 0% chance over 30 yrs
- Wildfire 5/10 Major
- Heat 9/10 Extreme 7 d/yr ≥111°F today · 20 d/yr by 30 yrs out
- Wind 8/10 Severe 99% chance of damaging wind over 30 yrs
- Air quality 2/10 Low 1 unhealthy d/yr today · 2 by 30 yrs out
Nearby sold comps map
Loading sold comps map…
Walkable amenities ~0.75 mi
Loading nearby amenities…
Taxation est. · year 1
- Rental income
- $22,602
- − Mortgage interest
- −$10,923
- − Property taxes
- −$2,336
- − Insurance
- −$975
- − Repairs & maintenance
- −$1,808
- − Management
- −$1,808
- − Depreciation
- −$5,673
- Taxable loss
- −$921
- Est. tax savings @ 24.0%
- +$221
- After-tax cash flow
- $2,494/yr
For passive investors: Depreciation is non-cash, so a rental often shows a tax loss while cash-flowing — sheltering income. Rental losses are passive: they offset passive income freely, and up to $25,000/yr can offset ordinary (W-2) income if you actively participate and your MAGI is under $100k (phasing out to $0 by $150k); unused losses carry forward. On sale, claimed depreciation is recaptured at up to 25%, and gains may owe capital-gains tax (a 1031 exchange can defer both). Figures are a year-1 estimate at your 24.0% rate — not tax advice; consult a CPA.
Schools (NCES district)
- District
- Sharyland ISD
- NCES district ID
- 4839930
- Math proficiency
- 34% ▼ -35.00%
- Reading proficiency
- 44% ▼ -15.00%
- Median HH income
- $57,792
- Composite
- 34.38/100
- National rank
- #5214
- State rank
- #406 of 826 in TX
Livability — Palmhurst
- Score
- 63/100
- State rank
- #895
- US rank
- #16053
Category grades
Schools grade is shown separately in the Schools card above.
Census & demographics
- Census place
- Palmhurst, TX
- County
- Hidalgo County · 623,128 people
- Metro
- McAllen-Edinburg-Mission, TX
- Population (ZIP)
- 44,809
- Household income
- $55,000
- Rent vs Own
- Severe rent burden
- 855.0
Population outlook (Hidalgo County) Hauer SSP2
- Today (2025)
- 955,232 people
- By 2030
- 1,009,774 · +5.7%
- By 2040
- 1,120,332 · +17.3%
- By 2050
- 1,225,036 · +28.2%
- By 2075
- 1,439,189 · +50.7%
- By 2100
- 1,533,429 · +60.5%
Race, ethnicity, and origin ACS 2023
- Neighborhood character
- Predominantly Hispanic (96%)
- Race & ethnicity
- Hispanic / Latino 96% Two or more races 63% White 3%
- Hispanic origin (detail)
- Mexican 94%
- Foreign-born
- 28% · Canada
- Languages at home
- 12% English-only · Spanish 88%
Political lean MEDSL · Hidalgo
- 2024 margin
- Toss-up / Even · D 48.1% · R 51.0%
- 2008→2024 swing
- -41.6pp toward R · 2008: 38.7pp · 2024: -2.9pp
- All cycles
- 2024: R+2.9 2020: D+17.1 2016: D+40.5 2012: D+41.8 2008: D+38.7
Not yet ingested
- Civics
- —
Market trends
- HPI YoY
- ▲ 17.95%
- Current HPI
- 242.0711
- Rent YoY
- ▲ 2.45%
- Metro
- McAllen-Edinburg-Mission, TX
- State GDP YoY
- ▲ 3.95%
- F500 in state
- 110
Industry mix (Fortune 500 HQ in TX)
| Industry | F500 HQs | Revenue |
|---|---|---|
| Energy | 16 | $1,198B |
|
||
| Technology | 5 | $198B |
|
||
| Engineering / Construction | 4 | $72B |
|
||
| Energy Services | 3 | $60B |
|
||
| Utilities | 3 | $41B |
|
||
| Healthcare | 2 | $330B |
|
||
Price history
1 event — show timeline
- 2026-06-01 Listed $195,000 MCALLENMLS
Property tax history
+7.2%/yrLatest (2025): $2,336 · +9.9% YoY. Source: county tax records.
Cash-flow waterfall
monthlySold comps — $/sqft
last 12 mo · ≤1 miLoading sold comps…