 Multi-family
700 E 8th St · Kansas City, MO
Flood risk 1/10 · Minimal
- FEMA flood zone
- X (unshaded)
- Chance of flooding over 30 yrs
- 0.0%
- Est. flood insurance / yr
- $507 – $1,088
Fire risk 1/10 · Minimal
- Est. fire insurance / yr
- $1,054 – $1,958
Heat risk 4/10 · Minor
- Hot days now (above 106°F)
- 7 days/yr
- Hot days in 30 yrs
- 17 days/yr
Wind risk 2/10 · Minimal
- Chance of severe wind over 30 yrs
- —
Air-quality risk 3/10 · Minor
- Unhealthy air days now
- 2 days/yr
- Unhealthy air days in 30 yrs
- 3 days/yr
Risk factors via First Street. Map © Google.
Why this score? — see what drove the C grade
The composite is a weighted blend of 9 inputs, each scored 0–100. Each bar is that input's sub-score; the figure is the points it added to the 100-point composite (weight × sub-score).
- Cash flow +21.0/30.0
- ARV discount +7.5/15.0
- DSCR +6.7/10.0
- 1% rule +5.5/10.0
- Rent growth +4.3/5.0
- Livability +3.9/5.0
- Condition / age +3.8/5.0
- Appreciation +3.2/10.0
- Schools +1.5/10.0
$149,000
🖨 Deal sheet 📄 Offer letter ✓ Due diligence
Multi-family units
County records classify this as Multi-Family (5+ Unit). Listing-text estimate: 1 unit. estimate disagrees with records
5+ unit building — per-unit beds/baths from public records are typically unavailable; the breakdown below (if shown) is an estimate from the listing text.
Listing remarks
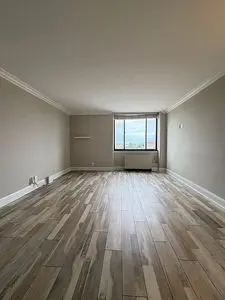
Spacious 10th-floor, northwest-facing condo at The Manhattan with covered garage parking, in-unit laundry, sunrise light, and resort-style downtown amenities. This move-in ready unit features large windows, city and green-space views, water-resistant and scratch-resistant flooring, an updated kitchen with granite-style countertops, gas stove, and a functional open layout. The unit also offers multiple closets for added storage, an almost-new Samsung washer/dryer combo, and an indoor covered garage parking spot. The Manhattan offers 24/7 security and concierge service, secured access, covered garage parking, rooftop indoor pool with skyline views, fitness center, sauna, theater room, game ro
Key facts
- In unit laundry
- Updated kitchen
- Concierge service
Tags
Property features AI
Exterior
- Home design: Built in 1971
- Construction: Living area approximately 662
- Exterior features: Located in the East Village subdivision
Neighborhood map
What this means for you Summary
Snapshot
- This is a 1-bed/1.0-bath multifamily listed at $149k. Condition is rated good.
Deal economics
- At list price, monthly cash flow is $209 ($3k/yr) — positive.
- The deal already cash-flows at list — no discount required.
- Meets the 1% rule at list price ($2k rent vs $149k).
- Recommended offer: $147k (1.5% below list) — sets the bar for market timing.
- Cap rate 8.0% vs local median 3.9% in Kansas City — top-decile yield for the area; either an underpriced asset or a hidden risk that comps aren't pricing in. Stress-test before assuming the spread holds.
Location & tenants
- Location reads 78/100 on livability (#28 in MO, #2,671 nationally) — a middle-class / working-renter tenant base. Strengths: amenities A+, commute A+, cost of living A+; Watch: schools C-, crime F.
- Kansas City 33 (urban): math 12% / reading 24% proficiency, ranked #308 of 324 in MO (top 95%) — low school quality limits family demand, transient renter base, plan for 1-2y turnover; 75% free/reduced lunch — lower-income household profile, screen leases tightly.
- Market conditions: Rents rising fast (+7.2%/yr); 53 active listings in the ZIP; 40 comparable units currently listed for rent nearby; rentals leasing fast (median 3d on market — plan ~1-2 weeks tenant-placement turnaround); 4,002 units permitted in Jackson County in 2024 (2,271 in 5+ unit buildings).
- This rent runs 36% of the median local income ($53k/yr) — at the standard rent-burdened threshold; future hikes will face affordability resistance.
Forward outlook
- Local home prices are declining (-3.0%/yr); year-one equity from $1k of loan paydown is wiped out by about $4k of value loss. Plan a longer hold.
- Jackson County population projected at +4% by 2050 — modest demand growth; plan on rents tracking national, not racing it.
- At projected returns (-3.0% appreciation + 7.2% rent growth), your $42k cash investment doubles in ~9 years — after that, you're playing with house money.
Negotiation context
- It's been on market 25 days — a 2% lower offer ($147k) is reasonable based on typical stale-listing flexibility.
- 5 sale attempts since 3y ago with the ask held roughly flat each time — persistent listings suggest the price (not the market) is what's stuck; bring a comps-based counter.
Questions for the listing agent
- Built in 1971 — when were the roof, HVAC, electrical panel, plumbing, and water heater last replaced?
- Is there a deadline driving the sale (1031 exchange, divorce, estate, relocation)? That informs how much negotiation room exists.
- Crime grade is F in this area — have there been break-ins, vandalism, or insurance claims at this property in the last 3 years? What carrier currently insures it and at what premium?
- What's the average days-on-market for RENTAL listings here right now (not sales)? A rising rental-DOM trend means longer vacancies and softer asking-rent achievability than the comps imply.
- What's the recent tenant-quality profile in this submarket — average credit score on applications, eviction rate, late-payment / NSF rate, and stable-employment percentage? A property-management company in the area should have these aggregated.
- How much new apartment / multifamily construction is in the pipeline within 1–3 miles? Heavy new supply (>2% of stock underway) typically softens rents 12–24 months out; light construction supports rent growth.
Investment metrics
- 1% rule
- 1.05% ✓
- Cap rate
- 7.98%
- Cash-on-cash
- 6.01%
- DSCR
- 1.27
- GRM
- 7.9
CMA / ARV
No comps found within radius.
Projected returns pro-forma
-3.0% appreciation · 7.15% rent growth · sell at horizon
- IRR
- -2.4%
- Equity multiple
- 0.90×
- Total profit
- $-3,987
- Equity at exit
- $22,216
- IRR
- 11.4%
- Equity multiple
- 2.06×
- Total profit
- $44,258
- Equity at exit
- $12,883
Cash invested: $41,720 (down + closing). Projections, not guarantees.
Landlord ↔ Tenant lean methodology
- Overall (STATE)
- 81 Strongly Landlord-Friendly
- State Missouri
- 81 Strongly Landlord-Friendly · R+10
- County
- — inherits STATE
- City
- — inherits STATE
ZIP-level market 64106
- Home prices YoY
- -1.5%
- Rents YoY
- 7.2%
- Active inventory
- 53
- Price-to-rent
- 7.9×
Monthly cashflow live
- Estimated rent
- $1,568 high interval (Pro) →
- Mortgage (P&I)
- −$781
- Tax est. 1.5%
- −$186 /mo · $2,235/yr
- Insurance
- −$62
- HOA
- −$0
- Vacancy / Maint / Mgmt
- −$329
- Net cashflow
- $209
Break-even live
UW: 25.0% down · 7.5% · 30yr · 1.5% tax · 5.0% vac · 8.0% maint · 8.0% mgmt
Financing live
Cash to close
- Down payment
- $37,250
- Closing costs
- $4,470
- Reserves months
- —
- Total cash needed
- —
Loan-product check · same deal, 3 products live
Conventional
25% down · 7.5% · 30yr
- Down + closing
- —
- Monthly P&I
- —
- Monthly cashflow
- —
- DSCR
- —
- Eligible?
- —
Personal DTI + credit; lowest rate.
DSCR
20% down · 8.5% · 30yr
- Down + closing
- —
- Monthly P&I
- —
- Monthly cashflow
- —
- DSCR
- —
- Eligible?
- —
No personal income docs; deal must DSCR.
Hard money
10% down · 12.0% · 12mo
- Down + closing
- —
- Monthly P&I
- —
- Monthly cashflow
- —
- DSCR
- —
- Eligible?
- —
Short-term bridge; refi at stabilization.
Rent comps 40 comps
| Address | Beds | Baths | Sqft | Rent | $/sqft | DOM | Units | Dist |
|---|---|---|---|---|---|---|---|---|
| 600 E 8th St Kansas City, MO | — | 1.0 | 522 | $999 | $1.91 | 3d | 1 | 0.09mi |
| 500 E 8th St Kansas City, MO | 2.0 | 1.0–2.0 | 770 | $1,596 | $2.07 | 1d | 70 | 0.14mi |
| 933 McGee St Kansas City, MO | 2.0 | 1.0 | 704 | $1,474 | $2.09 | 14d | 1 | 0.34mi |
| 531 Grand Blvd Kansas City, MO | 2.0 | 2.0 | 881 | $1,949 | $2.21 | 1d | 6 | 0.35mi |
| 770 E 5th St Kansas City, MO | 1.0–2.0 | 1.0–2.0 | 797 | $999 | $1.25 | 2d | 4 | 0.36mi |
| 722 Walnut St Kansas City, MO | 2.0 | 1.0 | 582 | $1,124 | $1.93 | 1d | 15 | 0.43mi |
| 306 E 12th St Kansas City, MO | 1.0 | 1.0 | 743 | $1,210 | $1.63 | 23d | 1 | 0.45mi |
| 1003 Walnut St Kansas City, MO | 1.0–2.0 | 1.0 | 750 | $1,300 | $1.73 | 23d | 12 | 0.45mi |
| 911 Main St Kansas City, MO | 2.0 | 1.0–2.0 | 1018 | $2,415 | $2.37 | 1d | 18 | 0.48mi |
| 1125 Grand Blvd Kansas City, MO | 2.0 | 1.0–2.5 | 1315 | $2,889 | $2.20 | 1d | 36 | 0.50mi |
| 201 Grand Blvd Kansas City, MO | 3.0 | 1.0–2.5 | 1000 | $2,495 | $2.50 | 1d | 135 | 0.54mi |
| 720 Main St Kansas City, MO | 2.0 | 1.0–2.0 | 723 | $1,358 | $1.88 | 1d | 22 | 0.54mi |
| 920 Main St Kansas City, MO | 1.0–2.0 | 1.0–2.0 | 897 | $1,375 | $1.53 | 16d | 1 | 0.54mi |
| 920 Main St Kansas City, MO | 1.0–2.0 | 1.0–2.0 | 897 | $1,900 | $2.12 | 21d | 5 | 0.54mi |
| 112 W 9th St Kansas City, MO | 1.0 | 1.0 | 660 | $1,520 | $2.30 | 12d | 2 | 0.57mi |
| 110 W 9th St Kansas City, MO | 2.0 | 1.0 | 867 | $2,030 | $2.34 | 43d | 1 | 0.59mi |
| 1004 Baltimore Ave Kansas City, MO | 1.0–2.0 | 1.0–2.0 | 1015 | $1,250 | $1.23 | 1d | 8 | 0.60mi |
| 401 Delaware St Kansas City, MO | 1.0–2.0 | 1.0–2.0 | 880 | $1,203 | $1.37 | 1d | 12 | 0.61mi |
| 50 E 13th St Kansas City, MO | 2.0 | 1.0–2.0 | 872 | $2,562 | $2.94 | 1d | 23 | 0.62mi |
| 609 Central St Kansas City, MO | — | 1.0 | 459 | $1,375 | $3.00 | 43d | 1 | 0.63mi |
| 127 W 10th St Kansas City, MO | 2.0 | 1.0–2.0 | 766 | $1,385 | $1.81 | 23d | 12 | 0.64mi |
| 106 W 11th St Kansas City, MO | 2.0 | 1.0–2.0 | 838 | $1,700 | $2.03 | 2d | 28 | 0.64mi |
| 101 W 11th St Kansas City, MO | 1.0 | 1.0 | 585 | $1,325 | $2.26 | 43d | 2 | 0.64mi |
| 1114 Baltimore Ave Kansas City, MO | 1.0 | 1.0–1.5 | 540 | $1,340 | $2.48 | 14d | 3 | 0.65mi |
| 309 Delaware St Kansas City, MO | — | 1.0 | 697 | $1,218 | $1.75 | 23d | 2 | 0.65mi |
| 701 Berkley Pkwy Kansas City, MO | 2.0 | 1.0–2.0 | 1011 | $2,547 | $2.52 | 1d | 74 | 0.68mi |
| 1221 Baltimore Ave Kansas City, MO | 1.0 | 1.0 | 413 | $1,505 | $3.64 | 3d | 15 | 0.69mi |
| 1444 Grand Blvd Kansas City, MO | 1.0–2.0 | 1.0–2.0 | 901 | $1,590 | $1.76 | 1d | 25 | 0.70mi |
| 323 W 8th St Kansas City, MO | 1.0–2.0 | 1.0–2.0 | 816 | $1,355 | $1.66 | 2d | 14 | 0.71mi |
| 237 W 4th St Kansas City, MO | 1.0–2.0 | 1.0–2.5 | 988 | $1,370 | $1.39 | 1d | 12 | 0.73mi |
| 320 W 7th St Kansas City, MO | — | 1.0 | 681 | $1,190 | $1.75 | 44d | 1 | 0.74mi |
| 701 Broadway Blvd Kansas City, MO | 2.0 | 1.0–2.0 | 1059 | $1,972 | $1.86 | 1d | 12 | 0.74mi |
| 1000 Berkley Pkwy Kansas City, MO | 2.0 | 1.0–2.5 | 1086 | $2,149 | $1.98 | 1d | 31 | 0.75mi |
| 1477 Main St Kansas City, MO | 2.0 | 1.0–2.5 | 1177 | $4,255 | $3.62 | 1d | 15 | 0.77mi |
| 106 W 14th St Kansas City, MO | 1.0–2.0 | 1.0–2.0 | 1046 | $1,485 | $1.42 | 1d | 27 | 0.77mi |
| 800 Broadway Blvd Kansas City, MO | 1.0 | 1.0 | 505 | $1,499 | $2.97 | 7d | 6 | 0.78mi |
| 802 Broadway Blvd Kansas City, MO | 1.0 | 1.0 | 567 | $1,246 | $2.20 | 23d | 1 | 0.78mi |
| 612 Garfield Ave Kansas City, MO | 1.0–2.0 | 1.0–2.0 | 900 | $839 | $0.93 | 1d | 44 | 0.82mi |
| 1522 Walnut St Kansas City, MO | 1.0 | 1.0 | 659 | $1,378 | $2.09 | 23d | 3 | 0.83mi |
| 1601 Walnut St Kansas City, MO | 1.0 | 1.0 | 780 | $1,450 | $1.86 | 2d | 3 | 0.87mi |
Listing history 26 events
-
2026-06-18days on market $149,000 Active 25 DOM
-
2026-06-17days on market $149,000 Active 24 DOM
-
2026-06-16days on market $149,000 Active 23 DOM
-
2026-06-15days on market $149,000 Active 22 DOM
-
2026-06-13days on market $149,000 Active 20 DOM
-
2026-06-09days on market $149,000 Active 16 DOM
-
2026-06-08days on market $149,000 Active 15 DOM
-
2026-06-07days on market $149,000 Active 14 DOM
-
2026-06-05days on market $149,000 Active 11 DOM
-
2026-06-03days on market $149,000 Active 10 DOM
-
2026-06-02days on market $149,000 Active 9 DOM
-
2026-06-01days on market $149,000 Active 8 DOM
-
2026-05-31days on market $149,000 Active 7 DOM
-
2026-05-25$149,000 Active
-
2026-01-19historical
-
2025-12-26status Active
-
2025-11-30status Pending
-
2025-10-06price $108,999
-
2025-09-11price $112,999
-
2025-07-16price $119,900
-
2025-06-28price $125,900
-
2025-06-06$130,000 Active
-
2023-10-27historical
-
2023-10-13status Active
-
2023-09-28status Pending
-
2023-07-21$120,000 Active
ⓘ Source: listings_history table (triggers on properties + properties_extension) + one-shot
backfill from property_details.listing_events for pre-trigger history.
Climate risk First Street
- Flood 1/10 Low FEMA zone X (unshaded) · 0% chance over 30 yrs
- Wildfire 1/10 Low
- Heat 4/10 Moderate 7 d/yr ≥106°F today · 17 d/yr by 30 yrs out
- Wind 2/10 Low
- Air quality 3/10 Moderate 2 unhealthy d/yr today · 3 by 30 yrs out
Nearby sold comps map
Loading sold comps map…
Walkable amenities ~0.75 mi
Loading nearby amenities…
Taxation est. · year 1
- Rental income
- $18,816
- − Mortgage interest
- −$8,346
- − Property taxes
- −$2,235
- − Insurance
- −$745
- − Repairs & maintenance
- −$1,505
- − Management
- −$1,505
- − Depreciation
- −$4,335
- Taxable income
- $145
- Est. tax owed @ 24.0%
- −$35
- After-tax cash flow
- $2,474/yr
For passive investors: Depreciation is non-cash, so a rental often shows a tax loss while cash-flowing — sheltering income. Rental losses are passive: they offset passive income freely, and up to $25,000/yr can offset ordinary (W-2) income if you actively participate and your MAGI is under $100k (phasing out to $0 by $150k); unused losses carry forward. On sale, claimed depreciation is recaptured at up to 25%, and gains may owe capital-gains tax (a 1031 exchange can defer both). Figures are a year-1 estimate at your 24.0% rate — not tax advice; consult a CPA.
Condition & rehab AI · 2 photos
This move-in ready unit at The Manhattan offers a good condition with minimal updates needed to maximize its value for both resale and rental.
Value-add opportunities
- Both Update countertops and appliances — Modernizing the kitchen can enhance both resale and rental value
- Both Paint interior walls — Fresh paint can improve the home's curb appeal and interior aesthetics
- Both Install new flooring — Replacing worn-out flooring can significantly boost both resale and rental value
Renovation cost estimate screening
Value-add ROI direction
- Both Update countertops and appliances — Modernizing the kitchen can enhance both resale and rental value ↑
- Both Paint interior walls — Fresh paint can improve the home's curb appeal and interior aesthetics ↑
- Both Install new flooring — Replacing worn-out flooring can significantly boost both resale and rental value ↑
ⓘ Cost ranges are severity-bucket heuristics (US national rule-of-thumb). Get contractor quotes + a written scope before underwriting a rehab budget.
Schools (NCES district)
- District
- Kansas City 33
- NCES district ID
- 2916400
- Math proficiency
- 12% ▼ -8.00%
- Reading proficiency
- 24% ▬ 0.00%
- Median HH income
- $35,227
- Composite
- 14.8/100
- National rank
- #9387
- State rank
- #308 of 324 in MO
Livability — Kansas City
- Score
- 78/100
- State rank
- #28
- US rank
- #2671
Category grades
Schools grade is shown separately in the Schools card above.
Census & demographics
- Census place
- Kansas City, MO
- County
- Jackson County · 687,798 people
- City population
- 439,467
- Metro
- Kansas City, MO-KS
- Population (ZIP)
- 11,343
- Household income
- $52,564
- Rent vs Own
- Severe rent burden
- 973.0
Population outlook (Jackson County) Hauer SSP2
- Today (2025)
- 719,589 people
- By 2030
- 731,456 · +1.6%
- By 2040
- 746,689 · +3.8%
- By 2050
- 749,289 · +4.1%
- By 2075
- 736,227 · +2.3%
- By 2100
- 668,210 · -7.1%
Race, ethnicity, and origin ACS 2023
- Neighborhood character
- Diverse neighborhood (Simpson 0.65)
- Race & ethnicity
- White 45% Black 37% Asian 8% Hispanic / Latino 7% Two or more races 6%
- Hispanic origin (detail)
- Mexican 3% Puerto Rican 2%
- Common ancestry
- Portuguese 2% Italian 1% Lithuanian 1%
- Foreign-born
- 16% · Canada, Vietnam, South Korea
- Languages at home
- 81% English-only · Spanish 4% Other Indo-European 3% Vietnamese 2%
Political lean MEDSL · Jackson
- 2024 margin
- D (+19.3) · D 58.9% · R 39.5% · Other 1.6%
- 2008→2024 swing
- -6.1pp toward R · 2008: 25.4pp · 2024: 19.3pp
- All cycles
- 2024: D+19.3 2020: D+22.0 2016: D+16.6 2012: D+19.0 2008: D+25.4
Not yet ingested
- Civics
- —
Market trends
- HPI YoY
- ▼ -3.60%
- Current HPI
- 240.7201
- Rent YoY
- ▲ 7.15%
- Metro
- Kansas City, MO-KS
- State GDP YoY
- ▲ 1.84%
- F500 in state
- 20
Industry mix (Fortune 500 HQ in MO)
| Industry | F500 HQs | Revenue |
|---|---|---|
| Healthcare | 1 | $163B |
|
||
| Insurance | 1 | $21B |
|
||
| Industrial Technology | 1 | $17B |
|
||
| Retail | 1 | $16B |
|
||
| Industrial Distribution | 1 | $10B |
|
||
| Utilities | 1 | $9B |
|
||
Price history
+24.2% since first listed13 events — show timeline
- 2026-05-25 Listed $149,000 FSBO.com
- 2026-01-19 Listing Removed — Heartland MLS as Distributed by MLS Grid
- 2025-12-26 Relisted — Heartland MLS as Distributed by MLS Grid
- 2025-11-30 Pending — Heartland MLS as Distributed by MLS Grid
- 2025-10-06 Price Changed $108,999 Heartland MLS as Distributed by MLS Grid
- 2025-09-11 Price Changed $112,999 Heartland MLS as Distributed by MLS Grid
- 2025-07-16 Price Changed $119,900 Heartland MLS as Distributed by MLS Grid
- 2025-06-28 Price Changed $125,900 Heartland MLS as Distributed by MLS Grid
- 2025-06-06 Listed $130,000 Heartland MLS as Distributed by MLS Grid
- 2023-10-27 Listing Removed — Heartland MLS as Distributed by MLS Grid
- 2023-10-13 Relisted — Heartland MLS as Distributed by MLS Grid
- 2023-09-28 Pending — Heartland MLS as Distributed by MLS Grid
- 2023-07-21 Listed $120,000 Heartland MLS as Distributed by MLS Grid
Cash-flow waterfall
monthlySold comps — $/sqft
last 12 mo · ≤1 miLoading sold comps…