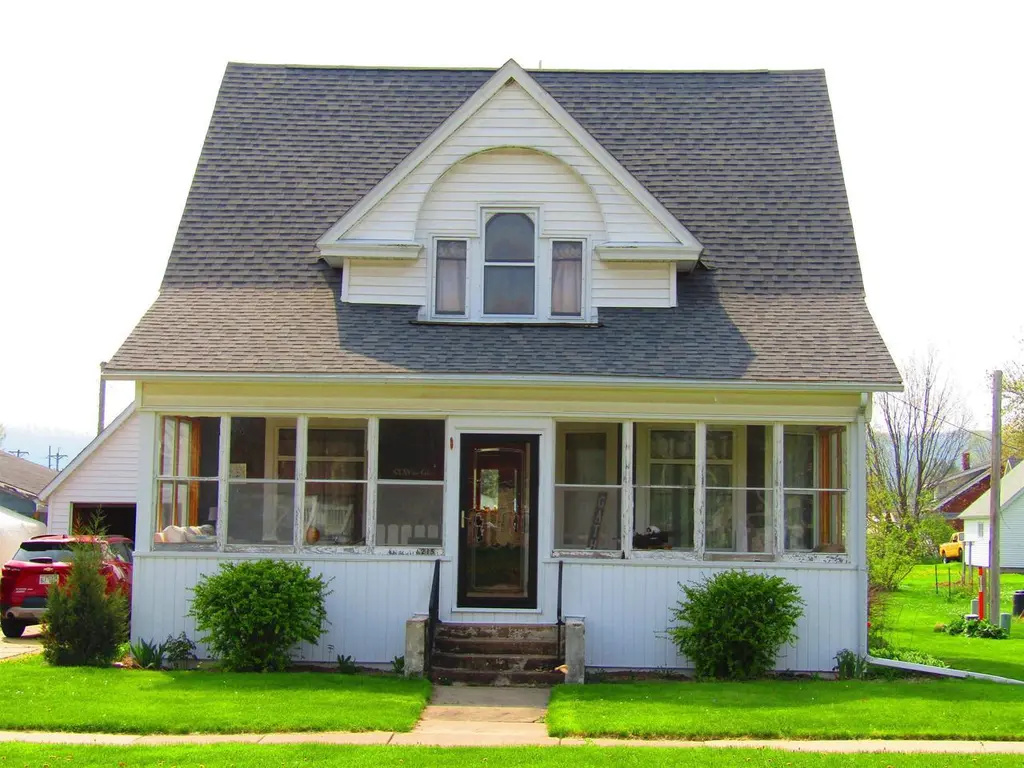
215 N Cushman Ave · Viola, WI
Flood risk 4/10 · Minor
- FEMA flood zone
- X (unshaded)
- Chance of flooding over 30 yrs
- 0.22%
- Est. flood insurance / yr
- $473 – $860
Fire risk 2/10 · Minimal
- Est. fire insurance / yr
- $636 – $1,182
Heat risk 2/10 · Minimal
- Hot days now (above 99°F)
- 7 days/yr
- Hot days in 30 yrs
- 14 days/yr
Wind risk 2/10 · Minimal
- Chance of severe wind over 30 yrs
- —
Air-quality risk 1/10 · Minimal
- Unhealthy air days now
- 0 days/yr
- Unhealthy air days in 30 yrs
- 0 days/yr
Risk factors via First Street. Map © Google.
Why this score? — see what drove the D grade
The composite is a weighted blend of 9 inputs, each scored 0–100. Each bar is that input's sub-score; the figure is the points it added to the 100-point composite (weight × sub-score).
- Cash flow +10.3/30.0
- Appreciation +8.7/10.0
- ARV discount +7.5/15.0
- Livability +3.2/5.0
- DSCR +3.0/10.0
- Schools +2.9/10.0
- 1% rule +2.5/10.0
- Rent growth +2.5/5.0
- Condition / age +2.5/5.0
$179,900
🖨 Deal sheet 📄 Offer letter ✓ Due diligence
Listing remarks MLS
Entered for Comp Purposes
Key facts
- 3-season front porch
- Pocket-style doors
- Original woodwork
Tags
Property features AI
Exterior
- Parking: Detached 1-car garage
- Utilities: Municipal water; Municipal sewer; Natural gas
- Home design: 1.5-story single-family home; Estimated living area range 1501–1750
- Construction: Exterior: aluminum/aluminum-steel/vinyl; Year built: see remarks
- Exterior features: Aluminum and vinyl siding; Garden shed; Less than 1/2 acre lot (approx. 0.29 acre); Residential zoning
Interior
- Kitchen: Dishwasher; Microwave; Oven; Range; Refrigerator
- Bedrooms: Primary bedroom (upper level) about 14 x 12; Bedroom 2 (upper level) about 11 x 10; Bedroom 3 (upper level) about 11 x 14; Bedroom 4 (upper level) about 10 x 13
- Flooring: Wood floors
- Bathrooms: Full bathroom with shower over tub
- Heating & cooling: Radiant / hot water heat (natural gas)
- Interior features: High-speed internet; Walk-in closets; Wood floors; Full stone basement
- Laundry & utility: Washer and dryer excluded from sale (not included)
Neighborhood map
What this means for you Summary
Snapshot
- This is a 4-bed/1.0-bath other listed at $180k.
Deal economics
- At list price, monthly cash flow is $-98 ($-1k/yr) — negative.
- To cash-flow at today's rent, offer at most $163k (9.7% below list).
- To meet the 1% rule (rent ≥ 1% of price), the offer needs to be $135k (24.8% below list).
- Recommended offer: $135k (24.8% below list) — sets the bar for 1% rule.
Location & tenants
- Location reads 63/100 on livability (#609 in WI) — a middle-class / working-renter tenant base. Strengths: cost of living A+, housing A; Watch: crime D+, health & safety D, amenities F.
- Kickapoo Area School District (rural): math 30% / reading 40% proficiency, ranked #239 of 342 in WI (top 70%) — families likely to look elsewhere, expect single-tenant / working-renter base with shorter leases.
- Zoned schools: Kickapoo Elementary (math 42% / reading 52%, grade D-, #319 of 1,041 statewide, top 34%, 205 students, 57% FRL); Kickapoo High (math 22% / reading 32%, grade F, #260 of 483 statewide, top 58%, 265 students, 42% FRL).
- Market conditions: 10 active listings in the ZIP; 30 units permitted in Richland County in 2024 (0 in 5+ unit buildings).
Forward outlook
- In year one you build about $14k of equity ($1k loan paydown + $13k appreciation (7.3% local appreciation)).
- Richland County population projected at -27% by 2050 — secular population decline; favor cash flow + early exit over multi-decade hold.
- By year 3, paydown + projected appreciation supports a ~$36k cash-out refi (75% LTV) — recoverable capital for the next deal without selling this one.
Negotiation context
- It's been on market 27 days — a 2% lower offer ($177k) is reasonable based on typical stale-listing flexibility.
- 2 sale attempts since 4y ago with the ask held roughly flat each time — persistent listings suggest the price (not the market) is what's stuck; bring a comps-based counter.
- Current owner paid $112k; list at $180k implies a 61% gain — meaningful room to come down on a strong offer.
Risks & watch-outs
- Watch-outs: built in 1920 — expect roof / HVAC / electrical / plumbing capex.
Questions for the listing agent
- What do current leases actually rent for vs. the listed asking? Can we see a recent rent roll and the last 12 months of T-12 income?
- Built in 1920 — when were the roof, HVAC, electrical panel, plumbing, and water heater last replaced?
- Is there a deadline driving the sale (1031 exchange, divorce, estate, relocation)? That informs how much negotiation room exists.
- Schools are D-rated, which usually means shorter tenancies and higher turnover. Who's the typical renter profile here, and what's been the actual vacancy rate?
- Crime grade is D in this area — have there been break-ins, vandalism, or insurance claims at this property in the last 3 years? What carrier currently insures it and at what premium?
- The area grade is low — what's the realistic commute time and amenity access for the typical tenant pool here? Any planned neighborhood developments (good or bad) we should know about?
- What's the average days-on-market for RENTAL listings here right now (not sales)? A rising rental-DOM trend means longer vacancies and softer asking-rent achievability than the comps imply.
- What's the recent tenant-quality profile in this submarket — average credit score on applications, eviction rate, late-payment / NSF rate, and stable-employment percentage? A property-management company in the area should have these aggregated.
- How much new for-sale + rental construction is in the pipeline within 1–3 miles? Heavy new supply typically softens prices + rents 12–24 months out; constrained supply supports both.
Investment metrics
- 1% rule
- 0.75% ✗
- Cap rate
- 5.64%
- Cash-on-cash
- -2.34%
- DSCR
- 0.90
- GRM
- 11.1
CMA / ARV
No comps found within radius.
Projected returns pro-forma
7.32% appreciation · 3.0% rent growth · sell at horizon
- IRR
- 16.6%
- Equity multiple
- 2.19×
- Total profit
- $60,103
- Equity at exit
- $128,471
- IRR
- 16.1%
- Equity multiple
- 4.55×
- Total profit
- $179,046
- Equity at exit
- $247,564
Cash invested: $50,372 (down + closing). Projections, not guarantees.
Landlord ↔ Tenant lean methodology
- Overall (STATE)
- 73 Landlord-Friendly
- State Wisconsin
- 73 Landlord-Friendly · R+2
- County
- — inherits STATE
- City
- — inherits STATE
ZIP-level market 54664
- Home prices YoY
- 3.5%
- Active inventory
- 10
- Price-to-rent
- 11.1×
Monthly cashflow live
- Estimated rent
- $1,353 medium interval (Pro) →
- Mortgage (P&I)
- −$943
- Tax from tax record
- −$149 /mo · $1,783/yr
- Insurance
- −$75
- HOA
- −$0
- Vacancy / Maint / Mgmt
- −$284
- Net cashflow
- $-98
Break-even live
UW: 25.0% down · 7.5% · 30yr · 1.5% tax · 5.0% vac · 8.0% maint · 8.0% mgmt
Financing live
Cash to close
- Down payment
- $44,975
- Closing costs
- $5,397
- Reserves months
- —
- Total cash needed
- —
Loan-product check · same deal, 3 products live
Conventional
25% down · 7.5% · 30yr
- Down + closing
- —
- Monthly P&I
- —
- Monthly cashflow
- —
- DSCR
- —
- Eligible?
- —
Personal DTI + credit; lowest rate.
DSCR
20% down · 8.5% · 30yr
- Down + closing
- —
- Monthly P&I
- —
- Monthly cashflow
- —
- DSCR
- —
- Eligible?
- —
No personal income docs; deal must DSCR.
Hard money
10% down · 12.0% · 12mo
- Down + closing
- —
- Monthly P&I
- —
- Monthly cashflow
- —
- DSCR
- —
- Eligible?
- —
Short-term bridge; refi at stabilization.
Listing history 20 events
-
2026-06-18days on market $179,900 Active 27 DOM
-
2026-06-17days on market $179,900 Active 26 DOM
-
2026-06-16days on market $179,900 Active 25 DOM
-
2026-06-15days on market $179,900 Active 24 DOM
-
2026-06-15days on market $179,900 Active 23 DOM
-
2026-06-13days on market $179,900 Active 22 DOM
-
2026-06-12days on market $179,900 Active 21 DOM
-
2026-06-09days on market $179,900 Active 18 DOM
-
2026-06-08days on market $179,900 Active 17 DOM
-
2026-06-08days on market $179,900 Active 16 DOM
-
2026-06-05days on market $179,900 Active 14 DOM
-
2026-06-03days on market $179,900 Active 12 DOM
-
2026-06-02days on market $179,900 Active 11 DOM
-
2026-06-01days on market $179,900 Active 10 DOM
-
2026-05-31days on market $179,900 Active 9 DOM
-
2026-05-22$179,900 Active
-
2022-12-12soldstatus $112,000
-
2022-12-09soldstatus $112,000 25-char remark
Show marketing remark (25 chars)
Entered for Comp Purposes
-
2022-10-18$112,000 25-char remark
Show marketing remark (25 chars)
Entered for Comp Purposes
-
2006-04-25soldstatus $75,000
ⓘ Source: listings_history table (triggers on properties + properties_extension) + one-shot
backfill from property_details.listing_events for pre-trigger history.
Tax reassessment forecast WI · Partial reset (capped growth)
- Current annual tax
- $1,783 · $149/mo
- Projected year-2 tax
- $2,556 · $213/mo
- Expected delta
- +$772/yr (+$64/mo · 43.3%)
ⓘ Screening estimate from a state-policy table — verify with the county assessor before closing.
Climate risk First Street
- Flood 4/10 Moderate FEMA zone X (unshaded) · 22% chance over 30 yrs
- Wildfire 2/10 Low
- Heat 2/10 Low 7 d/yr ≥99°F today · 14 d/yr by 30 yrs out
- Wind 2/10 Low
- Air quality 1/10 Low 0 unhealthy d/yr today · 0 by 30 yrs out
Nearby sold comps map
Loading sold comps map…
Walkable amenities ~0.75 mi
Loading nearby amenities…
Taxation est. · year 1
- Rental income
- $16,231
- − Mortgage interest
- −$10,077
- − Property taxes
- −$1,783
- − Insurance
- −$900
- − Repairs & maintenance
- −$1,299
- − Management
- −$1,299
- − Depreciation
- −$5,233
- Taxable loss
- −$4,359
- Est. tax savings @ 24.0%
- +$1,046
- After-tax cash flow
- $-135/yr
For passive investors: Depreciation is non-cash, so a rental often shows a tax loss while cash-flowing — sheltering income. Rental losses are passive: they offset passive income freely, and up to $25,000/yr can offset ordinary (W-2) income if you actively participate and your MAGI is under $100k (phasing out to $0 by $150k); unused losses carry forward. On sale, claimed depreciation is recaptured at up to 25%, and gains may owe capital-gains tax (a 1031 exchange can defer both). Figures are a year-1 estimate at your 24.0% rate — not tax advice; consult a CPA.
Schools (NCES district)
- District
- Kickapoo Area School District
- NCES district ID
- 5512540
- Math proficiency
- 30% ▼ -4.00%
- Reading proficiency
- 40% ▲ 3.00%
- Median HH income
- $41,104
- Composite
- 29.46/100
- National rank
- #6512
- State rank
- #239 of 342 in WI
Livability — Viola
- Score
- 63/100
- State rank
- #609
- US rank
- #15774
Category grades
Schools grade is shown separately in the Schools card above.
Census & demographics
- Census place
- Viola, WI
- Population (ZIP)
- 1,659
Population outlook (Richland County) Hauer SSP2
- Today (2025)
- 16,285 people
- By 2030
- 15,488 · -4.9%
- By 2040
- 13,716 · -15.8%
- By 2050
- 11,950 · -26.6%
- By 2075
- 8,697 · -46.6%
- By 2100
- 6,192 · -62.0%
Race, ethnicity, and origin ACS 2023
- Neighborhood character
- Predominantly White (95%)
- Race & ethnicity
- White 95% Two or more races 2% Hispanic / Latino 1%
- Common ancestry
- Portuguese 13% Polish 10% Romanian 4%
- Foreign-born
- 1% · Canada
- Languages at home
- 86% English-only · German/W. Germanic 12% Spanish 1%
Political lean MEDSL · Richland
- 2024 margin
- R (+13.1) · D 42.8% · R 56.0% · Other 1.2%
- 2008→2024 swing
- -33.8pp toward R · 2008: 20.6pp · 2024: -13.1pp
- All cycles
- 2024: R+13.1 2020: R+9.7 2016: R+5.6 2012: D+16.1 2008: D+20.6
Not yet ingested
- Civics
- —
Market trends
- HPI YoY
- ▲ 7.32%
- Current HPI
- 214.39
- Rent YoY
- —
- Metro
- —
- State GDP YoY
- ▲ 2.10%
- F500 in state
- 20
Industry mix (Fortune 500 HQ in WI)
| Industry | F500 HQs | Revenue |
|---|---|---|
| Industrial Machinery | 4 | $23B |
|
||
| Industrial Technology | 2 | $36B |
|
||
| Insurance | 1 | $36B |
|
||
| Professional Services | 1 | $19B |
|
||
| Utilities | 1 | $9B |
|
||
| Consumer Goods | 1 | $3B |
|
||
Price history
+139.9% since first listed5 events — show timeline
- 2026-05-22 Listed $179,900 METROMLS
- 2022-12-12 Sold (Public Records) $112,000 Public Records
- 2022-12-09 Sold (MLS) $112,000 METROMLS
- 2022-10-18 Listed $112,000 METROMLS
- 2006-04-25 Sold (Public Records) $75,000 Public Records
Property tax history
+2.4%/yrLatest (2025): $1,783 · +26.6% YoY. Source: county tax records.
Cash-flow waterfall
monthlySold comps — $/sqft
last 12 mo · ≤1 miLoading sold comps…