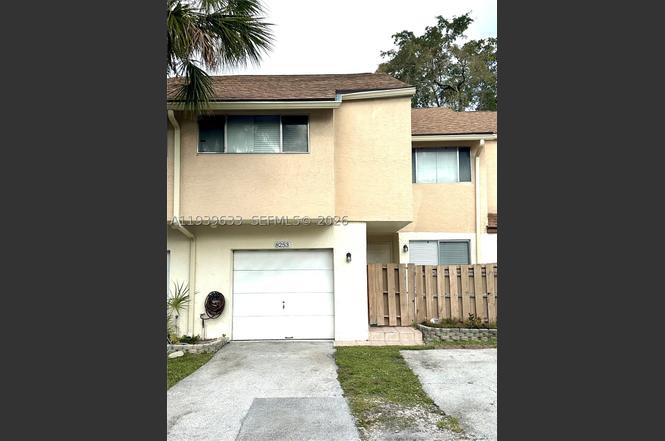
8253 NW 8th Pl #2 · Plantation, FL
Flood risk 1/10 · Minimal
- FEMA flood zone
- X (shaded)
- Chance of flooding over 30 yrs
- 0.0%
- Est. flood insurance / yr
- $507 – $1,088
Fire risk 1/10 · Minimal
- Est. fire insurance / yr
- $947 – $1,759
Heat risk 10/10 · Severe
- Hot days now (above 105°F)
- 7 days/yr
- Hot days in 30 yrs
- 27 days/yr
Wind risk 10/10 · Severe
- Chance of severe wind over 30 yrs
- 99.0%
Air-quality risk 3/10 · Minor
- Unhealthy air days now
- 2 days/yr
- Unhealthy air days in 30 yrs
- 3 days/yr
Risk factors via First Street. Map © Google.
Why this score? — see what drove the B- grade
The composite is a weighted blend of 9 inputs, each scored 0–100. Each bar is that input's sub-score; the figure is the points it added to the 100-point composite (weight × sub-score).
- Cash flow +26.4/30.0
- 1% rule +10.0/10.0
- DSCR +9.0/10.0
- ARV discount +7.5/15.0
- Schools +4.1/10.0
- Livability +4.1/5.0
- Rent growth +2.8/5.0
- Condition / age +2.5/5.0
- Appreciation +0.0/10.0
$160,000
🖨 Deal sheet 📄 Offer letter ✓ Due diligence
Listing remarks
In connection with a Bankruptcy Trustee Sale. Property is sold "As-Is, Where-Is" with no representations, warranties or guarantees of any kind, whether stated or implied by the Trustee and/or her professionals. Buyers must do their own Due diligence. Listing is subject to errors and omissions. 4 Bedroom | 2.5 Bath + built out garage into Den. Investors or End Users, this is a great opportunity. 25% Down Required by buyer. Special Assessment is $700 a month for 183 months Estimate, assumed by the buyer. .
Key facts
- $800 HOA
- 2 garage spots
- Built 1980
Property features AI
Finance
- Financial info: Pets not allowed
- HOA & community: Association fee $800 monthly (includes amenities)
Exterior
- Parking: 2-car garage; Two or more parking spaces; 2 covered parking spaces
- Home design: 2-story property; Entry level: 1
- Construction: Block construction; Resale property
- Exterior features: Open porch; Porch
Interior
- Kitchen: Electric range; Microwave; Refrigerator
- Flooring: Laminate flooring
- Bathrooms: 2 full bathrooms; 1 half bathroom
- Heating & cooling: Central heating (electric); Central air conditioning (electric)
- Interior features: First-floor entry; Other interior features
Neighborhood map
What this means for you Summary
Snapshot
- This is a 4-bed/3.0-bath condo listed at $160k.
Deal economics
- At list price, monthly cash flow is $418 ($5k/yr) — positive.
- The deal already cash-flows at list — no discount required.
- Meets the 1% rule at list price ($3k rent vs $160k).
- Recommended offer: $141k (12.0% below list) — sets the bar for market timing.
- Cap rate 9.4% vs local median 3.4% in Plantation — top-decile yield for the area; either an underpriced asset or a hidden risk that comps aren't pricing in. Stress-test before assuming the spread holds.
Location & tenants
- Location reads 82/100 on livability (#70 in FL, #1,174 nationally) — a professional / high-income tenant draw. Strengths: commute A+, housing A+, health & safety A+; Watch: amenities C-, cost of living D-.
- Broward (suburban): math 42% / reading 53% proficiency, ranked #46 of 73 in FL (top 63%) — families likely to look elsewhere, expect single-tenant / working-renter base with shorter leases.
- Market conditions: Rents rising (+1.2%/yr); 398 active listings in the ZIP; 40 comparable units currently listed for rent nearby; rentals at typical pace (median 17d on market — plan ~3-4 weeks tenant-placement turnaround); solid renter incomes; 2,111 units permitted in Broward County in 2024 (1,265 in 5+ unit buildings).
- At $3,290/mo this rent would consume 46% of the median local household income ($85k/yr) (locally 2923% of renters already pay >50% of income on rent) — very limited rent-growth headroom before tenants either downsize or default.
Forward outlook
- Local home prices are declining (-3.0%/yr); year-one equity from $1k of loan paydown is wiped out by about $5k of value loss. Plan a longer hold.
- Broward County population projected at +34% by 2050 — long-run rental-demand tailwind backs the buy-and-hold thesis.
Negotiation context
- It's been on market 162 days — a 12% lower offer ($141k) is reasonable based on typical stale-listing flexibility.
- 5 sale attempts since 2y ago; this cycle's ask has dropped $39k (20%) from the opening price — seller is motivated, your offer sets the floor, not the list.
Risks & watch-outs
- Watch-outs: property tax is 3.6% of price; HOA is 24% of rent.
- Climate carrying-cost: severe wind risk, 99% chance of damaging wind over 30y; extreme-heat days projected 7→27/yr by 2055 (HVAC capex compounding) — expect insurance premiums to compound above CPI over the hold.
Questions for the listing agent
- It's been on market 162 days. Have you received any prior offers? Is the seller open to a 12% concession, seller financing, or rate buy-down credit?
- Property tax is high relative to price — has the assessment been appealed recently, and will the sale trigger a re-assessment?
- What does the HOA fee cover, when was the last increase, and are there any pending special assessments or reserve-fund shortfalls?
- Any open or pending special assessments — roof, HVAC, plumbing, elevator, façade? What's the per-unit balance and payoff schedule, and is the seller paying it off at close or rolling it to the buyer?
- Why hasn't it sold? Are there any deal-killer items the seller is aware of (foundation, flood, title, zoning, code violations)?
- Is there a deadline driving the sale (1031 exchange, divorce, estate, relocation)? That informs how much negotiation room exists.
- Schools are B-rated — typically a magnet for longer-tenancy family renters. What's the average tenant stay here, and is there a school-zone premium baked into asking?
- What's the average days-on-market for RENTAL listings here right now (not sales)? A rising rental-DOM trend means longer vacancies and softer asking-rent achievability than the comps imply.
- What's the recent tenant-quality profile in this submarket — average credit score on applications, eviction rate, late-payment / NSF rate, and stable-employment percentage? A property-management company in the area should have these aggregated.
- How much new apartment / multifamily construction is in the pipeline within 1–3 miles? Heavy new supply (>2% of stock underway) typically softens rents 12–24 months out; light construction supports rent growth.
Investment metrics
- 1% rule
- 2.06% ✓
- Cap rate
- 9.43%
- Cash-on-cash
- 11.20%
- DSCR
- 1.50
- GRM
- 4.1
CMA / ARV
No comps found within radius.
Projected returns pro-forma
-3.0% appreciation · 1.23% rent growth · sell at horizon
- IRR
- -2.6%
- Equity multiple
- 0.90×
- Total profit
- $-4,335
- Equity at exit
- $23,857
- IRR
- 3.7%
- Equity multiple
- 1.24×
- Total profit
- $10,613
- Equity at exit
- $13,834
Cash invested: $44,800 (down + closing). Projections, not guarantees.
Landlord ↔ Tenant lean methodology
- Overall (STATE)
- 87 Strongly Landlord-Friendly
- State Florida
- 87 Strongly Landlord-Friendly · R+3
- County
- — inherits STATE
- City
- — inherits STATE
ZIP-level market 33324
- Home prices YoY
- -33.5%
- Rents YoY
- 1.2%
- Active inventory
- 398
- Price-to-rent
- 4.1×
Monthly cashflow live
- Estimated rent
- $3,290 high interval (Pro) →
- Mortgage (P&I)
- −$839
- Tax from tax record
- −$475 /mo · $5,699/yr
- Insurance
- −$67
- HOA
- −$800
- Vacancy / Maint / Mgmt
- −$691
- Net cashflow
- $418
Break-even live
UW: 25.0% down · 7.5% · 30yr · 1.5% tax · 5.0% vac · 8.0% maint · 8.0% mgmt
Financing live
Cash to close
- Down payment
- $40,000
- Closing costs
- $4,800
- Reserves months
- —
- Total cash needed
- —
Loan-product check · same deal, 3 products live
Conventional
25% down · 7.5% · 30yr
- Down + closing
- —
- Monthly P&I
- —
- Monthly cashflow
- —
- DSCR
- —
- Eligible?
- —
Personal DTI + credit; lowest rate.
DSCR
20% down · 8.5% · 30yr
- Down + closing
- —
- Monthly P&I
- —
- Monthly cashflow
- —
- DSCR
- —
- Eligible?
- —
No personal income docs; deal must DSCR.
Hard money
10% down · 12.0% · 12mo
- Down + closing
- —
- Monthly P&I
- —
- Monthly cashflow
- —
- DSCR
- —
- Eligible?
- —
Short-term bridge; refi at stabilization.
Rent comps 40 comps
| Address | Beds | Baths | Sqft | Rent | $/sqft | DOM | Units | Dist |
|---|---|---|---|---|---|---|---|---|
| 8253 NW 9th St #3 Plantation, FL | 3.0 | 2.5 | 1770 | $2,800 | $1.58 | 7d | 1 | 0.06mi |
| 8244 NW 9th St #5 Plantation, FL | 4.0 | 2.5 | 2020 | $3,150 | $1.56 | 24d | 1 | 0.06mi |
| 8244 NW 9th Ct #8 Fort Lauderdale, FL | 4.0 | 2.5 | 2080 | $3,500 | $1.68 | 24d | 1 | 0.08mi |
| 8231 NW 8th Pl #3 Plantation, FL | 3.0 | 2.5 | 1654 | $2,850 | $1.72 | 13d | 1 | 0.09mi |
| 8231 NW 8th Pl #3 Plantation, FL | 3.0 | 2.5 | 1770 | $2,850 | $1.61 | 24d | 1 | 0.09mi |
| 8208 NW 8th Pl Plantation, FL | 3.0 | 2.5 | 1770 | $2,950 | $1.67 | 17d | 1 | 0.09mi |
| 8344 NW 7th Pl Unit 8344 Plantation, FL | 3.0 | 2.5 | 1627 | $4,199 | $2.58 | 24d | 1 | 0.15mi |
| 835 NW 81st Way #5 Plantation, FL | 3.0 | 2.5 | 1770 | $2,600 | $1.47 | 7d | 1 | 0.19mi |
| 833 NW 81st Ter #8 Plantation, FL | 4.0 | 2.5 | 1770 | $2,900 | $1.64 | 20d | 1 | 0.23mi |
| 8500 Cleary Blvd Plantation, FL | 1.0–3.0 | 1.0–2.0 | 1045 | $3,549 | $3.40 | 2d | 18 | 0.23mi |
| 833 NW 81st Ave Plantation, FL | 4.0 | 2.5 | 1770 | $3,250 | $1.84 | 13d | 1 | 0.27mi |
| 833 NW 81st Ave #4 Plantation, FL | 3.0 | 2.5 | 1770 | $3,600 | $2.03 | 18d | 1 | 0.27mi |
| 833 NW 81st Ave #4 Plantation, FL | 4.0 | 2.5 | 1770 | $3,250 | $1.84 | 21d | 1 | 0.27mi |
| 843 NW 81st Ave #7 Plantation, FL | 3.0 | 2.5 | 1770 | $2,980 | $1.68 | 7d | 1 | 0.27mi |
| 791 N Pine Island Rd Plantation, FL | 2.0–3.0 | 2.0 | 1196 | $2,400 | $2.01 | 5d | 2 | 0.30mi |
| 791 N Pine Island Rd #306 Plantation, FL | 3.0 | 2.0 | 1320 | $2,400 | $1.82 | 11d | 1 | 0.31mi |
| 8000 Cleary Blvd Plantation, FL | 2.0–3.0 | 2.0–3.0 | 1357 | $3,292 | $2.43 | 1d | 21 | 0.33mi |
| 9161 Vineyard Lake Dr Unit 9161 Plantation, FL | 3.0 | 2.5 | 1765 | $4,000 | $2.27 | 24d | 1 | 0.38mi |
| 751 N Pine Island Rd Plantation, FL | 1.0–3.0 | 1.0–2.0 | 1003 | $2,400 | $2.39 | 24d | 2 | 0.41mi |
| 576 Westree Ln Plantation, FL | 3.0 | 2.5 | 1651 | $3,250 | $1.97 | 24d | 1 | 0.43mi |
| 9023 Vineyard Lake Dr Plantation, FL | 3.0 | 2.5 | 1739 | $3,500 | $2.01 | 7d | 1 | 0.46mi |
| 9023 Vineyard Lake Dr Plantation, FL | 3.0 | 2.5 | 1739 | $3,500 | $2.01 | 1d | 1 | 0.46mi |
| 510 NW 84th Ave Plantation, FL | 1.0–3.0 | 1.0–2.0 | 1124 | $3,200 | $2.85 | 16d | 6 | 0.47mi |
| 510 NW 84th Ave Plantation, FL | 2.0–3.0 | 2.0 | 1303 | $3,200 | $2.46 | 15d | 5 | 0.47mi |
| 510 NW 84th Ave Plantation, FL | 1.0–3.0 | 1.0–2.0 | 1137 | $3,600 | $3.17 | 10d | 7 | 0.47mi |
| 510 NW 84th Ave Plantation, FL | 1.0–3.0 | 1.0–2.0 | 1124 | $3,200 | $2.85 | 1d | 5 | 0.47mi |
| 537 N University Dr #71 Plantation, FL | 3.0 | 2.5 | 1830 | $3,250 | $1.78 | 24d | 1 | 0.50mi |
| 537 N University Dr #71 Plantation, FL | 3.0 | 2.5 | 1830 | $3,000 | $1.64 | 4d | 1 | 0.50mi |
| 568 N University Dr #568 Plantation, FL | 3.0 | 2.5 | 1589 | $3,250 | $2.05 | 7d | 1 | 0.52mi |
| 568 N University Dr #568 Plantation, FL | 3.0 | 2.5 | 1589 | $3,500 | $2.20 | 21d | 1 | 0.52mi |
| 9087 Vineyard Lake Dr Plantation, FL | 3.0 | 2.5 | 1590 | $3,350 | $2.11 | 24d | 1 | 0.52mi |
| 7903 NW 7th Ct Unit 7903 Plantation, FL | 3.0 | 2.5 | 1340 | $2,800 | $2.09 | 21d | 1 | 0.54mi |
| 1114 NW 79th Dr Plantation, FL | 3.0 | 2.5 | 1624 | $3,000 | $1.85 | 7d | 1 | 0.55mi |
| 7885 NW 7th Ct #406 Plantation, FL | 3.0 | 2.5 | 1340 | $2,800 | $2.09 | 10d | 1 | 0.57mi |
| 845 NW 91st Ter Unit 845 Plantation, FL | 3.0 | 2.5 | 1515 | $3,500 | $2.31 | 24d | 1 | 0.58mi |
| 992 NW 93rd Ave Plantation, FL | 3.0 | 2.0 | 1504 | $3,350 | $2.23 | 24d | 1 | 0.65mi |
| 1125 NW 78th Ave Plantation, FL | 4.0 | 2.5 | 2364 | $3,500 | $1.48 | 24d | 1 | 0.67mi |
| 9090 NW 11th Ct Plantation, FL | 3.0 | 2.0 | 2112 | $5,000 | $2.37 | 20d | 1 | 0.71mi |
| 333 N University Dr Plantation, FL | 3.0 | 1.0–2.0 | 1065 | $4,283 | $4.02 | 2d | 15 | 0.73mi |
| 301 NW 78th Ave Plantation, FL | 3.0 | 2.0 | 1403 | $3,950 | $2.82 | 24d | 1 | 0.80mi |
HOA detail condo
- Monthly dues
- $800 · $9,600/yr
- ⚠ Special-assessment mentions
-
…2.5 Bath + built out garage into Den. Investors or End Users, this is a great opportunity. 25% Down Required by buyer. Special Assessment is $700 a month for 183 months Estimate, assumed by the buyer. .
Listing history 27 events
-
2026-06-18days on market $160,000 Active 162 DOM
-
2026-06-17days on market $160,000 Active 161 DOM
-
2026-06-16days on market $160,000 Active 160 DOM
-
2026-06-15days on market $160,000 Active 159 DOM
-
2026-06-13days on market $160,000 Active 157 DOM
-
2026-06-09days on market $160,000 Active 153 DOM
-
2026-06-07days on market $160,000 Active 151 DOM
-
2026-06-04days on market $160,000 Active 148 DOM
-
2026-06-03days on market $160,000 Active 147 DOM
-
2026-06-02days on market $160,000 Active 146 DOM
-
2026-06-01days on market $160,000 Active 145 DOM
-
2026-05-31days on market $160,000 Active 144 DOM
-
2026-03-02price $160,000
-
2026-02-04price $184,000
-
2026-01-07$199,000 Active
-
2025-07-24historical $3,600
-
2025-07-23historical
-
2025-05-02price $3,600
-
2025-04-16$339,000
-
2025-04-09$3,800
-
2024-06-08historical $3,100
-
2024-04-06$3,100
-
2024-02-29historical $3,100
-
2024-02-24$3,100
-
2003-04-21soldstatus $160,000
-
2000-10-04soldstatus $98,000
-
1979-12-01soldstatus $73,900
ⓘ Source: listings_history table (triggers on properties + properties_extension) + one-shot
backfill from property_details.listing_events for pre-trigger history.
Tax reassessment forecast FL · Resets to sale price
- Current annual tax
- $5,699 · $475/mo
- Projected year-2 tax
- $5,699 · $475/mo
- Expected delta
- $0/yr ($0/mo · 0.0%)
ⓘ Screening estimate from a state-policy table — verify with the county assessor before closing.
Climate risk First Street
- Flood 1/10 Low FEMA zone X (shaded) · 0% chance over 30 yrs
- Wildfire 1/10 Low
- Heat 10/10 Extreme 7 d/yr ≥105°F today · 27 d/yr by 30 yrs out
- Wind 10/10 Extreme 99% chance of damaging wind over 30 yrs
- Air quality 3/10 Moderate 2 unhealthy d/yr today · 3 by 30 yrs out
Nearby sold comps map
Loading sold comps map…
Walkable amenities ~0.75 mi
Loading nearby amenities…
Taxation est. · year 1
- Rental income
- $39,477
- − Mortgage interest
- −$8,962
- − Property taxes
- −$5,699
- − Insurance
- −$800
- − Repairs & maintenance
- −$3,158
- − Management
- −$3,158
- − HOA
- −$9,600
- − Depreciation
- −$4,655
- Taxable income
- $3,445
- Est. tax owed @ 24.0%
- −$827
- After-tax cash flow
- $4,192/yr
For passive investors: Depreciation is non-cash, so a rental often shows a tax loss while cash-flowing — sheltering income. Rental losses are passive: they offset passive income freely, and up to $25,000/yr can offset ordinary (W-2) income if you actively participate and your MAGI is under $100k (phasing out to $0 by $150k); unused losses carry forward. On sale, claimed depreciation is recaptured at up to 25%, and gains may owe capital-gains tax (a 1031 exchange can defer both). Figures are a year-1 estimate at your 24.0% rate — not tax advice; consult a CPA.
Schools (NCES district)
- District
- Broward
- NCES district ID
- 1200180
- Math proficiency
- 42% ▼ -18.00%
- Reading proficiency
- 53% ▼ -5.00%
- Median HH income
- $52,139
- Composite
- 40.88/100
- National rank
- #3621
- State rank
- #46 of 73 in FL
Livability — Plantation
- Score
- 82/100
- State rank
- #70
- US rank
- #1174
Category grades
Schools grade is shown separately in the Schools card above.
Census & demographics
- Census place
- Plantation, FL
- County
- Broward County · 1,963,430 people
- City population
- 111,690
- Metro
- Miami-Fort Lauderdale-Pompano Beach, FL
- Population (ZIP)
- 50,151
- Household income
- $85,000
- Rent vs Own
- Severe rent burden
- 2923.0
Population outlook (Broward County) Hauer SSP2
- Today (2025)
- 2,207,033 people
- By 2030
- 2,360,704 · +7.0%
- By 2040
- 2,661,208 · +20.6%
- By 2050
- 2,946,698 · +33.5%
- By 2075
- 3,602,273 · +63.2%
- By 2100
- 3,970,984 · +79.9%
Race, ethnicity, and origin ACS 2023
- Neighborhood character
- Diverse neighborhood (Simpson 0.69)
- Race & ethnicity
- White 42% Hispanic / Latino 31% Two or more races 20% Black 16% Asian 6%
- Hispanic origin (detail)
- Mexican 2% Puerto Rican 5% Cuban 4% Dominican 2%
- Common ancestry
- Romanian 3% Italian 3% Hispanic 3%
- Foreign-born
- 31% · Canada, Jamaica, China
- Languages at home
- 60% English-only · Spanish 26% Other Indo-European 4% French/Haitian/Cajun 3%
Political lean MEDSL · Broward
- 2024 margin
- D (+17.0) · D 58.0% · R 41.0%
- 2008→2024 swing
- -17.8pp toward R · 2008: 34.7pp · 2024: 17.0pp
- All cycles
- 2024: D+17.0 2020: D+29.8 2016: D+35.0 2012: D+34.9 2008: D+34.7
Not yet ingested
- Civics
- —
Market trends
- HPI YoY
- ▼ -160.16%
- Current HPI
- 317.8685
- Rent YoY
- ▲ 1.23%
- Metro
- Miami-Fort Lauderdale-Pompano Beach, FL
- State GDP YoY
- ▲ 3.28%
- F500 in state
- 36
Industry mix (Fortune 500 HQ in FL)
| Industry | F500 HQs | Revenue |
|---|---|---|
| Industrial Technology | 2 | $29B |
|
||
| Insurance | 2 | $17B |
|
||
| Retail | 1 | $60B |
|
||
| Technology Distribution | 1 | $58B |
|
||
| Homebuilding | 1 | $35B |
|
||
| Technology Manufacturing | 1 | $35B |
|
||
Price history
+116.5% since first listed15 events — show timeline
- 2026-03-02 Price Changed $160,000 MARMLS
- 2026-02-04 Price Changed $184,000 MARMLS
- 2026-01-07 Listed $199,000 MARMLS
- 2025-07-24 Rental Removed $3,600 GFLMLS
- 2025-07-23 Listing Removed — Beaches MLS
- 2025-05-02 Price Changed $3,600 GFLMLS
- 2025-04-16 Listed $339,000 Beaches MLS
- 2025-04-09 Listed for Rent $3,800 GFLMLS
- 2024-06-08 Rental Removed $3,100 REALBIRD
- 2024-04-06 Listed for Rent $3,100 REALBIRD
- 2024-02-29 Rental Removed $3,100 REALLYO
- 2024-02-24 Listed for Rent $3,100 REALLYO
- 2003-04-21 Sold (Public Records) $160,000 Public Records
- 2000-10-04 Sold (Public Records) $98,000 Public Records
- 1979-12-01 Sold (Public Records) $73,900 Public Records
Property tax history
+18.0%/yrLatest (2025): $5,699 · +694.4% YoY. Source: county tax records.
Cash-flow waterfall
monthlySold comps — $/sqft
last 12 mo · ≤1 miLoading sold comps…