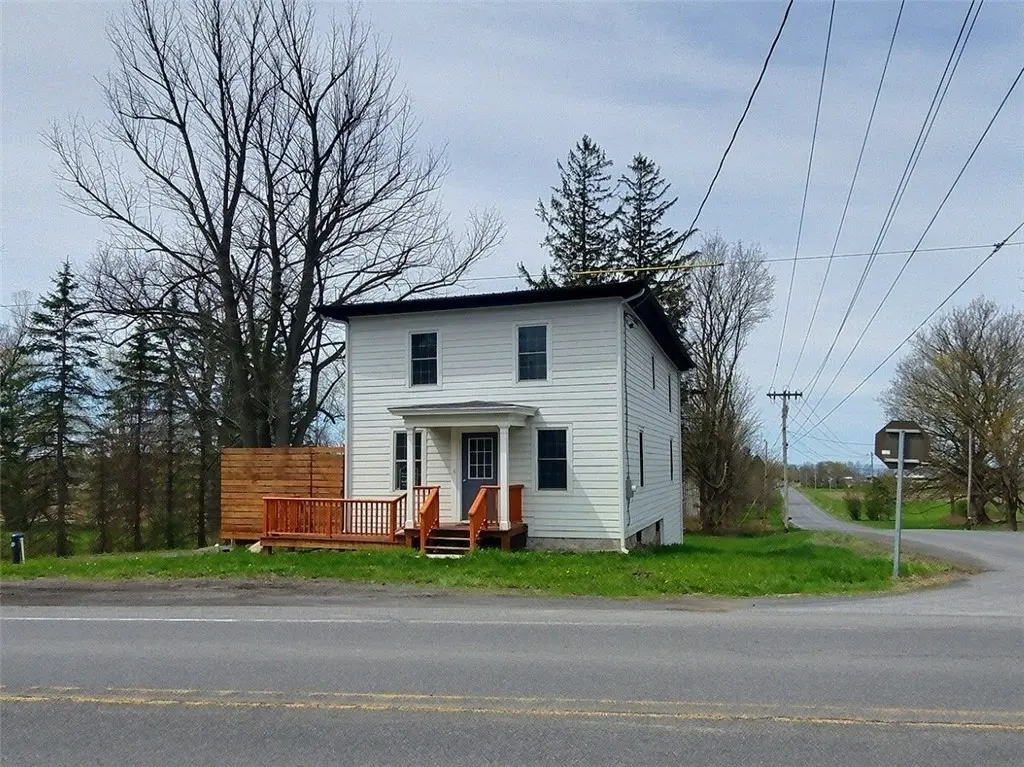
2951 State Route 34b · Aurora, NY
Flood risk 1/10 · Minimal
- FEMA flood zone
- X (unshaded)
- Chance of flooding over 30 yrs
- 0.0%
- Est. flood insurance / yr
- $473 – $860
Fire risk 1/10 · Minimal
- Est. fire insurance / yr
- $691 – $1,283
Heat risk 2/10 · Minimal
- Hot days now (above 93°F)
- 7 days/yr
- Hot days in 30 yrs
- 15 days/yr
Wind risk 2/10 · Minimal
- Chance of severe wind over 30 yrs
- 1.0%
Air-quality risk 2/10 · Minimal
- Unhealthy air days now
- 0 days/yr
- Unhealthy air days in 30 yrs
- 1 days/yr
Risk factors via First Street. Map © Google.
Why this score? — see what drove the D grade
The composite is a weighted blend of 9 inputs, each scored 0–100. Each bar is that input's sub-score; the figure is the points it added to the 100-point composite (weight × sub-score).
- Cash flow +10.5/30.0
- Appreciation +10.0/10.0
- Schools +5.3/10.0
- 1% rule +3.4/10.0
- Livability +3.4/5.0
- DSCR +3.0/10.0
- Rent growth +2.5/5.0
- Condition / age +2.5/5.0
- ARV discount +0.0/15.0
$325,000
🖨 Deal sheet 📄 Offer letter ✓ Due diligence
Listing remarks
Step into a piece of history that has been meticulously reborn for the modern lifestyle. This early 1800s residence underwent a total "down-to-the-studs" renovation, resulting in approximately 1,691 square feet of sophisticated living space where every corner feels intentional and new. The heart of the home centers around a gorgeous kitchen, featuring crisp cabinetry, sleek granite countertops, and premium stainless appliances. The open flow leads you into a family room anchored by a warm fireplace (insert required)—the perfect spot for chilly Finger Lakes evenings. For those who work from home, the dedicated office serves as a true showpiece, characterized by an elegant cof
Key facts
- New rear deck
- Gorgeous kitchen
- Level backyard
Tags
Property features AI
Exterior
- Parking: No garage
- Utilities: Well water; Septic tank
- Home design: 2 stories; Existing/resale property
- Construction: Composite siding; Wood siding; Block and stone foundation
- Exterior features: Gravel driveway; Corner lot; Rectangular lot; Road frontage on a main thoroughfare
Interior
- Kitchen: Galley kitchen; Free-standing range; Oven; Refrigerator
- Bedrooms: 7 total rooms including living spaces and office
- Flooring: Carpet; Hardwood; Ceramic tile; Tile; Varied flooring
- Bathrooms: 1 full bathroom; 1 half bathroom; 1 main-level bathroom
- Heating & cooling: Electric baseboard heating
- Interior features: Entrance foyer; Separate/formal living room; Galley kitchen; Home office; Full walk-out basement
- Laundry & utility: Laundry located in the basement; Electric water heater
Neighborhood map
What this means for you Summary
Snapshot
- This is a 2-bed/1.0-bath single-family listed at $325k.
Deal economics
- At list price, monthly cash flow is $-169 ($-2k/yr) — negative.
- To cash-flow at today's rent, offer at most $295k (9.2% below list).
- To meet the 1% rule (rent ≥ 1% of price), the offer needs to be $273k (16.1% below list).
- Recommended offer: $273k (16.1% below list) — sets the bar for 1% rule.
Location & tenants
- Location reads 68/100 on livability (#530 in NY) — a middle-class / working-renter tenant base. Strengths: employment A+, housing A+, schools B; Watch: cost of living D+, health & safety D, crime F.
- Southern Cayuga Central School District (rural): math 61% / reading 61% proficiency, ranked #214 of 590 in NY (top 36%) — acceptable for families but not a draw, mixed tenant base, ~2y average lease.
- Market conditions: 20 active listings in the ZIP; 161 units permitted in Cayuga County in 2024 (65 in 5+ unit buildings).
Forward outlook
- In year one you build about $35k of equity ($2k loan paydown + $32k appreciation (10.0% local appreciation)).
- Cayuga County population projected at -18% by 2050 — secular population decline; favor cash flow + early exit over multi-decade hold.
- By year 2, paydown + projected appreciation supports a ~$56k cash-out refi (75% LTV) — recoverable capital for the next deal without selling this one.
Negotiation context
- It's been on market 56 days — a 3% lower offer ($315k) is reasonable based on typical stale-listing flexibility.
- 2 sale attempts with the ask held roughly flat each time — persistent listings suggest the price (not the market) is what's stuck; bring a comps-based counter.
Risks & watch-outs
- Watch-outs: built in 1900 — expect roof / HVAC / electrical / plumbing capex.
Questions for the listing agent
- What do current leases actually rent for vs. the listed asking? Can we see a recent rent roll and the last 12 months of T-12 income?
- It's been on market 56 days. Have you received any prior offers? Is the seller open to a 16% concession, seller financing, or rate buy-down credit?
- Built in 1900 — when were the roof, HVAC, electrical panel, plumbing, and water heater last replaced?
- Is there a deadline driving the sale (1031 exchange, divorce, estate, relocation)? That informs how much negotiation room exists.
- Schools are B-rated — typically a magnet for longer-tenancy family renters. What's the average tenant stay here, and is there a school-zone premium baked into asking?
- Crime grade is F in this area — have there been break-ins, vandalism, or insurance claims at this property in the last 3 years? What carrier currently insures it and at what premium?
- The area grade is low — what's the realistic commute time and amenity access for the typical tenant pool here? Any planned neighborhood developments (good or bad) we should know about?
- What's the average days-on-market for RENTAL listings here right now (not sales)? A rising rental-DOM trend means longer vacancies and softer asking-rent achievability than the comps imply.
- What's the recent tenant-quality profile in this submarket — average credit score on applications, eviction rate, late-payment / NSF rate, and stable-employment percentage? A property-management company in the area should have these aggregated.
- How much new for-sale + rental construction is in the pipeline within 1–3 miles? Heavy new supply typically softens prices + rents 12–24 months out; constrained supply supports both.
Investment metrics
- 1% rule
- 0.84% ✗
- Cap rate
- 5.67%
- Cash-on-cash
- -2.23%
- DSCR
- 0.90
- GRM
- 9.9
CMA / ARV
- ARV (median comp)
- $260,096
- List price
- $325,000
- Delta
- 24.95%
- Verdict
- OVERPRICED
- Comps
- 8 within 2.0 mi
Projected returns pro-forma
10.0% appreciation · 3.0% rent growth · sell at horizon
- IRR
- 22.7%
- Equity multiple
- 2.83×
- Total profit
- $166,344
- Equity at exit
- $292,786
- IRR
- 20.3%
- Equity multiple
- 6.48×
- Total profit
- $498,482
- Equity at exit
- $631,404
Cash invested: $91,000 (down + closing). Projections, not guarantees.
Landlord ↔ Tenant lean methodology
- Overall (STATE)
- 15 Strongly Tenant-Friendly
- State New York
- 15 Strongly Tenant-Friendly · D+10
- County
- — inherits STATE
- City
- — inherits STATE
ZIP-level market 13026
- Home prices YoY
- 3.2%
- Active inventory
- 20
- Price-to-rent
- 9.9×
Monthly cashflow live
- Estimated rent
- $2,726 medium interval (Pro) →
- Mortgage (P&I)
- −$1,704
- Tax from tax record
- −$482 /mo · $5,788/yr
- Insurance
- −$135
- HOA
- −$0
- Vacancy / Maint / Mgmt
- −$572
- Net cashflow
- $-169
Break-even live
UW: 25.0% down · 7.5% · 30yr · 1.5% tax · 5.0% vac · 8.0% maint · 8.0% mgmt
Financing live
Cash to close
- Down payment
- $81,250
- Closing costs
- $9,750
- Reserves months
- —
- Total cash needed
- —
Loan-product check · same deal, 3 products live
Conventional
25% down · 7.5% · 30yr
- Down + closing
- —
- Monthly P&I
- —
- Monthly cashflow
- —
- DSCR
- —
- Eligible?
- —
Personal DTI + credit; lowest rate.
DSCR
20% down · 8.5% · 30yr
- Down + closing
- —
- Monthly P&I
- —
- Monthly cashflow
- —
- DSCR
- —
- Eligible?
- —
No personal income docs; deal must DSCR.
Hard money
10% down · 12.0% · 12mo
- Down + closing
- —
- Monthly P&I
- —
- Monthly cashflow
- —
- DSCR
- —
- Eligible?
- —
Short-term bridge; refi at stabilization.
Listing history 19 events
-
2026-06-19days on market $325,000 Active 56 DOM
-
2026-06-18days on market $325,000 Active 55 DOM
-
2026-06-17days on market $325,000 Active 54 DOM
-
2026-06-16days on market $325,000 Active 53 DOM
-
2026-06-15days on market $325,000 Active 52 DOM
-
2026-06-14days on market $325,000 Active 50 DOM
-
2026-06-12days on market $325,000 Active 49 DOM
-
2026-06-09days on market $325,000 Active 46 DOM
-
2026-06-08days on market $325,000 Active 45 DOM
-
2026-06-07days on market $325,000 Active 44 DOM
-
2026-06-05days on market $325,000 Active 41 DOM
-
2026-06-03days on market $325,000 Active 40 DOM
-
2026-06-02days on market $325,000 Active 39 DOM
-
2026-06-01days on market $325,000 Active 38 DOM
-
2026-05-31days on market $325,000 Active 37 DOM
-
2026-05-30days on market $325,000 Active 36 DOM
-
2026-04-24$325,000 Active 1606-char remark
-
2026-04-08historical
-
2025-12-08$325,000 Active
ⓘ Source: listings_history table (triggers on properties + properties_extension) + one-shot
backfill from property_details.listing_events for pre-trigger history.
Tax reassessment forecast NY · Partial reset (capped growth)
- Current annual tax
- $5,788 · $482/mo
- Projected year-2 tax
- $5,788 · $482/mo
- Expected delta
- $0/yr ($0/mo · 0.0%)
ⓘ Screening estimate from a state-policy table — verify with the county assessor before closing.
Climate risk First Street
- Flood 1/10 Low FEMA zone X (unshaded) · 0% chance over 30 yrs
- Wildfire 1/10 Low
- Heat 2/10 Low 7 d/yr ≥93°F today · 15 d/yr by 30 yrs out
- Wind 2/10 Low 100% chance of damaging wind over 30 yrs
- Air quality 2/10 Low 0 unhealthy d/yr today · 1 by 30 yrs out
Nearby sold comps map
Loading sold comps map…
Walkable amenities ~0.75 mi
Loading nearby amenities…
Taxation est. · year 1
- Rental income
- $32,709
- − Mortgage interest
- −$18,205
- − Property taxes
- −$5,788
- − Insurance
- −$1,625
- − Repairs & maintenance
- −$2,617
- − Management
- −$2,617
- − Depreciation
- −$9,455
- Taxable loss
- −$7,597
- Est. tax savings @ 24.0%
- +$1,823
- After-tax cash flow
- $-202/yr
For passive investors: Depreciation is non-cash, so a rental often shows a tax loss while cash-flowing — sheltering income. Rental losses are passive: they offset passive income freely, and up to $25,000/yr can offset ordinary (W-2) income if you actively participate and your MAGI is under $100k (phasing out to $0 by $150k); unused losses carry forward. On sale, claimed depreciation is recaptured at up to 25%, and gains may owe capital-gains tax (a 1031 exchange can defer both). Figures are a year-1 estimate at your 24.0% rate — not tax advice; consult a CPA.
Schools (NCES district)
- District
- Southern Cayuga Central School District
- NCES district ID
- 3627570
- Math proficiency
- 61% ▬ 0.00%
- Reading proficiency
- 61% ▲ 7.00%
- Median HH income
- $61,177
- Composite
- 52.98/100
- National rank
- #1524
- State rank
- #214 of 590 in NY
Livability — Aurora
- Score
- 68/100
- State rank
- #530
- US rank
- #9549
Category grades
Schools grade is shown separately in the Schools card above.
Census & demographics
- Population (ZIP)
- 1,703
Population outlook (Cayuga County) Hauer SSP2
- Today (2025)
- 74,820 people
- By 2030
- 72,402 · -3.2%
- By 2040
- 66,917 · -10.6%
- By 2050
- 61,007 · -18.5%
- By 2075
- 48,047 · -35.8%
- By 2100
- 34,512 · -53.9%
Race, ethnicity, and origin ACS 2023
- Neighborhood character
- Predominantly White (89%)
- Race & ethnicity
- White 89% Hispanic / Latino 6% Two or more races 4%
- Hispanic origin (detail)
- Mexican 1%
- Common ancestry
- Romanian 3% Lithuanian 3% Subsaharan African 2%
- Foreign-born
- 2% · Canada, Jamaica
- Languages at home
- 95% English-only · Spanish 4% Other Indo-European 1%
Political lean MEDSL · Cayuga
- 2024 margin
- R (+13.0) · D 43.5% · R 56.5%
- 2008→2024 swing
- -21.5pp toward R · 2008: 8.5pp · 2024: -13.0pp
- All cycles
- 2024: R+13.0 2020: R+9.2 2016: R+13.2 2012: D+10.8 2008: D+8.5
Not yet ingested
- Civics
- —
Market trends
- HPI YoY
- ▲ 12.77%
- Current HPI
- 410.3875
- Rent YoY
- —
- Metro
- —
- State GDP YoY
- ▲ 2.60%
- F500 in state
- 92
Industry mix (Fortune 500 HQ in NY)
| Industry | F500 HQs | Revenue |
|---|---|---|
| Financial Services | 10 | $950B |
|
||
| Consumer Goods | 9 | $162B |
|
||
| Insurance | 4 | $225B |
|
||
| Telecommunications | 2 | $144B |
|
||
| Pharmaceuticals | 2 | $112B |
|
||
| Media / Entertainment | 2 | $69B |
|
||
Price history
+0.0% since first listed3 events — show timeline
- 2026-04-24 Listed $325,000 UNYREIS
- 2026-04-08 Listing Removed — CNYIS
- 2025-12-08 Listed $325,000 CNYIS
Property tax history
+23.8%/yrLatest (2025): $5,788 · +6.1% YoY. Source: county tax records.
Cash-flow waterfall
monthlySold comps — $/sqft
last 12 mo · ≤1 miLoading sold comps…