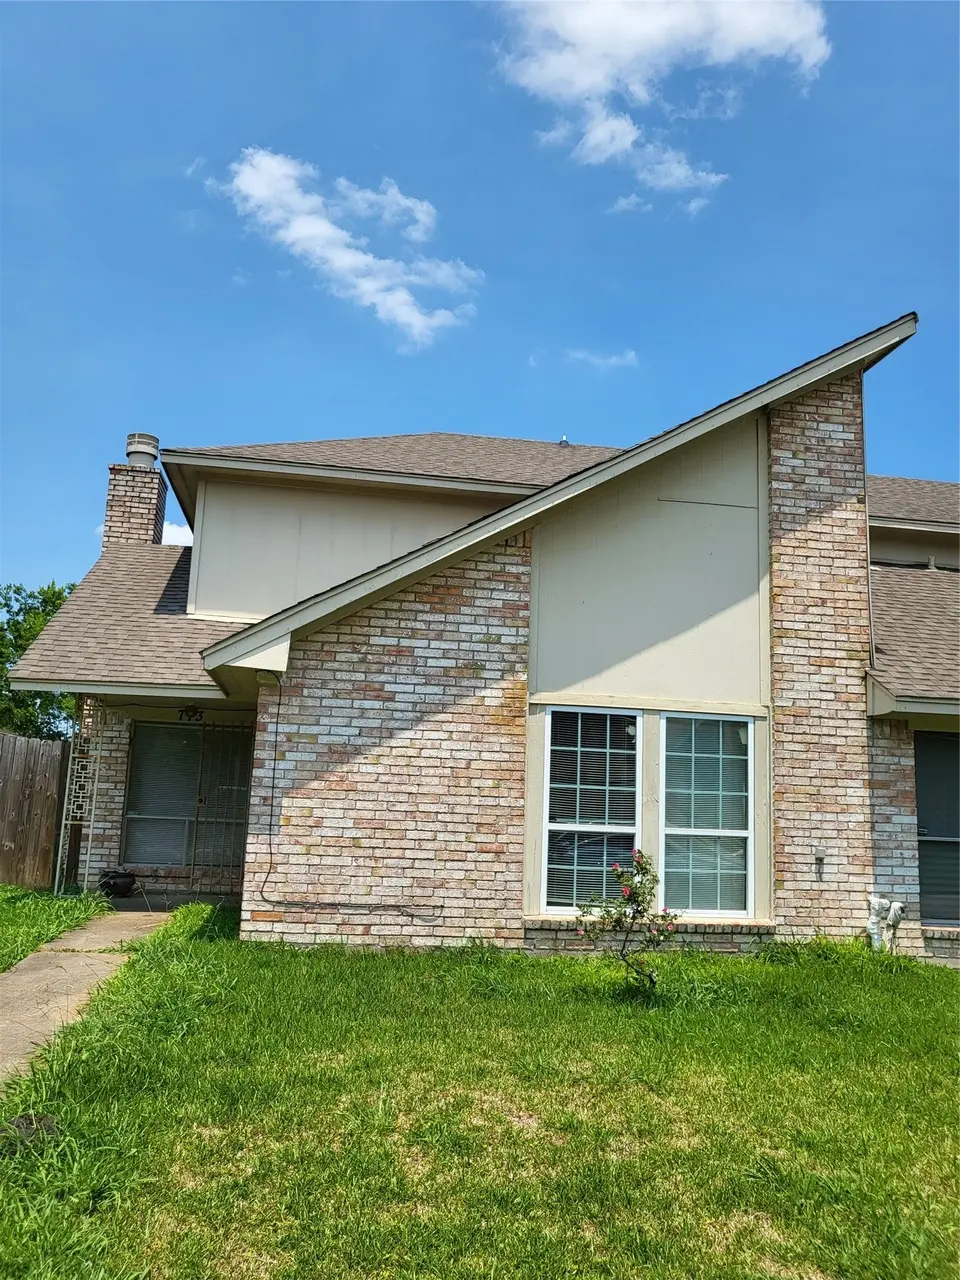
713 Carol Lynn Dr · Missouri City, TX
Flood risk 6/10 · Moderate
- FEMA flood zone
- X (unshaded)
- Chance of flooding over 30 yrs
- 0.69%
- Est. flood insurance / yr
- $507 – $1,088
Fire risk 3/10 · Minor
- Est. fire insurance / yr
- $1,222 – $2,270
Heat risk 9/10 · Severe
- Hot days now (above 110°F)
- 7 days/yr
- Hot days in 30 yrs
- 23 days/yr
Wind risk 9/10 · Severe
- Chance of severe wind over 30 yrs
- 99.0%
Air-quality risk 3/10 · Minor
- Unhealthy air days now
- 2 days/yr
- Unhealthy air days in 30 yrs
- 3 days/yr
Risk factors via First Street. Map © Google.
Why this score? — see what drove the C+ grade
The composite is a weighted blend of 9 inputs, each scored 0–100. Each bar is that input's sub-score; the figure is the points it added to the 100-point composite (weight × sub-score).
- Cash flow +24.7/30.0
- DSCR +8.0/10.0
- ARV discount +7.5/15.0
- 1% rule +6.6/10.0
- Appreciation +4.7/10.0
- Schools +4.5/10.0
- Livability +3.4/5.0
- Rent growth +2.6/5.0
- Condition / age +2.5/5.0
$160,000
🖨 Deal sheet 📄 Offer letter ✓ Due diligence
Key facts
- 2 garage spots
- Built 1980
- Listed 482 days
Neighborhood map
What this means for you Summary
Snapshot
- This is a 2-bed/2.0-bath single-family listed at $160k.
Deal economics
- At list price, monthly cash flow is $336 ($4k/yr) — positive.
- The deal already cash-flows at list — no discount required.
- Meets the 1% rule at list price ($2k rent vs $160k).
- Recommended offer: $141k (12.0% below list) — sets the bar for market timing.
- Cap rate 8.8% vs local median 3.5% in Missouri City — top-decile yield for the area; either an underpriced asset or a hidden risk that comps aren't pricing in. Stress-test before assuming the spread holds.
Location & tenants
- Location reads 67/100 on livability (#526 in TX) — a middle-class / working-renter tenant base. Strengths: housing A+, crime A, employment A; Watch: amenities F, commute F, health & safety F.
- Fort Bend ISD (suburban): math 44% / reading 53% proficiency, ranked #140 of 826 in TX (top 17%) — families likely to look elsewhere, expect single-tenant / working-renter base with shorter leases.
- Market conditions: Rents flat; 186 active listings in the ZIP; 2 comparable units currently listed for rent nearby; 12,093 units permitted in Fort Bend County in 2024 (815 in 5+ unit buildings).
Forward outlook
- In year one you build about $224 of equity ($1k loan paydown + $-882 appreciation (-0.6% local appreciation)).
- Fort Bend County population projected at +75% by 2050 — long-run rental-demand tailwind backs the buy-and-hold thesis.
- At projected returns (-0.6% appreciation + 0.3% rent growth), your $45k cash investment doubles in ~10 years — after that, you're playing with house money.
Negotiation context
- It's been on market 482 days — a 12% lower offer ($141k) is reasonable based on typical stale-listing flexibility.
- 4 sale attempts since 2y ago; this cycle's ask is 7% above the opening price — seller raised mid-cycle; expect resistance to lowballs.
Risks & watch-outs
- Climate carrying-cost: major flood risk; severe wind risk, 99% chance of damaging wind over 30y; extreme-heat days projected 7→23/yr by 2055 (HVAC capex compounding) — expect insurance premiums to compound above CPI over the hold.
Questions for the listing agent
- It's been on market 482 days. Have you received any prior offers? Is the seller open to a 12% concession, seller financing, or rate buy-down credit?
- Why hasn't it sold? Are there any deal-killer items the seller is aware of (foundation, flood, title, zoning, code violations)?
- Is there a deadline driving the sale (1031 exchange, divorce, estate, relocation)? That informs how much negotiation room exists.
- Schools are B-rated — typically a magnet for longer-tenancy family renters. What's the average tenant stay here, and is there a school-zone premium baked into asking?
- What's the average days-on-market for RENTAL listings here right now (not sales)? A rising rental-DOM trend means longer vacancies and softer asking-rent achievability than the comps imply.
- What's the recent tenant-quality profile in this submarket — average credit score on applications, eviction rate, late-payment / NSF rate, and stable-employment percentage? A property-management company in the area should have these aggregated.
- How much new for-sale + rental construction is in the pipeline within 1–3 miles? Heavy new supply typically softens prices + rents 12–24 months out; constrained supply supports both.
Investment metrics
- 1% rule
- 1.16% ✓
- Cap rate
- 8.81%
- Cash-on-cash
- 8.99%
- DSCR
- 1.40
- GRM
- 7.2
CMA / ARV
- ARV (median comp)
- $100,099
- List price
- $160,000
- Delta
- 59.84%
- Verdict
- OVERPRICED
- Comps
- 20 within 2.0 mi
Show comp detail 12 sales within ~0.75 mi
| Address | Dist | Beds/Ba | Sqft | Sold | Price | $/sf | Match |
|---|---|---|---|---|---|---|---|
| 1118 Aster Rd | 0.49mi | 3/2.0 (+1) | 1,413 (-3%) | 2mo | $240,000 | $170 | 66 |
| 807 Golf Ct | 0.09mi | 3/1.5 (+1) | 1,289 (-12%) | 6mo | $159,900 | $124 | 65 |
| 1934 Robcrest Way | 0.49mi | 3/2.0 (+1) | 1,402 (-4%) | 2mo | $250,000 | $178 | 64 |
| 1931 Eastmont Ln | 0.47mi | 3/2.0 (+1) | 1,439 (-1%) | 11mo | $245,000 | $170 | 62 |
| 803 Hackberry St | 0.18mi | 3/2.0 (+1) | 1,649 (+13%) | 4mo | $269,000 | $163 | 61 |
| 818 Overland St | 0.30mi | 3/2.0 (+1) | 1,624 (+12%) | 13mo | $175,000 | $108 | 51 |
| 1923 Tommy Ln | 0.32mi | 3/2.0 (+1) | 1,589 (+9%) | 18mo | $259,990 | $164 | 50 |
| 1702 Pecan Ln | 0.16mi | 3/1.5 (+1) | 1,287 (-12%) | 20mo | $185,000 | $144 | 49 |
| 914 Overland St | 0.34mi | 3/2.0 (+1) | 1,337 (-8%) | 20mo | $229,900 | $172 | 48 |
| 2003 5th St | 0.26mi | 3/2.0 (+1) | 1,667 (+14%) | 14mo | $210,000 | $126 | 47 |
| 1931 Skipwood Dr | 0.56mi | 3/2.0 (+1) | 1,672 (+15%) | 20mo | $259,000 | $155 | 28 |
| 1407 Ash Oak Dr | 0.69mi | 3/2.0 (+1) | 1,628 (+12%) | 20mo | $250,000 | $154 | 27 |
Match score weights: distance 35% · size 25% · config 20% · recency 20%. Top-matched comps best support the ARV.
Projected returns pro-forma
-0.55% appreciation · 0.34% rent growth · sell at horizon
- IRR
- 3.9%
- Equity multiple
- 1.17×
- Total profit
- $7,788
- Equity at exit
- $42,099
- IRR
- 7.7%
- Equity multiple
- 1.72×
- Total profit
- $32,085
- Equity at exit
- $47,244
Cash invested: $44,800 (down + closing). Projections, not guarantees.
Landlord ↔ Tenant lean methodology
- Overall (STATE)
- 87 Strongly Landlord-Friendly
- State Texas
- 87 Strongly Landlord-Friendly · R+5
- County
- — inherits STATE
- City
- — inherits STATE
ZIP-level market 77489
- Home prices YoY
- -0.2%
- Rents YoY
- 0.3%
- Active inventory
- 186
- Price-to-rent
- 7.2×
Monthly cashflow live
- Estimated rent
- $1,861 medium interval (Pro) →
- Mortgage (P&I)
- −$839
- Tax from tax record
- −$229 /mo · $2,747/yr
- Insurance
- −$67
- HOA
- −$0
- Vacancy / Maint / Mgmt
- −$391
- Net cashflow
- $336
Break-even live
UW: 25.0% down · 7.5% · 30yr · 1.5% tax · 5.0% vac · 8.0% maint · 8.0% mgmt
Financing live
Cash to close
- Down payment
- $40,000
- Closing costs
- $4,800
- Reserves months
- —
- Total cash needed
- —
Loan-product check · same deal, 3 products live
Conventional
25% down · 7.5% · 30yr
- Down + closing
- —
- Monthly P&I
- —
- Monthly cashflow
- —
- DSCR
- —
- Eligible?
- —
Personal DTI + credit; lowest rate.
DSCR
20% down · 8.5% · 30yr
- Down + closing
- —
- Monthly P&I
- —
- Monthly cashflow
- —
- DSCR
- —
- Eligible?
- —
No personal income docs; deal must DSCR.
Hard money
10% down · 12.0% · 12mo
- Down + closing
- —
- Monthly P&I
- —
- Monthly cashflow
- —
- DSCR
- —
- Eligible?
- —
Short-term bridge; refi at stabilization.
Rent comps 2 comps
| Address | Beds | Baths | Sqft | Rent | $/sqft | DOM | Units | Dist |
|---|---|---|---|---|---|---|---|---|
| 2026 Summer Place Dr Missouri City, TX | 3.0 | 2.0 | 1837 | $1,861 | $1.01 | 20d | 1 | 1.22mi |
| 1215 New Tree Ln Missouri City, TX | 3.0 | 2.0 | 1323 | $1,725 | $1.30 | 12d | 1 | 1.45mi |
Listing history 21 events
-
2026-06-18days on market $160,000 Active 482 DOM
-
2026-06-17days on market $160,000 Active 481 DOM
-
2026-06-16days on market $160,000 Active 480 DOM
-
2026-06-15days on market $160,000 Active 479 DOM
-
2026-06-13days on market $160,000 Active 477 DOM
-
2026-06-09days on market $160,000 Active 473 DOM
-
2026-06-07days on market $160,000 Active 471 DOM
-
2026-06-04days on market $160,000 Active 468 DOM
-
2026-06-03days on market $160,000 Active 467 DOM
-
2026-06-02days on market $160,000 Active 466 DOM
-
2026-06-01days on market $160,000 Active 465 DOM
-
2026-05-31days on market $160,000 Active 464 DOM
-
2026-03-09price $160,000
-
2025-03-01price $165,000
-
2025-02-21$150,000 Active
-
2025-02-03historical
-
2025-01-25$150,000 Active
-
2025-01-02historical $1,600
-
2024-12-19$1,600
-
2024-12-09historical $1,600
-
2024-10-28$1,600
ⓘ Source: listings_history table (triggers on properties + properties_extension) + one-shot
backfill from property_details.listing_events for pre-trigger history.
Tax reassessment forecast TX · Resets to sale price
- Current annual tax
- $2,747 · $229/mo
- Projected year-2 tax
- $2,928 · $244/mo
- Expected delta
- +$181/yr (+$15/mo · 6.6%)
ⓘ Screening estimate from a state-policy table — verify with the county assessor before closing.
Climate risk First Street
- Flood 6/10 Major FEMA zone X (unshaded) · 69% chance over 30 yrs
- Wildfire 3/10 Moderate
- Heat 9/10 Extreme 7 d/yr ≥110°F today · 23 d/yr by 30 yrs out
- Wind 9/10 Extreme 99% chance of damaging wind over 30 yrs
- Air quality 3/10 Moderate 2 unhealthy d/yr today · 3 by 30 yrs out
Nearby sold comps map
Loading sold comps map…
Walkable amenities ~0.75 mi
Loading nearby amenities…
Taxation est. · year 1
- Rental income
- $22,332
- − Mortgage interest
- −$8,962
- − Property taxes
- −$2,747
- − Insurance
- −$800
- − Repairs & maintenance
- −$1,787
- − Management
- −$1,787
- − Depreciation
- −$4,655
- Taxable income
- $1,595
- Est. tax owed @ 24.0%
- −$383
- After-tax cash flow
- $3,644/yr
For passive investors: Depreciation is non-cash, so a rental often shows a tax loss while cash-flowing — sheltering income. Rental losses are passive: they offset passive income freely, and up to $25,000/yr can offset ordinary (W-2) income if you actively participate and your MAGI is under $100k (phasing out to $0 by $150k); unused losses carry forward. On sale, claimed depreciation is recaptured at up to 25%, and gains may owe capital-gains tax (a 1031 exchange can defer both). Figures are a year-1 estimate at your 24.0% rate — not tax advice; consult a CPA.
Schools (NCES district)
- District
- Fort Bend ISD
- NCES district ID
- 4819650
- Math proficiency
- 44% ▼ -15.00%
- Reading proficiency
- 53% ▼ -4.00%
- Median HH income
- $82,360
- Composite
- 44.61/100
- National rank
- #2779
- State rank
- #140 of 826 in TX
Livability — Missouri City
- Score
- 67/100
- State rank
- #526
- US rank
- #10308
Category grades
Schools grade is shown separately in the Schools card above.
Census & demographics
- Census place
- Missouri City, TX
- County
- Fort Bend County · 836,777 people
- City population
- 123,513
- Metro
- Houston-The Woodlands-Sugar Land, TX
- Population (ZIP)
- 39,292
- Household income
- $74,689
- Rent vs Own
- Severe rent burden
- 1121.0
Population outlook (Fort Bend County) Hauer SSP2
- Today (2025)
- 1,004,526 people
- By 2030
- 1,153,104 · +14.8%
- By 2040
- 1,453,718 · +44.7%
- By 2050
- 1,753,781 · +74.6%
- By 2075
- 2,455,772 · +144.5%
- By 2100
- 2,930,528 · +191.7%
Race, ethnicity, and origin ACS 2023
- Neighborhood character
- Majority Black (60%)
- Race & ethnicity
- Black 60% Hispanic / Latino 29% Two or more races 13% White 4% Asian 3%
- Hispanic origin (detail)
- Mexican 17%
- Foreign-born
- 16% · Canada, Vietnam
- Languages at home
- 73% English-only · Spanish 22% Vietnamese 1% Other Asian/Pacific 1%
Political lean MEDSL · Fort Bend
- 2024 margin
- Toss-up / Even · D 49.5% · R 47.9% · Other 2.6%
- 2008→2024 swing
- +4.0pp toward D · 2008: -2.4pp · 2024: 1.6pp
- All cycles
- 2024: D+1.6 2020: D+10.6 2016: D+6.6 2012: R+6.8 2008: R+2.4
Not yet ingested
- Civics
- —
Market trends
- HPI YoY
- ▼ -0.55%
- Current HPI
- 288.1306
- Rent YoY
- ▲ 0.34%
- Metro
- Houston-The Woodlands-Sugar Land, TX
- State GDP YoY
- ▲ 3.95%
- F500 in state
- 110
Industry mix (Fortune 500 HQ in TX)
| Industry | F500 HQs | Revenue |
|---|---|---|
| Energy | 16 | $1,198B |
|
||
| Technology | 5 | $198B |
|
||
| Engineering / Construction | 4 | $72B |
|
||
| Energy Services | 3 | $60B |
|
||
| Utilities | 3 | $41B |
|
||
| Healthcare | 2 | $330B |
|
||
Price history
+9900.0% since first listed9 events — show timeline
- 2026-03-09 Price Changed $160,000 HARMLS
- 2025-03-01 Price Changed $165,000 HARMLS
- 2025-02-21 Listed $150,000 HARMLS
- 2025-02-03 Listing Removed — HARMLS
- 2025-01-25 Listed $150,000 HARMLS
- 2025-01-02 Rental Removed $1,600 HARMLS
- 2024-12-19 Listed for Rent $1,600 HARMLS
- 2024-12-09 Rental Removed $1,600 HARMLS
- 2024-10-28 Listed for Rent $1,600 HARMLS
Property tax history
+3.7%/yrLatest (2025): $2,747 · -4.0% YoY. Source: county tax records.
Cash-flow waterfall
monthlySold comps — $/sqft
last 12 mo · ≤1 miLoading sold comps…