 🏷️ Likely Rental
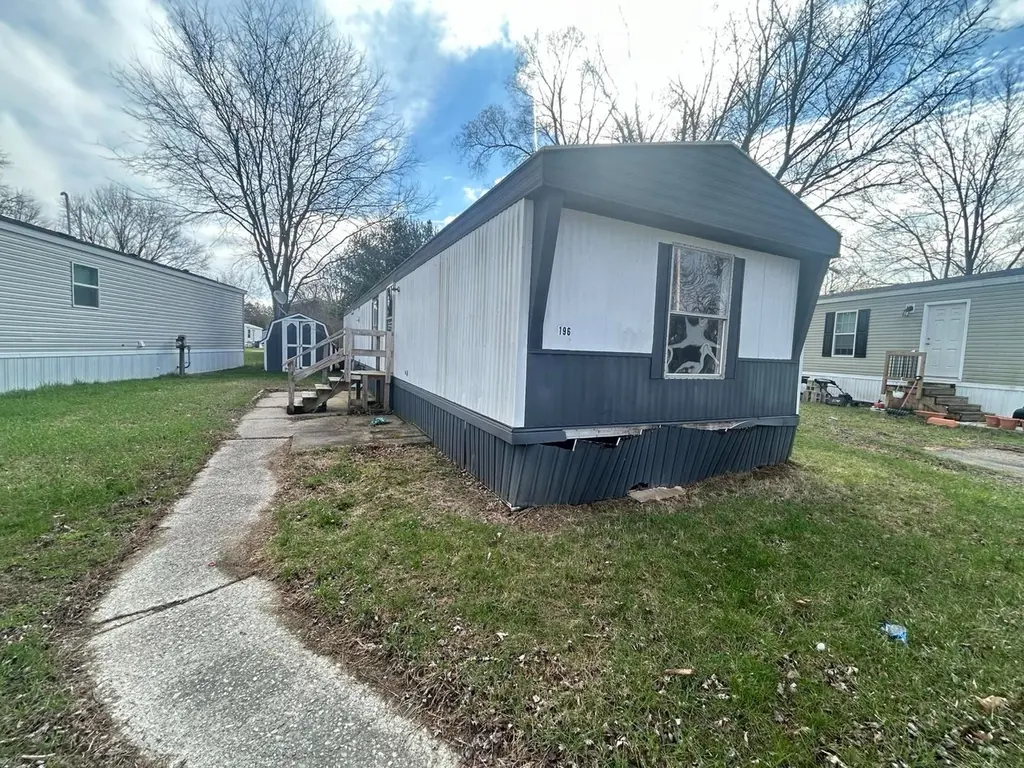
7519 Dorr St #196 · Toledo, OH
Flood risk 1/10 · Minimal
- FEMA flood zone
- X (unshaded)
- Chance of flooding over 30 yrs
- 0.0%
- Est. flood insurance / yr
- $507 – $1,088
Fire risk 1/10 · Minimal
- Est. fire insurance / yr
- $713 – $1,323
Heat risk 3/10 · Minor
- Hot days now (above 99°F)
- 7 days/yr
- Hot days in 30 yrs
- 16 days/yr
Wind risk 2/10 · Minimal
- Chance of severe wind over 30 yrs
- —
Air-quality risk 2/10 · Minimal
- Unhealthy air days now
- 1 days/yr
- Unhealthy air days in 30 yrs
- 2 days/yr
Risk factors via First Street. Map © Google.
Why this score? — see what drove the D+ grade
The composite is a weighted blend of 9 inputs, each scored 0–100. Each bar is that input's sub-score; the figure is the points it added to the 100-point composite (weight × sub-score).
- Cash flow +15.0/30.0
- ARV discount +7.5/15.0
- 1% rule +5.0/10.0
- DSCR +5.0/10.0
- Schools +4.5/10.0
- Livability +3.3/5.0
- Rent growth +3.1/5.0
- Condition / age +2.5/5.0
- Appreciation +0.0/10.0
$5,500
🖨 Deal sheet 📄 Offer letter ✓ Due diligence
Listing remarks
This 2-bedroom, 2-bathroom manufactured home in Royal Village in Toledo, Ohio is a great opportunity for the right buyer looking for a fixer-upper. Built in 1988, this Beacon Prestige model offers solid potential for renovation and customization. With two full bathrooms and a functional layout, this home provides a strong foundation for someone handy or an investor looking to add value. It is being offered as-is and will require repairs and updates, making it an ideal handyman special at an affordable price point. Located in the Royal Village community, this property offers convenient access to local shopping, dining, and major roadways in Toledo, OH. If you're looking for a project with up
Key facts
- Strong foundation
- Convenient access
- Built 2026
Tags
Property features AI
Finance
- Other: Address: 7519 Dorr St #196, Toledo, OH 43615
- Financial info: List price: 5,500
Exterior
- Utilities: Has heating
- Home design: Manufactured home model: Cavco Beacon Prestige; Spec inventory unit
- Construction: Living area approximately 1,150 (interior size provided)
- Exterior features: Shake roof
Interior
- Bedrooms: 2 bedrooms
- Bathrooms: 2 bathrooms (total)
- Heating & cooling: Forced air heating; Other heating type
- Interior features: Active listing (spec new construction model: Cavco Beacon Prestige)
Neighborhood map
What this means for you Summary
Snapshot
- This is a 2-bed/2.0-bath single-family listed at $6k.
Deal economics
- At list price, monthly cash flow is $864 ($10k/yr) — positive.
- The deal already cash-flows at list — no discount required.
- Meets the 1% rule at list price ($1k rent vs $6k).
- Recommended offer: $5k (6.0% below list) — sets the bar for market timing.
- Cap rate 194.8% vs local median 7.6% in Toledo — top-decile yield for the area; either an underpriced asset or a hidden risk that comps aren't pricing in. Stress-test before assuming the spread holds.
Location & tenants
- Location reads 66/100 on livability (#645 in OH) — a middle-class / working-renter tenant base. Strengths: cost of living A+, housing A+, health & safety A+; Watch: amenities C-, schools D-, crime F.
- Springfield Local (suburban): math 47% / reading 57% proficiency, ranked #404 of 656 in OH (top 62%) — acceptable for families but not a draw, mixed tenant base, ~2y average lease.
- Market conditions: Rents rising (+2.6%/yr); 114 active listings in the ZIP; 8 comparable units currently listed for rent nearby; rentals leasing fast (median 14d on market — plan ~1-2 weeks tenant-placement turnaround); 415 units permitted in Lucas County in 2024 (122 in 5+ unit buildings).
Forward outlook
- Local home prices are declining (-3.0%/yr); year-one equity from $38 of loan paydown is wiped out by about $165 of value loss. Plan a longer hold.
- Lucas County population projected at -16% by 2050 — secular population decline; favor cash flow + early exit over multi-decade hold.
- At projected returns (-3.0% appreciation + 2.6% rent growth), your $2k cash investment doubles in ~1 year — after that, you're playing with house money.
Negotiation context
- It's been on market 64 days — a 6% lower offer ($5k) is reasonable based on typical stale-listing flexibility.
Questions for the listing agent
- It's been on market 64 days. Have you received any prior offers? Is the seller open to a 6% concession, seller financing, or rate buy-down credit?
- Why hasn't it sold? Are there any deal-killer items the seller is aware of (foundation, flood, title, zoning, code violations)?
- Is there a deadline driving the sale (1031 exchange, divorce, estate, relocation)? That informs how much negotiation room exists.
- Schools are D-rated, which usually means shorter tenancies and higher turnover. Who's the typical renter profile here, and what's been the actual vacancy rate?
- Crime grade is F in this area — have there been break-ins, vandalism, or insurance claims at this property in the last 3 years? What carrier currently insures it and at what premium?
- The area grade is low — what's the realistic commute time and amenity access for the typical tenant pool here? Any planned neighborhood developments (good or bad) we should know about?
- What's the average days-on-market for RENTAL listings here right now (not sales)? A rising rental-DOM trend means longer vacancies and softer asking-rent achievability than the comps imply.
- What's the recent tenant-quality profile in this submarket — average credit score on applications, eviction rate, late-payment / NSF rate, and stable-employment percentage? A property-management company in the area should have these aggregated.
- How much new for-sale + rental construction is in the pipeline within 1–3 miles? Heavy new supply typically softens prices + rents 12–24 months out; constrained supply supports both.
Investment metrics
- 1% rule
- 20.76% ✓
- Cap rate
- 194.79%
- Cash-on-cash
- 673.22%
- DSCR
- 30.95
- GRM
- 0.4
CMA / ARV
- ARV (on-the-fly)
- $151,800
- Comps found
- 8
Show comp detail 8 sales within ~0.75 mi
| Address | Dist | Beds/Ba | Sqft | Sold | Price | $/sf | Match |
|---|---|---|---|---|---|---|---|
| 250 Bonaparte Dr | 0.69mi | 3/1.5 (+1) | 1,152 (+0%) | 4mo | $172,900 | $150 | 57 |
| 216 Bonaparte Dr | 0.70mi | 2/1.0 | 1,104 (-4%) | 1mo | $146,000 | $132 | 56 |
| 6339 Hill Ave | 0.69mi | 2/1.0 | 1,100 (-4%) | 4mo | $125,000 | $114 | 53 |
| 34 Hilton Dr | 0.61mi | 3/1.5 (+1) | 1,176 (+2%) | 23mo | $175,000 | $149 | 42 |
| 247 Deigle Dr | 0.72mi | 2/1.0 | 1,000 (-13%) | 2mo | $112,500 | $113 | 39 |
| 6348 Hill Ave | 0.66mi | 2/1.0 | 1,288 (+12%) | 15mo | $168,000 | $130 | 33 |
| 28 Hilton Dr | 0.62mi | 3/1.0 (+1) | 1,290 (+12%) | 14mo | $170,000 | $132 | 30 |
| 116 Lancaster Ave | 0.71mi | 2/1.0 | 1,296 (+13%) | 17mo | $93,800 | $72 | 27 |
Match score weights: distance 35% · size 25% · config 20% · recency 20%. Top-matched comps best support the ARV.
Projected returns pro-forma
-3.0% appreciation · 2.59% rent growth · sell at horizon
- IRR
- —
- Equity multiple
- 35.86×
- Total profit
- $53,683
- Equity at exit
- $820
- IRR
- —
- Equity multiple
- 76.17×
- Total profit
- $115,763
- Equity at exit
- $476
Cash invested: $1,540 (down + closing). Projections, not guarantees.
Landlord ↔ Tenant lean methodology
- Overall (STATE)
- 73 Landlord-Friendly
- State Ohio
- 73 Landlord-Friendly · R+6
- County
- — inherits STATE
- City
- — inherits STATE
ZIP-level market 43615
- Home prices YoY
- -31.9%
- Rents YoY
- 2.6%
- Active inventory
- 114
- Price-to-rent
- 0.4×
Monthly cashflow live
- Estimated rent
- $1,142 high interval (Pro) →
- Mortgage (P&I)
- −$29
- Tax est. 1.5%
- −$7 /mo · $82/yr
- Insurance
- −$2
- HOA
- −$0
- Vacancy / Maint / Mgmt
- −$240
- Net cashflow
- $864
Break-even live
UW: 25.0% down · 7.5% · 30yr · 1.5% tax · 5.0% vac · 8.0% maint · 8.0% mgmt
Financing live
Cash to close
- Down payment
- $1,375
- Closing costs
- $165
- Reserves months
- —
- Total cash needed
- —
Loan-product check · same deal, 3 products live
Conventional
25% down · 7.5% · 30yr
- Down + closing
- —
- Monthly P&I
- —
- Monthly cashflow
- —
- DSCR
- —
- Eligible?
- —
Personal DTI + credit; lowest rate.
DSCR
20% down · 8.5% · 30yr
- Down + closing
- —
- Monthly P&I
- —
- Monthly cashflow
- —
- DSCR
- —
- Eligible?
- —
No personal income docs; deal must DSCR.
Hard money
10% down · 12.0% · 12mo
- Down + closing
- —
- Monthly P&I
- —
- Monthly cashflow
- —
- DSCR
- —
- Eligible?
- —
Short-term bridge; refi at stabilization.
Rent comps 8 comps
| Address | Beds | Baths | Sqft | Rent | $/sqft | DOM | Units | Dist |
|---|---|---|---|---|---|---|---|---|
| 6535 Dorr St Toledo, OH | 1.0–2.0 | 1.0–2.0 | 895 | $1,000 | $1.12 | 21d | 1 | 0.72mi |
| 1210 Country View Pl Toledo, OH | 2.0 | 1.0–2.0 | 966 | $1,130 | $1.17 | 13d | 1 | 0.75mi |
| 1800 N McCord Rd Toledo, OH | 2.0 | 1.0 | 934 | $900 | $0.96 | 13d | 1 | 0.98mi |
| 2150 N McCord Rd Toledo, OH | 1.0–2.0 | 1.0 | 765 | $1,315 | $1.72 | 13d | 6 | 1.01mi |
| 6633 W Bancroft St Toledo, OH | 1.0–3.0 | 1.0 | 941 | $954 | $1.01 | 13d | 1 | 1.11mi |
| 2130 Country Trace Pl Toledo, OH | 2.0 | 1.0–2.0 | 917 | $1,050 | $1.14 | 13d | 1 | 1.12mi |
| 1230 Bedford Woods Dr Unit DR-8 Toledo, OH | 2.0 | 1.0 | 756 | $850 | $1.12 | 43d | 1 | 1.17mi |
| 1009 N Holland Sylvania Rd Toledo, OH | 2.0–3.0 | 1.0–2.0 | 1130 | $1,271 | $1.12 | 13d | 21 | 1.20mi |
Listing history 13 events
-
2026-06-17days on market $5,500 Active 64 DOM
-
2026-06-16days on market $5,500 Active 63 DOM
-
2026-06-15days on market $5,500 Active 62 DOM
-
2026-06-14days on market $5,500 Active 60 DOM
-
2026-06-10days on market $5,500 Active 57 DOM
-
2026-06-09days on market $5,500 Active 56 DOM
-
2026-06-08days on market $5,500 Active 55 DOM
-
2026-06-07days on market $5,500 Active 54 DOM
-
2026-06-03days on market $5,500 Active 50 DOM
-
2026-06-02days on market $5,500 Active 49 DOM
-
2026-06-01days on market $5,500 Active 48 DOM
-
2026-05-31days on market $5,500 Active 47 DOM
-
2026-05-30days on market $5,500 Active 46 DOM
ⓘ Source: listings_history table (triggers on properties + properties_extension) + one-shot
backfill from property_details.listing_events for pre-trigger history.
Climate risk First Street
- Flood 1/10 Low FEMA zone X (unshaded) · 0% chance over 30 yrs
- Wildfire 1/10 Low
- Heat 3/10 Moderate 7 d/yr ≥99°F today · 16 d/yr by 30 yrs out
- Wind 2/10 Low
- Air quality 2/10 Low 1 unhealthy d/yr today · 2 by 30 yrs out
Nearby sold comps map
Loading sold comps map…
Walkable amenities ~0.75 mi
Loading nearby amenities…
Taxation est. · year 1
- Rental income
- $13,701
- − Mortgage interest
- −$308
- − Property taxes
- −$82
- − Insurance
- −$28
- − Repairs & maintenance
- −$1,096
- − Management
- −$1,096
- − Depreciation
- −$160
- Taxable income
- $10,931
- Est. tax owed @ 24.0%
- −$2,623
- After-tax cash flow
- $7,744/yr
For passive investors: Depreciation is non-cash, so a rental often shows a tax loss while cash-flowing — sheltering income. Rental losses are passive: they offset passive income freely, and up to $25,000/yr can offset ordinary (W-2) income if you actively participate and your MAGI is under $100k (phasing out to $0 by $150k); unused losses carry forward. On sale, claimed depreciation is recaptured at up to 25%, and gains may owe capital-gains tax (a 1031 exchange can defer both). Figures are a year-1 estimate at your 24.0% rate — not tax advice; consult a CPA.
Schools (NCES district)
- District
- Springfield Local
- NCES district ID
- 3904822
- Math proficiency
- 47% ▼ -17.00%
- Reading proficiency
- 57% ▼ -11.00%
- Median HH income
- $54,807
- Composite
- 44.87/100
- National rank
- #2719
- State rank
- #404 of 656 in OH
Livability — Toledo
- Score
- 66/100
- State rank
- #645
- US rank
- #11442
Category grades
Schools grade is shown separately in the Schools card above.
Census & demographics
- County
- Lucas County · 380,724 people
- City population
- 280,811
- Metro
- Toledo, OH
- Population (ZIP)
- 40,146
- Household income
- $57,713
- Rent vs Own
- Severe rent burden
- 1683.0
Population outlook (Lucas County) Hauer SSP2
- Today (2025)
- 420,751 people
- By 2030
- 410,187 · -2.5%
- By 2040
- 384,019 · -8.7%
- By 2050
- 355,125 · -15.6%
- By 2075
- 291,683 · -30.7%
- By 2100
- 233,670 · -44.5%
Race, ethnicity, and origin ACS 2023
- Neighborhood character
- Majority White (62%)
- Race & ethnicity
- White 62% Black 26% Two or more races 6% Hispanic / Latino 4% Asian 3%
- Common ancestry
- Romanian 7% Lithuanian 3% Slovak 2%
- Foreign-born
- 5% · China, Canada
- Languages at home
- 93% English-only · Arabic 2% Spanish 1% Chinese 1%
Political lean MEDSL · Lucas
- 2024 margin
- D (+12.6) · D 55.8% · R 43.2%
- 2008→2024 swing
- -18.9pp toward R · 2008: 31.4pp · 2024: 12.6pp
- All cycles
- 2024: D+12.6 2020: D+16.8 2016: D+17.4 2012: D+30.4 2008: D+31.4
Not yet ingested
- Civics
- —
Market trends
- HPI YoY
- ▼ -96.44%
- Current HPI
- 205.95
- Rent YoY
- ▲ 2.59%
- Metro
- Toledo, OH
- State GDP YoY
- ▲ 1.98%
- F500 in state
- 48
Industry mix (Fortune 500 HQ in OH)
| Industry | F500 HQs | Revenue |
|---|---|---|
| Insurance | 3 | $145B |
|
||
| Industrial Machinery | 3 | $49B |
|
||
| Financial Services | 3 | $24B |
|
||
| Consumer Goods | 2 | $93B |
|
||
| Aerospace / Defense | 2 | $47B |
|
||
| Utilities | 2 | $33B |
|
||
Cash-flow waterfall
monthlySold comps — $/sqft
last 12 mo · ≤1 miLoading sold comps…