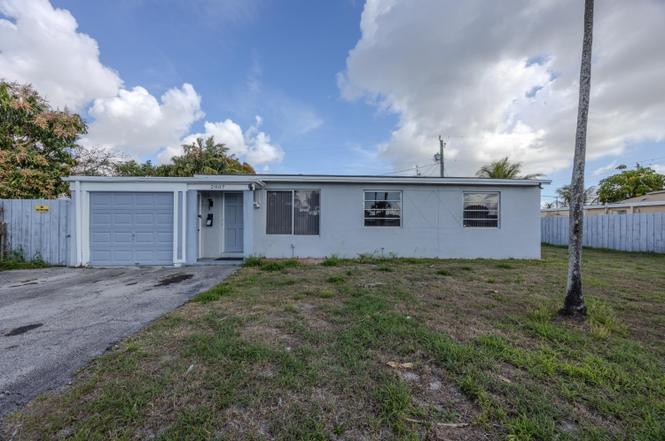
2007 Kenwood Rd · West Palm Beach, FL
Flood risk 4/10 · Minor
- FEMA flood zone
- X (unshaded)
- Chance of flooding over 30 yrs
- 0.22%
- Est. flood insurance / yr
- $507 – $1,088
Fire risk 1/10 · Minimal
- Est. fire insurance / yr
- $947 – $1,759
Heat risk 10/10 · Severe
- Hot days now (above 105°F)
- 7 days/yr
- Hot days in 30 yrs
- 25 days/yr
Wind risk 10/10 · Severe
- Chance of severe wind over 30 yrs
- 99.0%
Air-quality risk 2/10 · Minimal
- Unhealthy air days now
- 1 days/yr
- Unhealthy air days in 30 yrs
- 1 days/yr
Risk factors via First Street. Map © Google.
Why this score? — see what drove the D grade
The composite is a weighted blend of 9 inputs, each scored 0–100. Each bar is that input's sub-score; the figure is the points it added to the 100-point composite (weight × sub-score).
- Cash flow +12.5/30.0
- ARV discount +7.5/15.0
- Schools +4.3/10.0
- Livability +4.1/5.0
- DSCR +3.7/10.0
- 1% rule +3.3/10.0
- Rent growth +2.5/5.0
- Condition / age +2.5/5.0
- Appreciation +0.0/10.0
$425,000
🖨 Deal sheet 📄 Offer letter ✓ Due diligence
Listing remarks
Beautifully renovated Palm Beach home with no association fees! This charming property features a large yard with both back and side space, perfect for entertaining, gardening, or storing recreational equipment. Inside, you'll find a beautifully updated kitchen, tiled floors, a convenient laundry area, one car garage, and a bright Florida room that adds extra living space. The home also offers a spacious patio ideal for outdoor dining and grilling. Conveniently located just minutes from I-95, the beach, and the airport, making commuting and travel easy while still enjoying the comfort of a quiet residential setting. A fantastic opportunity to own a move in ready home in Palm Beach with no H
Key facts
- Laundry area
- Large yard
- Florida room
Tags
Property features AI
Finance
- Other: Pets allowed with no restrictions
Exterior
- Parking: 3 total parking spaces; Attached 1-car garage; 1 covered space; Carport listed
- Utilities: Public water; Public sewer; Electricity connected; Cable available; Water available; Sewer connected
- Home design: Single family residence; Resale property; South-facing; Single-story
- Construction: Concrete construction; Shingle roof
- Exterior features: Open patio; Patio; Back yard fencing; Gate; Not waterfront
Interior
- Kitchen: Dishwasher
- Bedrooms: 3 bedrooms on the main level
- Flooring: Ceramic tile
- Bathrooms: 1 full bathroom (main level)
- Heating & cooling: Central heating; Central air conditioning
- Interior features: No special interior features listed; Unfurnished
- Laundry & utility: No specific laundry appliances listed
Neighborhood map
What this means for you Summary
Snapshot
- This is a 3-bed/1.0-bath single-family listed at $425k.
Deal economics
- At list price, monthly cash flow is $-63 ($-753/yr) — negative.
- To cash-flow at today's rent, offer at most $414k (2.6% below list).
- To meet the 1% rule (rent ≥ 1% of price), the offer needs to be $353k (16.9% below list).
- Recommended offer: $353k (16.9% below list) — sets the bar for 1% rule.
- Cap rate 6.1% vs local median 3.8% in West Palm Beach — top-decile yield for the area; either an underpriced asset or a hidden risk that comps aren't pricing in. Stress-test before assuming the spread holds.
Location & tenants
- Location reads 82/100 on livability (#75 in FL, #1,255 nationally) — a professional / high-income tenant draw. Strengths: commute A+, housing A+, health & safety A+; Watch: employment C-, crime F.
- Palm Beach (suburban): math 46% / reading 53% proficiency, ranked #34 of 73 in FL (top 47%) — families likely to look elsewhere, expect single-tenant / working-renter base with shorter leases.
- Zoned schools: Belvedere Elementary School (math 33% / reading 37%, grade F, #1,697 of 2,144 statewide, top 80%, 477 students, 79% FRL); Jeaga Middle School (math 18% / reading 30%, grade F, #532 of 571 statewide, top 94%, 941 students, 78% FRL); Palm Beach Lakes High School (math 17% / reading 26%, grade F, #546 of 667 statewide, top 82%, 2,688 students, 70% FRL) — zoned schools average 76% FRL vs 52% district-wide (24 pts higher); higher-poverty schools than district average — tighter screening recommended.
- Zoned-school proficiency averages 27% at this address vs 50% district-wide (-23 pts) — the specific schools serving this property underperform the Palm Beach average; the district grade overstates school quality for this exact location.
- Market conditions: Rents soft (-0.1%/yr); 189 active listings in the ZIP; 33 comparable units currently listed for rent nearby; rentals at typical pace (median 21d on market — plan ~3-4 weeks tenant-placement turnaround); 3,974 units permitted in Palm Beach County in 2024 (1,012 in 5+ unit buildings).
- At $3,534/mo this rent would consume 63% of the median local household income ($67k/yr) (locally 1333% of renters already pay >50% of income on rent) — very limited rent-growth headroom before tenants either downsize or default.
Forward outlook
- Local home prices are declining (-3.0%/yr); year-one equity from $3k of loan paydown is wiped out by about $13k of value loss. Plan a longer hold.
- Palm Beach County population projected at +30% by 2050 — long-run rental-demand tailwind backs the buy-and-hold thesis.
Negotiation context
- It's been on market 59 days — a 3% lower offer ($412k) is reasonable based on typical stale-listing flexibility.
- Current owner paid $56k; list at $425k implies a 666% gain — meaningful room to come down on a strong offer.
Risks & watch-outs
- Watch-outs: built in 1959 — expect roof / HVAC / electrical / plumbing capex.
- Climate carrying-cost: severe wind risk, 99% chance of damaging wind over 30y; extreme-heat days projected 7→25/yr by 2055 (HVAC capex compounding) — expect insurance premiums to compound above CPI over the hold.
Questions for the listing agent
- What do current leases actually rent for vs. the listed asking? Can we see a recent rent roll and the last 12 months of T-12 income?
- It's been on market 59 days. Have you received any prior offers? Is the seller open to a 17% concession, seller financing, or rate buy-down credit?
- Built in 1959 — when were the roof, HVAC, electrical panel, plumbing, and water heater last replaced?
- Is there a deadline driving the sale (1031 exchange, divorce, estate, relocation)? That informs how much negotiation room exists.
- Crime grade is F in this area — have there been break-ins, vandalism, or insurance claims at this property in the last 3 years? What carrier currently insures it and at what premium?
- The area grade is low — what's the realistic commute time and amenity access for the typical tenant pool here? Any planned neighborhood developments (good or bad) we should know about?
- What's the average days-on-market for RENTAL listings here right now (not sales)? A rising rental-DOM trend means longer vacancies and softer asking-rent achievability than the comps imply.
- What's the recent tenant-quality profile in this submarket — average credit score on applications, eviction rate, late-payment / NSF rate, and stable-employment percentage? A property-management company in the area should have these aggregated.
- How much new for-sale + rental construction is in the pipeline within 1–3 miles? Heavy new supply typically softens prices + rents 12–24 months out; constrained supply supports both.
Investment metrics
- 1% rule
- 0.83% ✗
- Cap rate
- 6.12%
- Cash-on-cash
- -0.63%
- DSCR
- 0.97
- GRM
- 10.0
CMA / ARV
No comps found within radius.
Projected returns pro-forma
-3.0% appreciation · 0.0% rent growth · sell at horizon
- IRR
- -20.7%
- Equity multiple
- 0.30×
- Total profit
- $-83,217
- Equity at exit
- $63,369
- IRR
- -22.3%
- Equity multiple
- 0.01×
- Total profit
- $-117,620
- Equity at exit
- $36,746
Cash invested: $119,000 (down + closing). Projections, not guarantees.
Landlord ↔ Tenant lean methodology
- Overall (STATE)
- 87 Strongly Landlord-Friendly
- State Florida
- 87 Strongly Landlord-Friendly · R+3
- County
- — inherits STATE
- City
- — inherits STATE
ZIP-level market 33409
- Home prices YoY
- -25.6%
- Rents YoY
- -0.1%
- Active inventory
- 189
- Price-to-rent
- 10.0×
Monthly cashflow live
- Estimated rent
- $3,534 high interval (Pro) →
- Mortgage (P&I)
- −$2,229
- Tax from tax record
- −$449 /mo · $5,383/yr
- Insurance
- −$177
- HOA
- −$0
- Vacancy / Maint / Mgmt
- −$742
- Net cashflow
- $-63
Break-even live
UW: 25.0% down · 7.5% · 30yr · 1.5% tax · 5.0% vac · 8.0% maint · 8.0% mgmt
Financing live
Cash to close
- Down payment
- $106,250
- Closing costs
- $12,750
- Reserves months
- —
- Total cash needed
- —
Loan-product check · same deal, 3 products live
Conventional
25% down · 7.5% · 30yr
- Down + closing
- —
- Monthly P&I
- —
- Monthly cashflow
- —
- DSCR
- —
- Eligible?
- —
Personal DTI + credit; lowest rate.
DSCR
20% down · 8.5% · 30yr
- Down + closing
- —
- Monthly P&I
- —
- Monthly cashflow
- —
- DSCR
- —
- Eligible?
- —
No personal income docs; deal must DSCR.
Hard money
10% down · 12.0% · 12mo
- Down + closing
- —
- Monthly P&I
- —
- Monthly cashflow
- —
- DSCR
- —
- Eligible?
- —
Short-term bridge; refi at stabilization.
Rent comps 33 comps
| Address | Beds | Baths | Sqft | Rent | $/sqft | DOM | Units | Dist |
|---|---|---|---|---|---|---|---|---|
| 2018 Whitney Rd West Palm Beach, FL | 3.0 | 2.0 | 1169 | $3,200 | $2.74 | 10d | 1 | 0.05mi |
| 2016 Kenwood Rd West Palm Beach, FL | 4.0 | 2.0 | 1172 | $3,900 | $3.33 | 19d | 1 | 0.06mi |
| 2117 Longwood Rd West Palm Beach, FL | 4.0 | 2.0 | 1112 | $5,000 | $4.50 | 24d | 1 | 0.25mi |
| 1500 Centrepark Blvd West Palm Beach, FL | 2.0 | 1.0–2.0 | 862 | $3,002 | $3.48 | 1d | 18 | 0.30mi |
| 1050 Blanche St West Palm Beach, FL | 2.0 | 1.0–2.0 | 740 | $3,374 | $4.56 | 2d | 8 | 0.86mi |
| 1911 Parker Ave West Palm Beach, FL | 2.0 | 2.0 | 1135 | $14,000 | $12.33 | 24d | 1 | 1.03mi |
| 904 Ortega Rd West Palm Beach, FL | 3.0 | 1.0 | 910 | $3,500 | $3.85 | 5d | 1 | 1.05mi |
| 833 Ardmore Rd West Palm Beach, FL | 3.0 | 2.5 | 1132 | $4,500 | $3.98 | 16d | 1 | 1.08mi |
| 833 Ardmore Rd West Palm Beach, FL | 3.0 | 2.5 | 1132 | $4,500 | $3.98 | 15d | 1 | 1.08mi |
| 2615 Hiawatha Ave West Palm Beach, FL | 3.0 | 2.0 | 1276 | $2,950 | $2.31 | 2d | 1 | 1.08mi |
| 2665 Hiawatha Ave West Palm Beach, FL | 3.0 | 2.0 | 1276 | $3,005 | $2.36 | 24d | 1 | 1.09mi |
| 2671 Hiawatha Ave West Palm Beach, FL | 3.0 | 2.0 | 1276 | $3,005 | $2.36 | 24d | 1 | 1.09mi |
| 2677 Hiawatha Ave West Palm Beach, FL | 3.0 | 2.0 | 1276 | $3,005 | $2.36 | 24d | 1 | 1.10mi |
| 2683 Hiawatha Ave West Palm Beach, FL | 3.0 | 2.0 | 1276 | $3,005 | $2.36 | 24d | 1 | 1.10mi |
| 2689 Hiawatha Ave West Palm Beach, FL | 3.0 | 2.0 | 1276 | $2,950 | $2.31 | 2d | 1 | 1.11mi |
| 616 Upland Rd West Palm Beach, FL | 3.0 | 2.0 | 1456 | $4,500 | $3.09 | 24d | 1 | 1.31mi |
| 616 Upland Rd West Palm Beach, FL | 3.0 | 2.0 | 1456 | $4,500 | $3.09 | 20d | 1 | 1.31mi |
| 616 Clearwater Park Rd West Palm Beach, FL | 2.0 | 2.0 | 1112 | $3,348 | $3.01 | 5d | 2 | 1.35mi |
| 616 Clearwater Park Rd West Palm Beach, FL | 2.0 | 2.0 | 1090 | $3,348 | $3.07 | 13d | 2 | 1.35mi |
| 616 Clearwater Park Rd West Palm Beach, FL | 2.0 | 2.0 | 1090 | $3,248 | $2.98 | 11d | 3 | 1.35mi |
| 616 Clearwater Park Rd West Palm Beach, FL | 2.0 | 2.0 | 1130 | $3,245 | $2.87 | 2d | 3 | 1.35mi |
| 605 Sunset Rd West Palm Beach, FL | 3.0 | 2.0 | 1434 | $4,000 | $2.79 | 24d | 1 | 1.35mi |
| 1713 Florida Ave Unit A2 West Palm Beach, FL | 2.0 | 1.0 | 888 | $3,500 | $3.94 | 24d | 1 | 1.36mi |
| 616 Clearwater Park Rd Unit Lp01 West Palm Beach, FL | 2.0 | 2.0 | 1112 | $3,495 | $3.14 | 24d | 1 | 1.37mi |
| 712 Tuscaloosa St West Palm Beach, FL | 4.0 | 2.0 | 1390 | $4,495 | $3.23 | 24d | 1 | 1.38mi |
| 604 Piedmont Rd West Palm Beach, FL | 4.0 | 2.0 | 1329 | $3,500 | $2.63 | 7d | 1 | 1.44mi |
| 3331 Lake Ave West Palm Beach, FL | 2.0 | 1.0 | 775 | $3,500 | $4.52 | 24d | 1 | 1.45mi |
| 110 Wilson Rd West Palm Beach, FL | 3.0 | 1.0 | 1433 | $8,000 | $5.58 | 24d | 1 | 1.47mi |
| 300 S Australian Ave #419 West Palm Beach, FL | 2.0 | 2.0 | 1186 | $3,750 | $3.16 | 16d | 1 | 1.48mi |
| 300 S Australian Ave #1608 West Palm Beach, FL | 2.0 | 2.0 | 1085 | $6,000 | $5.53 | 24d | 1 | 1.48mi |
| 300 S Australian Ave West Palm Beach, FL | 3.0 | 2.0 | 1377 | $6,000 | $4.36 | 24d | 1 | 1.48mi |
| 300 S Australian Ave #1605 West Palm Beach, FL | 3.0 | 2.0 | 1188 | $4,800 | $4.04 | 24d | 1 | 1.48mi |
| 290 Courtney Lakes Cir West Palm Beach, FL | 1.0–3.0 | 1.0–2.0 | 1069 | $3,250 | $3.04 | 19d | 19 | 1.49mi |
Listing history 3 events
-
2026-05-11status Pending
-
2026-03-12$425,000 Active
-
1986-07-01soldstatus $55,500
ⓘ Source: listings_history table (triggers on properties + properties_extension) + one-shot
backfill from property_details.listing_events for pre-trigger history.
Tax reassessment forecast FL · Resets to sale price
- Current annual tax
- $5,383 · $449/mo
- Projected year-2 tax
- $5,383 · $449/mo
- Expected delta
- $0/yr ($0/mo · 0.0%)
ⓘ Screening estimate from a state-policy table — verify with the county assessor before closing.
Climate risk First Street
- Flood 4/10 Moderate FEMA zone X (unshaded) · 22% chance over 30 yrs
- Wildfire 1/10 Low
- Heat 10/10 Extreme 7 d/yr ≥105°F today · 25 d/yr by 30 yrs out
- Wind 10/10 Extreme 99% chance of damaging wind over 30 yrs
- Air quality 2/10 Low 1 unhealthy d/yr today · 1 by 30 yrs out
Nearby sold comps map
Loading sold comps map…
Walkable amenities ~0.75 mi
Loading nearby amenities…
Taxation est. · year 1
- Rental income
- $42,406
- − Mortgage interest
- −$23,807
- − Property taxes
- −$5,383
- − Insurance
- −$2,125
- − Repairs & maintenance
- −$3,392
- − Management
- −$3,392
- − Depreciation
- −$12,364
- Taxable loss
- −$8,058
- Est. tax savings @ 24.0%
- +$1,934
- After-tax cash flow
- $1,181/yr
For passive investors: Depreciation is non-cash, so a rental often shows a tax loss while cash-flowing — sheltering income. Rental losses are passive: they offset passive income freely, and up to $25,000/yr can offset ordinary (W-2) income if you actively participate and your MAGI is under $100k (phasing out to $0 by $150k); unused losses carry forward. On sale, claimed depreciation is recaptured at up to 25%, and gains may owe capital-gains tax (a 1031 exchange can defer both). Figures are a year-1 estimate at your 24.0% rate — not tax advice; consult a CPA.
Schools (NCES district)
- District
- Palm Beach
- NCES district ID
- 1201500
- Math proficiency
- 46% ▼ -16.00%
- Reading proficiency
- 53% ▼ -4.00%
- Median HH income
- $53,943
- Composite
- 42.72/100
- National rank
- #3160
- State rank
- #34 of 73 in FL
Livability — West Palm Beach
- Score
- 82/100
- State rank
- #75
- US rank
- #1255
Category grades
Schools grade is shown separately in the Schools card above.
Census & demographics
- County
- Palm Beach County · 1,438,312 people
- City population
- 222,012
- Metro
- Miami-Fort Lauderdale-Pompano Beach, FL
- Population (ZIP)
- 33,489
- Household income
- $67,073
- Rent vs Own
- Severe rent burden
- 1333.0
Population outlook (Palm Beach County) Hauer SSP2
- Today (2025)
- 1,637,487 people
- By 2030
- 1,743,255 · +6.5%
- By 2040
- 1,948,712 · +19.0%
- By 2050
- 2,132,979 · +30.3%
- By 2075
- 2,530,027 · +54.5%
- By 2100
- 2,706,979 · +65.3%
Race, ethnicity, and origin ACS 2023
- Neighborhood character
- Highly diverse neighborhood (Simpson 0.70)
- Race & ethnicity
- Hispanic / Latino 36% Black 31% White 27% Two or more races 21% Asian 2%
- Hispanic origin (detail)
- Mexican 4% Puerto Rican 4% Cuban 8% Dominican 1%
- Common ancestry
- Hispanic 8% Romanian 1% Lithuanian 1%
- Foreign-born
- 34% · Canada, Jamaica
- Languages at home
- 55% English-only · Spanish 30% French/Haitian/Cajun 10% Other Indo-European 2%
Political lean MEDSL · Palm Beach
- 2024 margin
- Toss-up / Even · D 50.0% · R 49.2%
- 2008→2024 swing
- -22.1pp toward R · 2008: 22.9pp · 2024: 0.8pp
- All cycles
- 2024: D+0.8 2020: D+12.8 2016: D+15.3 2012: D+17.0 2008: D+22.9
Not yet ingested
- Civics
- —
Market trends
- HPI YoY
- ▼ -128.54%
- Current HPI
- 374.2506
- Rent YoY
- ▼ -0.15%
- Metro
- Miami-Fort Lauderdale-Pompano Beach, FL
- State GDP YoY
- ▲ 3.28%
- F500 in state
- 36
Industry mix (Fortune 500 HQ in FL)
| Industry | F500 HQs | Revenue |
|---|---|---|
| Industrial Technology | 2 | $29B |
|
||
| Insurance | 2 | $17B |
|
||
| Retail | 1 | $60B |
|
||
| Technology Distribution | 1 | $58B |
|
||
| Homebuilding | 1 | $35B |
|
||
| Technology Manufacturing | 1 | $35B |
|
||
Price history
+665.8% since first listed3 events — show timeline
- 2026-05-11 Pending — Beaches MLS
- 2026-03-12 Listed $425,000 Beaches MLS
- 1986-07-01 Sold (Public Records) $55,500 Public Records
Property tax history
+13.0%/yrLatest (2025): $5,383 · -0.1% YoY. Source: county tax records.
Cash-flow waterfall
monthlySold comps — $/sqft
last 12 mo · ≤1 miLoading sold comps…