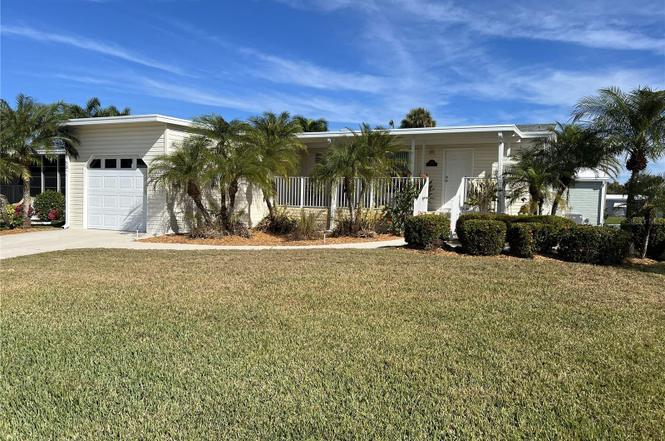
8428 Regal Way · Ellenton, FL
Flood risk 1/10 · Minimal
- FEMA flood zone
- X (unshaded)
- Chance of flooding over 30 yrs
- 0.0%
- Est. flood insurance / yr
- $507 – $1,088
Fire risk 4/10 · Minor
- Est. fire insurance / yr
- $947 – $1,759
Heat risk 10/10 · Severe
- Hot days now (above 107°F)
- 7 days/yr
- Hot days in 30 yrs
- 31 days/yr
Wind risk 10/10 · Severe
- Chance of severe wind over 30 yrs
- 99.0%
Air-quality risk 3/10 · Minor
- Unhealthy air days now
- 3 days/yr
- Unhealthy air days in 30 yrs
- 3 days/yr
Risk factors via First Street. Map © Google.
Why this score? — see what drove the C+ grade
The composite is a weighted blend of 9 inputs, each scored 0–100. Each bar is that input's sub-score; the figure is the points it added to the 100-point composite (weight × sub-score).
- Cash flow +25.5/30.0
- ARV discount +8.6/15.0
- DSCR +8.5/10.0
- 1% rule +6.9/10.0
- Schools +4.4/10.0
- Livability +3.8/5.0
- Condition / age +2.5/5.0
- Rent growth +1.8/5.0
- Appreciation +0.0/10.0
$179,000
🖨 Deal sheet 📄 Offer letter ✓ Due diligence
Listing remarks
Under contract-accepting backup offers. WHAT A GEM! This 2 bedroom/2 bath abode is a Florida Gulf Coast lovers’ MUST SEE! Boasting an abundance of natural light shining throughout, this 1080 sf beauty is conveniently located near I-75 in the premier 55+ Imperial Lakes community close to the world-famous gulf beaches, minutes from the Factory Outlet Mall and a plethora of restaurants. This beautiful home welcomes you with a lovely yard complete with well-maintained landscaping and a serene front porch perfect for relaxing in the warm Florida sunshine. Proceeding through the inviting entrance, you are greeted by a spacious foyer into a cozy, open floor plan with a spacious kitchen ove
Key facts
- Open floor plan
- Spacious kitchen
- Spacious foyer
Tags
Property features AI
Finance
- Other: Property type: Residential, Manufactured Home; Lot about 0.12 acres (approximately 0 to less than 1/4 acre); Road surface: Asphalt; Zoning: RSMH4.5; Unfurnished; Living area and building area reported in public records
- Financial info: Lease restrictions apply; Total annual fees listed as $2,176
- HOA & community: HOA: Imperial Lakes Manager; Monthly HOA approximately $181.33 (quarterly fee noted as $544); HOA includes cable TV, common area taxes, pool, management, recreational facilities; Community amenities: clubhouse, pool, pickleball court(s), shuffleboard court; Deed restrictions; Golf carts allowed; Senior community; Pets allowed (cats and dogs), max pet weight ~25 lbs
Exterior
- Parking: Attached garage (1 car)
- Utilities: Canal/lake irrigation water source; Public sewer; Cable connected; Electricity connected; Water connected; Sewer connected
- Home design: Manufactured home (double wide); One story; South-facing; Entry on one level
- Construction: Vinyl siding; Shingle roof; Crawlspace foundation; Built as a double wide manufactured home
- Exterior features: Storage; Tennis court(s)
Interior
- Kitchen: Disposal; Refrigerator
- Bedrooms: 2 bedrooms
- Flooring: Carpet
- Bathrooms: 2 full bathrooms
- Heating & cooling: Central heating (electric); Central air conditioning
- Interior features: Open floorplan; Window treatments
- Laundry & utility: Laundry closet; Washer; Dryer
Neighborhood map
What this means for you Summary
Snapshot
- This is a 2-bed/2.0-bath manufactured listed at $179k.
Deal economics
- At list price, monthly cash flow is $418 ($5k/yr) — positive.
- The deal already cash-flows at list — no discount required.
- Meets the 1% rule at list price ($2k rent vs $179k).
- Recommended offer: $158k (12.0% below list) — sets the bar for market timing.
- Cap rate 9.1% vs local median 4.5% in Ellenton — top-decile yield for the area; either an underpriced asset or a hidden risk that comps aren't pricing in. Stress-test before assuming the spread holds.
Location & tenants
- Location reads 76/100 on livability (#232 in FL, #3,666 nationally) — a middle-class / working-renter tenant base. Strengths: cost of living A+, housing A+, health & safety A+; Watch: schools D+, amenities F, commute F.
- Manatee (suburban): math 54% / reading 50% proficiency, ranked #26 of 73 in FL (top 36%) — acceptable for families but not a draw, mixed tenant base, ~2y average lease.
- Market conditions: Rents soft (-3.0%/yr); 1160 active listings in the ZIP; 12 comparable units currently listed for rent nearby; rentals at typical pace (median 21d on market — plan ~3-4 weeks tenant-placement turnaround); solid renter incomes; 7,472 units permitted in Manatee County in 2024 (1,782 in 5+ unit buildings).
- This rent runs 33% of the median local income ($78k/yr) — at the standard rent-burdened threshold; future hikes will face affordability resistance.
Forward outlook
- Local home prices are declining (-3.0%/yr); year-one equity from $1k of loan paydown is wiped out by about $5k of value loss. Plan a longer hold.
- Manatee County population projected at +43% by 2050 — long-run rental-demand tailwind backs the buy-and-hold thesis.
Negotiation context
- It's been on market 160 days — a 12% lower offer ($158k) is reasonable based on typical stale-listing flexibility.
- Current owner paid $26k; list at $179k implies a 588% gain — meaningful room to come down on a strong offer.
Risks & watch-outs
- Climate carrying-cost: severe wind risk, 99% chance of damaging wind over 30y; extreme-heat days projected 7→31/yr by 2055 (HVAC capex compounding) — expect insurance premiums to compound above CPI over the hold.
Questions for the listing agent
- It's been on market 160 days. Have you received any prior offers? Is the seller open to a 12% concession, seller financing, or rate buy-down credit?
- What does the HOA fee cover, when was the last increase, and are there any pending special assessments or reserve-fund shortfalls?
- Why hasn't it sold? Are there any deal-killer items the seller is aware of (foundation, flood, title, zoning, code violations)?
- Is there a deadline driving the sale (1031 exchange, divorce, estate, relocation)? That informs how much negotiation room exists.
- Schools are D-rated, which usually means shorter tenancies and higher turnover. Who's the typical renter profile here, and what's been the actual vacancy rate?
- What's the average days-on-market for RENTAL listings here right now (not sales)? A rising rental-DOM trend means longer vacancies and softer asking-rent achievability than the comps imply.
- What's the recent tenant-quality profile in this submarket — average credit score on applications, eviction rate, late-payment / NSF rate, and stable-employment percentage? A property-management company in the area should have these aggregated.
- How much new for-sale + rental construction is in the pipeline within 1–3 miles? Heavy new supply typically softens prices + rents 12–24 months out; constrained supply supports both.
Investment metrics
- 1% rule
- 1.19% ✓
- Cap rate
- 9.09%
- Cash-on-cash
- 10.01%
- DSCR
- 1.45
- GRM
- 7.0
CMA / ARV
- ARV (on-the-fly)
- $183,600
- Comps found
- 4
Show comp detail 4 sales within ~0.75 mi
| Address | Dist | Beds/Ba | Sqft | Sold | Price | $/sf | Match |
|---|---|---|---|---|---|---|---|
| 8402 Princess Ct | 0.31mi | 2/2.0 | 1,076 (-0%) | 11mo | $184,000 | $171 | 76 |
| 8505 Monarch Pl | 0.27mi | 2/2.0 | 1,168 (+8%) | 3mo | $110,000 | $94 | 71 |
| 8520 Imperial Cir | 0.30mi | 2/2.0 | 1,144 (+6%) | 12mo | $194,000 | $170 | 66 |
| 8524 Imperial Cir #8524 | 0.30mi | 2/2.0 | 1,152 (+7%) | 15mo | $160,000 | $139 | 63 |
Match score weights: distance 35% · size 25% · config 20% · recency 20%. Top-matched comps best support the ARV.
Projected returns pro-forma
-3.0% appreciation · 0.0% rent growth · sell at horizon
- IRR
- -4.7%
- Equity multiple
- 0.83×
- Total profit
- $-8,589
- Equity at exit
- $26,689
- IRR
- 0.9%
- Equity multiple
- 1.06×
- Total profit
- $2,835
- Equity at exit
- $15,477
Cash invested: $50,120 (down + closing). Projections, not guarantees.
Landlord ↔ Tenant lean methodology
- Overall (STATE)
- 87 Strongly Landlord-Friendly
- State Florida
- 87 Strongly Landlord-Friendly · R+3
- County
- — inherits STATE
- City
- — inherits STATE
ZIP-level market 34221
- Rents YoY
- -3.0%
- Active inventory
- 1160
- Price-to-rent
- 7.0×
Monthly cashflow live
- Estimated rent
- $2,134 high interval (Pro) →
- Mortgage (P&I)
- −$939
- Tax from tax record
- −$74 /mo · $886/yr
- Insurance
- −$75
- HOA
- −$181
- Vacancy / Maint / Mgmt
- −$448
- Net cashflow
- $418
Break-even live
UW: 25.0% down · 7.5% · 30yr · 1.5% tax · 5.0% vac · 8.0% maint · 8.0% mgmt
Financing live
Cash to close
- Down payment
- $44,750
- Closing costs
- $5,370
- Reserves months
- —
- Total cash needed
- —
Loan-product check · same deal, 3 products live
Conventional
25% down · 7.5% · 30yr
- Down + closing
- —
- Monthly P&I
- —
- Monthly cashflow
- —
- DSCR
- —
- Eligible?
- —
Personal DTI + credit; lowest rate.
DSCR
20% down · 8.5% · 30yr
- Down + closing
- —
- Monthly P&I
- —
- Monthly cashflow
- —
- DSCR
- —
- Eligible?
- —
No personal income docs; deal must DSCR.
Hard money
10% down · 12.0% · 12mo
- Down + closing
- —
- Monthly P&I
- —
- Monthly cashflow
- —
- DSCR
- —
- Eligible?
- —
Short-term bridge; refi at stabilization.
Rent comps 12 comps
| Address | Beds | Baths | Sqft | Rent | $/sqft | DOM | Units | Dist |
|---|---|---|---|---|---|---|---|---|
| 9650 52nd Ave E Palmetto, FL | 1.0–3.0 | 1.0–2.0 | 1050 | $1,958 | $1.87 | 23d | 99 | 0.74mi |
| 5020 Cedar Leaf Cir Palmetto, FL | 1.0–2.0 | 1.0–2.0 | 873 | $2,491 | $2.85 | 1d | 21 | 0.95mi |
| 5871 Bungalow Grove Ct Palmetto, FL | 3.0 | 2.0 | 1492 | $2,185 | $1.46 | 21d | 1 | 0.99mi |
| 4117 84th Ct E Palmetto, FL | 3.0 | 2.0 | 1448 | $2,466 | $1.70 | 21d | 1 | 1.00mi |
| 9117 Optimist Way Palmetto, FL | 2.0 | 2.0 | 1489 | $2,200 | $1.48 | 23d | 1 | 1.07mi |
| 6210 Terra Lago Cir Palmetto, FL | 1.0–3.0 | 1.0–2.0 | 1015 | $1,962 | $1.93 | 3d | 50 | 1.09mi |
| 7562 Sea Oak Ct Palmetto, FL | 3.0 | 2.0 | 1433 | $2,400 | $1.67 | 21d | 1 | 1.27mi |
| 6249 Fairmont Ln Palmetto, FL | 2.0 | 2.5 | 1200 | $1,890 | $1.57 | 14d | 1 | 1.33mi |
| 6256 Fairmont Ln Palmetto, FL | 2.0 | 2.5 | 1216 | $1,845 | $1.52 | 14d | 1 | 1.36mi |
| 6334 Fairmont Ln Palmetto, FL | 2.0 | 2.5 | 1235 | $1,795 | $1.45 | 3d | 1 | 1.37mi |
| 6354 Fairmont Ln Palmetto, FL | 2.0 | 2.5 | 1123 | $2,000 | $1.78 | 23d | 1 | 1.37mi |
| 6345 Willowside St Palmetto, FL | 3.0 | 2.5 | 1407 | $2,200 | $1.56 | 23d | 1 | 1.39mi |
HOA detail
- Monthly dues
- $181 · $2,172/yr
- Likely covers
- landscaping
Listing history 3 events
-
2026-04-20price $179,000
-
2025-12-19$195,000 Active
-
2004-07-14soldstatus $26,000
ⓘ Source: listings_history table (triggers on properties + properties_extension) + one-shot
backfill from property_details.listing_events for pre-trigger history.
Tax reassessment forecast FL · Resets to sale price
- Current annual tax
- $886 · $74/mo
- Projected year-2 tax
- $1,486 · $124/mo
- Expected delta
- +$599/yr (+$50/mo · 67.6%)
ⓘ Screening estimate from a state-policy table — verify with the county assessor before closing.
Climate risk First Street
- Flood 1/10 Low FEMA zone X (unshaded) · 0% chance over 30 yrs
- Wildfire 4/10 Moderate
- Heat 10/10 Extreme 7 d/yr ≥107°F today · 31 d/yr by 30 yrs out
- Wind 10/10 Extreme 99% chance of damaging wind over 30 yrs
- Air quality 3/10 Moderate 3 unhealthy d/yr today · 3 by 30 yrs out
Nearby sold comps map
Loading sold comps map…
Walkable amenities ~0.75 mi
Loading nearby amenities…
Taxation est. · year 1
- Rental income
- $25,612
- − Mortgage interest
- −$10,027
- − Property taxes
- −$886
- − Insurance
- −$895
- − Repairs & maintenance
- −$2,049
- − Management
- −$2,049
- − HOA
- −$2,172
- − Depreciation
- −$5,207
- Taxable income
- $2,326
- Est. tax owed @ 24.0%
- −$558
- After-tax cash flow
- $4,457/yr
For passive investors: Depreciation is non-cash, so a rental often shows a tax loss while cash-flowing — sheltering income. Rental losses are passive: they offset passive income freely, and up to $25,000/yr can offset ordinary (W-2) income if you actively participate and your MAGI is under $100k (phasing out to $0 by $150k); unused losses carry forward. On sale, claimed depreciation is recaptured at up to 25%, and gains may owe capital-gains tax (a 1031 exchange can defer both). Figures are a year-1 estimate at your 24.0% rate — not tax advice; consult a CPA.
Schools (NCES district)
- District
- Manatee
- NCES district ID
- 1201230
- Math proficiency
- 54% ▼ -6.00%
- Reading proficiency
- 50% ▼ -2.00%
- Median HH income
- $49,607
- Composite
- 44.43/100
- National rank
- #2806
- State rank
- #26 of 73 in FL
Livability — Ellenton
- Score
- 76/100
- State rank
- #232
- US rank
- #3666
Category grades
Schools grade is shown separately in the Schools card above.
Census & demographics
- County
- Manatee County · 416,364 people
- City population
- 14,819
- Metro
- North Port-Sarasota-Bradenton, FL
- Population (ZIP)
- 56,208
- Household income
- $77,712
- Rent vs Own
- Severe rent burden
- 1193.0
Population outlook (Manatee County) Hauer SSP2
- Today (2025)
- 447,342 people
- By 2030
- 488,911 · +9.3%
- By 2040
- 567,934 · +27.0%
- By 2050
- 637,995 · +42.6%
- By 2075
- 781,970 · +74.8%
- By 2100
- 848,272 · +89.6%
Race, ethnicity, and origin ACS 2023
- Neighborhood character
- Diverse neighborhood (Simpson 0.58)
- Race & ethnicity
- White 59% Hispanic / Latino 22% Black 14% Two or more races 11%
- Hispanic origin (detail)
- Mexican 14% Puerto Rican 3%
- Common ancestry
- Romanian 2% Lithuanian 2% Italian 2%
- Foreign-born
- 10% · Canada, Dominican Republic, Jamaica
- Languages at home
- 81% English-only · Spanish 16% Other Indo-European 1%
Political lean MEDSL · Manatee
- 2024 margin
- Strong R (+23.5) · D 37.9% · R 61.4%
- 2008→2024 swing
- -16.5pp toward R · 2008: -7.0pp · 2024: -23.5pp
- All cycles
- 2024: R+23.5 2020: R+16.1 2016: R+17.1 2012: R+12.5 2008: R+7.0
Not yet ingested
- Civics
- —
Market trends
- HPI YoY
- ▼ -383.53%
- Current HPI
- 302.1458
- Rent YoY
- ▼ -2.98%
- Metro
- North Port-Sarasota-Bradenton, FL
- State GDP YoY
- ▲ 3.28%
- F500 in state
- 36
Industry mix (Fortune 500 HQ in FL)
| Industry | F500 HQs | Revenue |
|---|---|---|
| Industrial Technology | 2 | $29B |
|
||
| Insurance | 2 | $17B |
|
||
| Retail | 1 | $60B |
|
||
| Technology Distribution | 1 | $58B |
|
||
| Homebuilding | 1 | $35B |
|
||
| Technology Manufacturing | 1 | $35B |
|
||
Price history
+588.5% since first listed3 events — show timeline
- 2026-04-20 Price Changed $179,000 Stellar MLS as Distributed by MLS Grid
- 2025-12-19 Listed $195,000 Stellar MLS as Distributed by MLS Grid
- 2004-07-14 Sold (Public Records) $26,000 Public Records
Property tax history
+2.5%/yrLatest (2025): $886 · +7.2% YoY. Source: county tax records.
Cash-flow waterfall
monthlySold comps — $/sqft
last 12 mo · ≤1 miLoading sold comps…