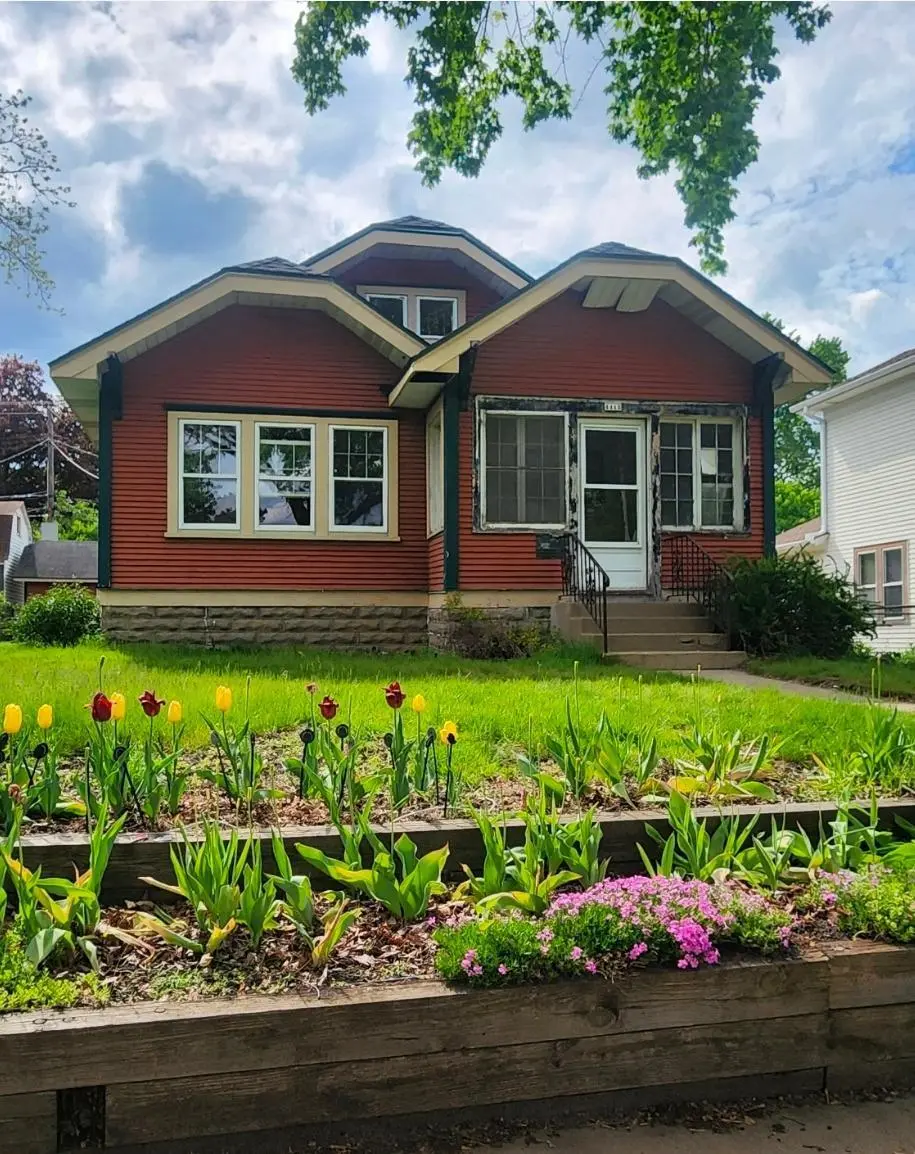
4415 Queen Ave N · Minneapolis, MN
Flood risk 1/10 · Minimal
- FEMA flood zone
- X (unshaded)
- Chance of flooding over 30 yrs
- 0.0%
- Est. flood insurance / yr
- $473 – $860
Fire risk 1/10 · Minimal
- Est. fire insurance / yr
- $888 – $1,650
Heat risk 2/10 · Minimal
- Hot days now (above 99°F)
- 7 days/yr
- Hot days in 30 yrs
- 14 days/yr
Wind risk 2/10 · Minimal
- Chance of severe wind over 30 yrs
- —
Air-quality risk 2/10 · Minimal
- Unhealthy air days now
- 1 days/yr
- Unhealthy air days in 30 yrs
- 1 days/yr
Risk factors via First Street. Map © Google.
Why this score? — see what drove the B grade
The composite is a weighted blend of 9 inputs, each scored 0–100. Each bar is that input's sub-score; the figure is the points it added to the 100-point composite (weight × sub-score).
- Cash flow +29.8/30.0
- DSCR +10.0/10.0
- 1% rule +9.2/10.0
- ARV discount +7.5/15.0
- Rent growth +4.1/5.0
- Livability +3.9/5.0
- Schools +3.5/10.0
- Condition / age +2.5/5.0
- Appreciation +0.0/10.0
$124,900
🖨 Deal sheet 📄 Offer letter ✓ Due diligence
Listing remarks
Charming North Minneapolis Diamond in the Rough – Bring Your Vision! Nestled on a beautiful, tree-lined street in a quaint and established Victory neighborhood. This classic home is brimming with character, charm, and sweat-equity potential. From the moment you step inside, you’ll see the incredible canvas waiting for your personal touch. Whether you are looking to restore its historic luster or execute a complete contemporary re-imagining, the possibilities here are endless. Conveniently located just minutes from local parks, parkways, dining, and downtown access, this property is a rare find for investors, contractors, or ambitious DIY homeowners looking to build equity.
Key facts
- 6,098 sq ft lot
- 2 garage spots
- Built 1925
Property features AI
Finance
- Other: Lot approximately 0.14 acres (dimensions: 50' x 125' x 50' x 125'); Living area listed as approximately 1,124 sq ft; Neighborhood number 79
Exterior
- Parking: Attached or detached 2-car garage (277 garage sq. ft.)
- Utilities: City water (connected); City sewer (connected); Natural gas
- Home design: Residential property; One-and-a-half story; Main-level entry
- Construction: Block foundation; Above-grade finished area approximately 1,124; Below-grade area approximately 884; Total building area approximately 2,008
- Exterior features: Wood exterior
Interior
- Kitchen: Kitchen on main level (approx. 13 x 10)
- Bedrooms: 2 bedrooms (both on the main level)
- Bathrooms: 1 full bathroom (main level, approx. 8 x 6)
- Heating & cooling: Forced air heating; Central air conditioning
- Interior features: Main floor bedroom; Full basement
Neighborhood map
What this means for you Summary
Snapshot
- This is a 3-bed/1.0-bath single-family listed at $125k.
Deal economics
- At list price, monthly cash flow is $457 ($5k/yr) — positive.
- The deal already cash-flows at list — no discount required.
- Meets the 1% rule at list price ($2k rent vs $125k).
- Cap rate 10.7% vs local median 3.1% in Minneapolis — top-decile yield for the area; either an underpriced asset or a hidden risk that comps aren't pricing in. Stress-test before assuming the spread holds.
Location & tenants
- Location reads 78/100 on livability (#110 in MN, #2,525 nationally) — a middle-class / working-renter tenant base. Strengths: amenities A+, commute A+, housing A+; Watch: cost of living C-, crime F.
- Minneapolis Public School District (urban): math 35% / reading 46% proficiency, ranked #217 of 301 in MN (top 72%) — families likely to look elsewhere, expect single-tenant / working-renter base with shorter leases.
- Market conditions: Rents rising fast (+6.3%/yr); 169 active listings in the ZIP; 28 comparable units currently listed for rent nearby; rentals at typical pace (median 18d on market — plan ~3-4 weeks tenant-placement turnaround); 4,651 units permitted in Hennepin County in 2024 (2,443 in 5+ unit buildings).
- This rent runs 31% of the median local income ($69k/yr) — at the standard rent-burdened threshold; future hikes will face affordability resistance.
Forward outlook
- Local home prices are declining (-3.0%/yr); year-one equity from $864 of loan paydown is wiped out by about $4k of value loss. Plan a longer hold.
- Hennepin County population projected at +30% by 2050 — long-run rental-demand tailwind backs the buy-and-hold thesis.
- At projected returns (-3.0% appreciation + 6.3% rent growth), your $35k cash investment doubles in ~7 years — after that, you're playing with house money.
Negotiation context
- Only 6 days on market — expect competitive offers; lowballing is unlikely to land.
- Current owner paid $52k; list at $125k implies a 140% gain — meaningful room to come down on a strong offer.
Risks & watch-outs
- Watch-outs: built in 1925 — expect roof / HVAC / electrical / plumbing capex.
Questions for the listing agent
- Built in 1925 — when were the roof, HVAC, electrical panel, plumbing, and water heater last replaced?
- Is there a deadline driving the sale (1031 exchange, divorce, estate, relocation)? That informs how much negotiation room exists.
- Crime grade is F in this area — have there been break-ins, vandalism, or insurance claims at this property in the last 3 years? What carrier currently insures it and at what premium?
- What's the average days-on-market for RENTAL listings here right now (not sales)? A rising rental-DOM trend means longer vacancies and softer asking-rent achievability than the comps imply.
- What's the recent tenant-quality profile in this submarket — average credit score on applications, eviction rate, late-payment / NSF rate, and stable-employment percentage? A property-management company in the area should have these aggregated.
- How much new for-sale + rental construction is in the pipeline within 1–3 miles? Heavy new supply typically softens prices + rents 12–24 months out; constrained supply supports both.
Investment metrics
- 1% rule
- 1.42% ✓
- Cap rate
- 10.68%
- Cash-on-cash
- 15.68%
- DSCR
- 1.70
- GRM
- 5.9
CMA / ARV
- ARV (on-the-fly)
- $274,256
- Comps found
- 1
Show comp detail 1 sale within ~0.75 mi
| Address | Dist | Beds/Ba | Sqft | Sold | Price | $/sf | Match |
|---|---|---|---|---|---|---|---|
| 3859 Penn Ave N | 0.72mi | 3/1.0 | 980 (-13%) | 5mo | $239,500 | $244 | 41 |
Match score weights: distance 35% · size 25% · config 20% · recency 20%. Top-matched comps best support the ARV.
Projected returns pro-forma
-3.0% appreciation · 6.35% rent growth · sell at horizon
- IRR
- 10.5%
- Equity multiple
- 1.43×
- Total profit
- $15,098
- Equity at exit
- $18,623
- IRR
- 22.3%
- Equity multiple
- 3.23×
- Total profit
- $78,013
- Equity at exit
- $10,799
Cash invested: $34,972 (down + closing). Projections, not guarantees.
Landlord ↔ Tenant lean methodology
- Overall (CITY)
- 34 Tenant-Leaning
- State Minnesota
- 46 Balanced · D+2
- County
- — inherits STATE
- City Minneapolis
- 34 Tenant-Leaning · D+50
ZIP-level market 55412
- Home prices YoY
- -26.9%
- Rents YoY
- 6.3%
- Active inventory
- 169
- Price-to-rent
- 5.9×
Monthly cashflow live
- Estimated rent
- $1,769 high interval (Pro) →
- Mortgage (P&I)
- −$655
- Tax from tax record
- −$234 /mo · $2,803/yr
- Insurance
- −$52
- HOA
- −$0
- Vacancy / Maint / Mgmt
- −$371
- Net cashflow
- $457
Break-even live
UW: 25.0% down · 7.5% · 30yr · 1.5% tax · 5.0% vac · 8.0% maint · 8.0% mgmt
Financing live
Cash to close
- Down payment
- $31,225
- Closing costs
- $3,747
- Reserves months
- —
- Total cash needed
- —
Loan-product check · same deal, 3 products live
Conventional
25% down · 7.5% · 30yr
- Down + closing
- —
- Monthly P&I
- —
- Monthly cashflow
- —
- DSCR
- —
- Eligible?
- —
Personal DTI + credit; lowest rate.
DSCR
20% down · 8.5% · 30yr
- Down + closing
- —
- Monthly P&I
- —
- Monthly cashflow
- —
- DSCR
- —
- Eligible?
- —
No personal income docs; deal must DSCR.
Hard money
10% down · 12.0% · 12mo
- Down + closing
- —
- Monthly P&I
- —
- Monthly cashflow
- —
- DSCR
- —
- Eligible?
- —
Short-term bridge; refi at stabilization.
Rent comps 28 comps
| Address | Beds | Baths | Sqft | Rent | $/sqft | DOM | Units | Dist |
|---|---|---|---|---|---|---|---|---|
| 4311 Humboldt Ave N Minneapolis, MN | 2.0 | 1.0 | 915 | $1,795 | $1.96 | 43d | 1 | 0.62mi |
| 3401 47th Ave N Minneapolis, MN | 1.0–2.0 | 1.0 | 697 | $1,400 | $2.01 | 2d | 8 | 0.78mi |
| 5021 Fremont Ave N Minneapolis, MN | 2.0 | 1.0 | 800 | $1,795 | $2.24 | 7d | 1 | 1.00mi |
| 5301 Russell Ave N Minneapolis, MN | 3.0 | 1.0 | 1200 | $2,000 | $1.67 | 43d | 1 | 1.07mi |
| 4200 45th Ave N Minneapolis, MN | 1.0–2.0 | 1.0 | 925 | $1,575 | $1.70 | 2d | 1 | 1.08mi |
| 3753 Girard Ave N Minneapolis, MN | 1.0–2.0 | 1.0 | 687 | $1,450 | $2.11 | 17d | 8 | 1.09mi |
| 4199 46th Ave N Robbinsdale, MN | 1.0–4.0 | 1.0–1.5 | 1070 | $2,142 | $2.00 | 1d | 12 | 1.09mi |
| 1315 N Dowling Ave Unit 308 Minneapolis, MN | 2.0 | 1.0 | 800 | $1,450 | $1.81 | 21d | 1 | 1.10mi |
| 1315 N Dowling Ave Unit 304 Minneapolis, MN | 2.0 | 1.0 | 900 | $1,450 | $1.61 | 3d | 1 | 1.10mi |
| 4638 Camden Ave N Unit 1 Minneapolis, MN | 2.0 | 1.0 | 815 | $1,495 | $1.83 | 3d | 1 | 1.13mi |
| 2914 53rd Ave N Minneapolis, MN | 4.0 | 1.0 | 1365 | $2,200 | $1.61 | 43d | 1 | 1.13mi |
| 4001 N Bryant Ave Unit 1 Minneapolis, MN | 2.0 | 1.0 | 850 | $1,295 | $1.52 | 43d | 1 | 1.13mi |
| 3413 53rd Ave N Minneapolis, MN | 2.0 | 1.0 | 950 | $1,469 | $1.55 | 2d | 1 | 1.22mi |
| 4207 Lakeside Ave N Minneapolis, MN | 2.0 | 2.0 | 1030 | $1,325 | $1.29 | 43d | 1 | 1.29mi |
| 4201 Lakeside Ave N #111 Minneapolis, MN | 2.0 | 2.0 | 1080 | $1,990 | $1.84 | 21d | 1 | 1.29mi |
| 3711 W Broadway Ave Minneapolis, MN | 1.0–2.0 | 1.0 | 675 | $1,149 | $1.70 | 24d | 1 | 1.30mi |
| 4600 Lake Road Ave Minneapolis, MN | 2.0 | 1.0–2.0 | 855 | $2,945 | $3.44 | 43d | 32 | 1.31mi |
| 4600 Lake Road Ave Minneapolis, MN | 2.0 | 1.0–2.0 | 855 | $2,845 | $3.33 | 1d | 34 | 1.31mi |
| 4200 Lake Breeze Ave N Unit 1 Brooklyn Center, MN | 2.0 | 1.0 | 1100 | $1,250 | $1.14 | 24d | 1 | 1.35mi |
| 3737 Hubbard Ave N Unit 3737-204 Robbinsdale, MN | 2.0 | 1.0 | 1000 | $1,299 | $1.30 | 4d | 1 | 1.36mi |
| 3737 Hubbard Ave N Minneapolis, MN | 2.0 | 1.0 | 1000 | $1,299 | $1.30 | 16d | 1 | 1.36mi |
| 4024 37th Ave N Minneapolis, MN | 2.0 | 1.0 | 1000 | $1,299 | $1.30 | 4d | 2 | 1.39mi |
| 4024 37th Ave N Unit 4024-204 Minneapolis, MN | 2.0 | 1.0 | 1000 | $1,299 | $1.30 | 3d | 1 | 1.39mi |
| 4028 37th Ave N Unit 4028-202 Minneapolis, MN | 2.0 | 1.0 | 1000 | $1,299 | $1.30 | 16d | 1 | 1.40mi |
| 4032 37th Ave N Unit 4032-201 Robbinsdale, MN | 2.0 | 1.0 | 1000 | $1,299 | $1.30 | 24d | 1 | 1.43mi |
| 4036 37th Ave N Robbinsdale, MN | 2.0 | 1.0 | 1000 | $1,195 | $1.20 | 43d | 1 | 1.43mi |
| 3848 Major Ave N Minneapolis, MN | 2.0 | 1.0 | 770 | $1,674 | $2.17 | 24d | 1 | 1.48mi |
| 3315 James Ave N Minneapolis, MN | 4.0 | 1.0 | 1400 | $2,100 | $1.50 | 3d | 1 | 1.50mi |
Listing history 2 events
-
2026-05-21$124,900 Active
-
1990-06-15soldstatus $52,000
ⓘ Source: listings_history table (triggers on properties + properties_extension) + one-shot
backfill from property_details.listing_events for pre-trigger history.
Tax reassessment forecast MN · Partial reset (capped growth)
- Current annual tax
- $2,803 · $234/mo
- Projected year-2 tax
- $2,803 · $234/mo
- Expected delta
- $0/yr ($0/mo · 0.0%)
ⓘ Screening estimate from a state-policy table — verify with the county assessor before closing.
Climate risk First Street
- Flood 1/10 Low FEMA zone X (unshaded) · 0% chance over 30 yrs
- Wildfire 1/10 Low
- Heat 2/10 Low 7 d/yr ≥99°F today · 14 d/yr by 30 yrs out
- Wind 2/10 Low
- Air quality 2/10 Low 1 unhealthy d/yr today · 1 by 30 yrs out
Nearby sold comps map
Loading sold comps map…
Walkable amenities ~0.75 mi
Loading nearby amenities…
Taxation est. · year 1
- Rental income
- $21,228
- − Mortgage interest
- −$6,996
- − Property taxes
- −$2,803
- − Insurance
- −$624
- − Repairs & maintenance
- −$1,698
- − Management
- −$1,698
- − Depreciation
- −$3,633
- Taxable income
- $3,774
- Est. tax owed @ 24.0%
- −$906
- After-tax cash flow
- $4,577/yr
For passive investors: Depreciation is non-cash, so a rental often shows a tax loss while cash-flowing — sheltering income. Rental losses are passive: they offset passive income freely, and up to $25,000/yr can offset ordinary (W-2) income if you actively participate and your MAGI is under $100k (phasing out to $0 by $150k); unused losses carry forward. On sale, claimed depreciation is recaptured at up to 25%, and gains may owe capital-gains tax (a 1031 exchange can defer both). Figures are a year-1 estimate at your 24.0% rate — not tax advice; consult a CPA.
Schools (NCES district)
- District
- Minneapolis Public School District
- NCES district ID
- 2721240
- Math proficiency
- 35% ▼ -7.00%
- Reading proficiency
- 46% ▼ -1.00%
- Median HH income
- $50,521
- Composite
- 34.92/100
- National rank
- #5067
- State rank
- #217 of 301 in MN
Livability — Minneapolis
- Score
- 78/100
- State rank
- #110
- US rank
- #2525
Category grades
Schools grade is shown separately in the Schools card above.
Census & demographics
- Census place
- Minneapolis, MN
- County
- Hennepin County · 1,150,272 people
- City population
- 417,555
- Metro
- Minneapolis-St. Paul-Bloomington, MN-WI
- Population (ZIP)
- 24,460
- Household income
- $68,682
- Rent vs Own
- Severe rent burden
- 913.0
Population outlook (Hennepin County) Hauer SSP2
- Today (2025)
- 1,405,227 people
- By 2030
- 1,492,650 · +6.2%
- By 2040
- 1,660,157 · +18.1%
- By 2050
- 1,823,498 · +29.8%
- By 2075
- 2,221,283 · +58.1%
- By 2100
- 2,509,976 · +78.6%
Race, ethnicity, and origin ACS 2023
- Neighborhood character
- Highly diverse neighborhood (Simpson 0.73)
- Race & ethnicity
- White 36% Black 33% Hispanic / Latino 14% Two or more races 12% Asian 8% Native American 1%
- Hispanic origin (detail)
- Mexican 8%
- Common ancestry
- Portuguese 6% Lithuanian 2% Romanian 1%
- Foreign-born
- 12% · Canada
- Languages at home
- 82% English-only · Spanish 9% Other Asian/Pacific 7% Tagalog/Filipino 1%
Political lean MEDSL · Hennepin
- 2024 margin
- Solid D (+42.6) · D 70.2% · R 27.5% · Other 2.3%
- 2008→2024 swing
- +14.0pp toward D · 2008: 28.6pp · 2024: 42.6pp
- All cycles
- 2024: D+42.6 2020: D+43.2 2016: D+35.3 2012: D+27.1 2008: D+28.6
Not yet ingested
- Civics
- —
Market trends
- HPI YoY
- ▼ -109.98%
- Current HPI
- 298.1414
- Rent YoY
- ▲ 6.35%
- Metro
- Minneapolis-St. Paul-Bloomington, MN-WI
- State GDP YoY
- ▲ 2.41%
- F500 in state
- 34
Industry mix (Fortune 500 HQ in MN)
| Industry | F500 HQs | Revenue |
|---|---|---|
| Healthcare | 2 | $407B |
|
||
| Retail | 2 | $150B |
|
||
| Consumer Goods | 2 | $32B |
|
||
| Industrial Machinery | 2 | $6B |
|
||
| Agriculture | 1 | $40B |
|
||
| Healthcare / Medical Devices | 1 | $32B |
|
||
Price history
+140.2% since first listed2 events — show timeline
- 2026-05-21 Listed $124,900 NORTHSTARMLS as Distributed by MLS Grid
- 1990-06-15 Sold (Public Records) $52,000 Public Records
Property tax history
+5.0%/yrLatest (2025): $2,803 · +10.6% YoY. Source: county tax records.
Cash-flow waterfall
monthlySold comps — $/sqft
last 12 mo · ≤1 miLoading sold comps…