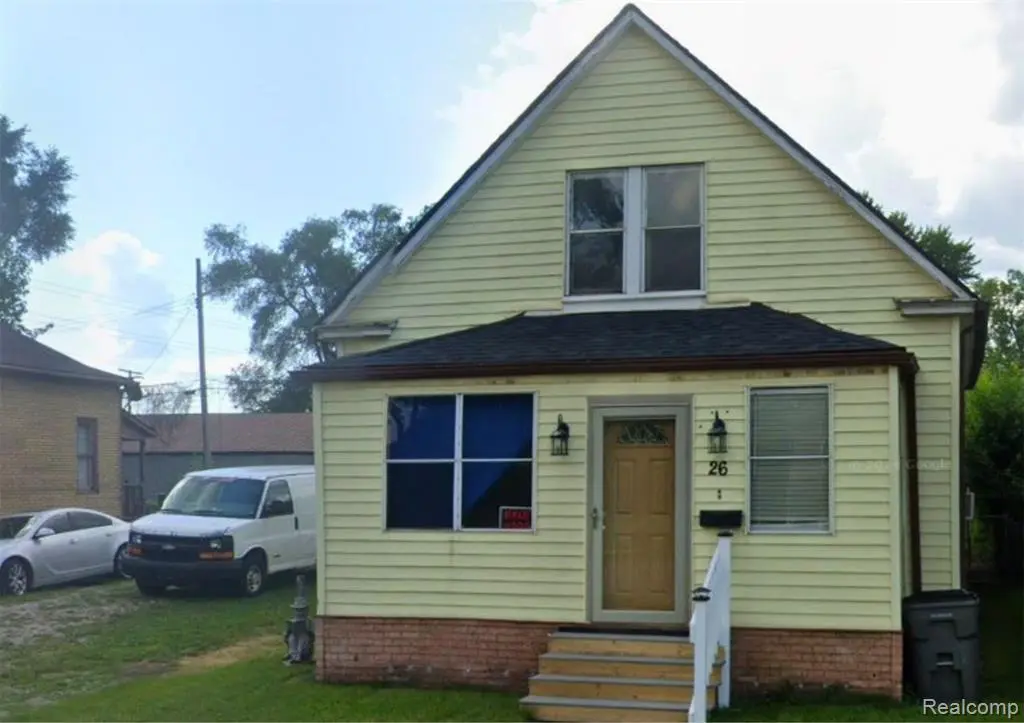
26 E Woodward St · Ecorse, MI
Flood risk 2/10 · Minimal
- FEMA flood zone
- X (unshaded)
- Chance of flooding over 30 yrs
- 0.06%
- Est. flood insurance / yr
- $507 – $1,088
Fire risk 1/10 · Minimal
- Est. fire insurance / yr
- $784 – $1,456
Heat risk 3/10 · Minor
- Hot days now (above 95°F)
- 7 days/yr
- Hot days in 30 yrs
- 16 days/yr
Wind risk 2/10 · Minimal
- Chance of severe wind over 30 yrs
- —
Air-quality risk 4/10 · Minor
- Unhealthy air days now
- 6 days/yr
- Unhealthy air days in 30 yrs
- 6 days/yr
Risk factors via First Street. Map © Google.
Why this score? — see what drove the A- grade
The composite is a weighted blend of 9 inputs, each scored 0–100. Each bar is that input's sub-score; the figure is the points it added to the 100-point composite (weight × sub-score).
- Cash flow +30.0/30.0
- ARV discount +15.0/15.0
- 1% rule +10.0/10.0
- DSCR +10.0/10.0
- Appreciation +10.0/10.0
- Livability +3.5/5.0
- Rent growth +2.5/5.0
- Condition / age +2.5/5.0
- Schools +0.3/10.0
$70,000
🖨 Deal sheet 📄 Offer letter ✓ Due diligence
Listing remarks MLS
Beautifully updated 2-bedroom home priced below market for a quick sale. Updated within the last year with new flooring, fresh paint, and an updated kitchen. Solid home with a clean, inviting interior and strong overall appeal. Exterior could use a little TLC, but the home offers great value for a first-time buyer, downsizer, or investor. Excellent opportunity to own an affordable property with updates already completed. Priced to sell fast.
Key facts
- Fresh paint
- New flooring
- Updated kitchen
Tags
Property features AI
Exterior
- Parking: No garage
- Utilities: Public water; Public sewer
- Home design: Single-family residence; One story; Ground-level entry with steps; Vinyl siding
- Construction: Vinyl siding construction
- Exterior features: Paved road access; Lot approximately 0.08 acres (30 x 114)
Interior
- Bathrooms: 1 full bathroom
- Heating & cooling: Forced air heating (natural gas); No central air cooling
- Interior features: Crawl space basement; Two total rooms
Neighborhood map
What this means for you Summary
Snapshot
- This is a 2-bed/1.0-bath single-family listed at $70k.
Deal economics
- At list price, monthly cash flow is $353 ($4k/yr) — positive.
- The deal already cash-flows at list — no discount required.
- Meets the 1% rule at list price ($1k rent vs $70k).
- Recommended offer: $68k (3.0% below list) — sets the bar for market timing.
- Cap rate 12.3% vs local median 9.6% in Ecorse — meaningfully above typical; check what's discounted (condition, days-on-market, listing class) to confirm the premium yield is real.
Location & tenants
- Location reads 69/100 on livability (#348 in MI) — a middle-class / working-renter tenant base. Strengths: commute A+, cost of living A+, housing A+; Watch: health & safety D+, schools F, crime F.
- Ecorse Public Schools (suburban): math 3% / reading 7% proficiency, ranked #536 of 540 in MI (top 99%) — low school quality limits family demand, transient renter base, plan for 1-2y turnover; 80% free/reduced lunch — lower-income household profile, screen leases tightly.
- Market conditions: 56 active listings in the ZIP; 15 comparable units currently listed for rent nearby; rentals at typical pace (median 24d on market — plan ~3-4 weeks tenant-placement turnaround); 2,639 units permitted in Wayne County in 2024 (1,216 in 5+ unit buildings).
Forward outlook
- In year one you build about $7k of equity ($484 loan paydown + $7k appreciation (10.0% local appreciation)).
- Wayne County population projected at -17% by 2050 — secular population decline; favor cash flow + early exit over multi-decade hold.
- At projected returns (10.0% appreciation + 3.0% rent growth), your $20k cash investment doubles in ~2 years — after that, you're playing with house money.
- By year 5, paydown + projected appreciation supports a ~$35k cash-out refi (75% LTV) — recoverable capital for the next deal without selling this one.
Negotiation context
- It's been on market 44 days — a 3% lower offer ($68k) is reasonable based on typical stale-listing flexibility.
- 2 sale attempts; this cycle's ask has dropped $5k (7%) from the opening price — seller is motivated, your offer sets the floor, not the list.
Risks & watch-outs
- Watch-outs: property tax is 3.1% of price; built in 1913 — expect roof / HVAC / electrical / plumbing capex.
Questions for the listing agent
- It's been on market 44 days. Have you received any prior offers? Is the seller open to a 3% concession, seller financing, or rate buy-down credit?
- Built in 1913 — when were the roof, HVAC, electrical panel, plumbing, and water heater last replaced?
- Property tax is high relative to price — has the assessment been appealed recently, and will the sale trigger a re-assessment?
- Is there a deadline driving the sale (1031 exchange, divorce, estate, relocation)? That informs how much negotiation room exists.
- Schools are F-rated, which usually means shorter tenancies and higher turnover. Who's the typical renter profile here, and what's been the actual vacancy rate?
- Crime grade is F in this area — have there been break-ins, vandalism, or insurance claims at this property in the last 3 years? What carrier currently insures it and at what premium?
- What's the average days-on-market for RENTAL listings here right now (not sales)? A rising rental-DOM trend means longer vacancies and softer asking-rent achievability than the comps imply.
- What's the recent tenant-quality profile in this submarket — average credit score on applications, eviction rate, late-payment / NSF rate, and stable-employment percentage? A property-management company in the area should have these aggregated.
- How much new for-sale + rental construction is in the pipeline within 1–3 miles? Heavy new supply typically softens prices + rents 12–24 months out; constrained supply supports both.
Investment metrics
- 1% rule
- 1.68% ✓
- Cap rate
- 12.35%
- Cash-on-cash
- 21.62%
- DSCR
- 1.96
- GRM
- 5.0
CMA / ARV
- ARV (on-the-fly)
- $93,005
- Comps found
- 12
Show comp detail 12 sales within ~0.75 mi
| Address | Dist | Beds/Ba | Sqft | Sold | Price | $/sf | Match |
|---|---|---|---|---|---|---|---|
| 36 E Charlotte Ave | 0.22mi | 2/1.0 | 991 (-5%) | 1mo | $88,000 | $89 | 80 |
| 25 W Broadway St | 0.15mi | 3/1.0 (+1) | 1,000 (-4%) | 2mo | $69,000 | $69 | 79 |
| 4260 Pitt St | 0.27mi | 3/1.5 (+1) | 998 (-4%) | 2mo | $31,000 | $31 | 71 |
| 4059 High St | 0.25mi | 3/2.0 (+1) | 996 (-5%) | 3mo | $100,000 | $100 | 69 |
| 28 E Alexis Ave | 0.18mi | 3/1.0 (+1) | 928 (-11%) | 0mo | $65,000 | $70 | 68 |
| 4222 High St | 0.25mi | 2/1.0 | 933 (-11%) | 11mo | $90,000 | $96 | 62 |
| 4250 7th St | 0.55mi | 2/1.0 | 935 (-10%) | 0mo | $37,750 | $40 | 56 |
| 3973 10th St | 0.63mi | 3/1.5 (+1) | 1,064 (+2%) | 6mo | $106,000 | $100 | 56 |
| 58 Ridge St | 0.52mi | 3/1.0 (+1) | 950 (-9%) | 8mo | $87,000 | $92 | 48 |
| 4138 11th St | 0.70mi | 3/1.5 (+1) | 1,140 (+9%) | 4mo | $127,000 | $111 | 42 |
| 35 Bell St | 0.57mi | 3/2.0 (+1) | 1,176 (+12%) | 6mo | $27,000 | $23 | 39 |
| 3948 10th St | 0.67mi | 3/1.0 (+1) | 909 (-13%) | 10mo | $76,500 | $84 | 34 |
Match score weights: distance 35% · size 25% · config 20% · recency 20%. Top-matched comps best support the ARV.
Projected returns pro-forma
10.0% appreciation · 3.0% rent growth · sell at horizon
- IRR
- 40.5%
- Equity multiple
- 4.10×
- Total profit
- $60,693
- Equity at exit
- $63,062
- IRR
- 34.9%
- Equity multiple
- 9.22×
- Total profit
- $161,189
- Equity at exit
- $135,995
Cash invested: $19,600 (down + closing). Projections, not guarantees.
Landlord ↔ Tenant lean methodology
- Overall (STATE)
- 62 Landlord-Friendly
- State Michigan
- 62 Landlord-Friendly · EVEN
- County
- — inherits STATE
- City
- — inherits STATE
ZIP-level market 48229
- Home prices YoY
- 33.9%
- Active inventory
- 56
- Price-to-rent
- 5.0×
Monthly cashflow live
- Estimated rent
- $1,176 high interval (Pro) →
- Mortgage (P&I)
- −$367
- Tax from tax record
- −$180 /mo · $2,158/yr
- Insurance
- −$29
- HOA
- −$0
- Vacancy / Maint / Mgmt
- −$247
- Net cashflow
- $353
Break-even live
UW: 25.0% down · 7.5% · 30yr · 1.5% tax · 5.0% vac · 8.0% maint · 8.0% mgmt
Financing live
Cash to close
- Down payment
- $17,500
- Closing costs
- $2,100
- Reserves months
- —
- Total cash needed
- —
Loan-product check · same deal, 3 products live
Conventional
25% down · 7.5% · 30yr
- Down + closing
- —
- Monthly P&I
- —
- Monthly cashflow
- —
- DSCR
- —
- Eligible?
- —
Personal DTI + credit; lowest rate.
DSCR
20% down · 8.5% · 30yr
- Down + closing
- —
- Monthly P&I
- —
- Monthly cashflow
- —
- DSCR
- —
- Eligible?
- —
No personal income docs; deal must DSCR.
Hard money
10% down · 12.0% · 12mo
- Down + closing
- —
- Monthly P&I
- —
- Monthly cashflow
- —
- DSCR
- —
- Eligible?
- —
Short-term bridge; refi at stabilization.
Rent comps 15 comps
| Address | Beds | Baths | Sqft | Rent | $/sqft | DOM | Units | Dist |
|---|---|---|---|---|---|---|---|---|
| 4435 High St Ecorse, MI | 2.0 | 1.0 | 792 | $1,095 | $1.38 | 5d | 1 | 0.52mi |
| 4282 7th St Ecorse, MI | 3.0 | 1.0 | 1144 | $1,250 | $1.09 | 24d | 1 | 0.57mi |
| 4471 High St Unit 81-13 Ecorse, MI | 2.0 | 1.0 | 700 | $1,050 | $1.50 | 24d | 1 | 0.60mi |
| 4471 High St Unit 71-7 Ecorse, MI | 2.0 | 1.0 | 700 | $1,150 | $1.64 | 24d | 1 | 0.60mi |
| 4581 High St Unit 13 Ecorse, MI | 2.0 | 1.0 | 700 | $1,050 | $1.50 | 24d | 1 | 0.81mi |
| 4573 3rd St Ecorse, MI | 2.0 | 1.0 | 1000 | $1,300 | $1.30 | 15d | 1 | 0.86mi |
| 4015 16th St Ecorse, MI | 3.0 | 1.5 | 1170 | $1,300 | $1.11 | 24d | 1 | 0.89mi |
| 88 Hill St Unit 2 River Rouge, MI | 1.0 | 1.0 | 700 | $800 | $1.14 | 24d | 1 | 0.98mi |
| 3801 18th St Ecorse, MI | 3.0 | 1.0 | 1196 | $1,150 | $0.96 | 17d | 1 | 1.09mi |
| 800 Montie Rd Apt 12 Lincoln Park, MI | 1.0 | 1.0 | 700 | $1,000 | $1.43 | 24d | 1 | 1.14mi |
| 1473 Empire Ave Lincoln Park, MI | 3.0 | 2.0 | 1342 | $1,700 | $1.27 | 1d | 1 | 1.15mi |
| 3575 S Ethel St Detroit, MI | 3.0 | 1.0 | 894 | $1,350 | $1.51 | 17d | 1 | 1.16mi |
| 1581 Empire Ave Lincoln Park, MI | 2.0 | 1.0 | 900 | $1,350 | $1.50 | 24d | 1 | 1.21mi |
| 1583 Empire Ave Lincoln Park, MI | 1.0 | 1.0 | 700 | $1,050 | $1.50 | 24d | 1 | 1.21mi |
| 1563 Wilson Ave Lincoln Park, MI | 1.0 | 1.0 | 750 | $895 | $1.19 | 5d | 1 | 1.39mi |
Listing history 17 events
-
2026-06-18days on market $70,000 Active 44 DOM
-
2026-06-17days on market $70,000 Active 43 DOM
-
2026-06-16days on market $70,000 Active 42 DOM
-
2026-06-15days on market $70,000 Active 41 DOM
-
2026-06-13days on market $70,000 Active 39 DOM
-
2026-06-09days on market $70,000 Active 35 DOM
-
2026-06-08days on market $70,000 Active 34 DOM
-
2026-06-07days on market $70,000 Active 33 DOM
-
2026-06-04days on market $70,000 Active 30 DOM
-
2026-06-03days on market $70,000 Active 29 DOM
-
2026-06-02pricedays on market $70,000 Active 28 DOM
-
2026-06-01days on market $72,000 Active 27 DOM
-
2026-05-31days on market $72,000 Active 26 DOM
-
2026-05-08price $72,000 445-char remark
Show marketing remark (445 chars)
Beautifully updated 2-bedroom home priced below market for a quick sale. Updated within the last year with new flooring, fresh paint, and an updated kitchen. Solid home with a clean, inviting interior and strong overall appeal. Exterior could use a little TLC, but the home offers great value for a first-time buyer, downsizer, or investor. Excellent opportunity to own an affordable property with updates already completed. Priced to sell fast.
-
2026-05-08price $72,000
Show marketing remark (445 chars)
Beautifully updated 2-bedroom home priced below market for a quick sale. Updated within the last year with new flooring, fresh paint, and an updated kitchen. Solid home with a clean, inviting interior and strong overall appeal. Exterior could use a little TLC, but the home offers great value for a first-time buyer, downsizer, or investor. Excellent opportunity to own an affordable property with updates already completed. Priced to sell fast.
-
2026-05-05$75,000 Active 445-char remark
Show marketing remark (445 chars)
Beautifully updated 2-bedroom home priced below market for a quick sale. Updated within the last year with new flooring, fresh paint, and an updated kitchen. Solid home with a clean, inviting interior and strong overall appeal. Exterior could use a little TLC, but the home offers great value for a first-time buyer, downsizer, or investor. Excellent opportunity to own an affordable property with updates already completed. Priced to sell fast.
-
2026-05-05$75,000 Active
Show marketing remark (445 chars)
Beautifully updated 2-bedroom home priced below market for a quick sale. Updated within the last year with new flooring, fresh paint, and an updated kitchen. Solid home with a clean, inviting interior and strong overall appeal. Exterior could use a little TLC, but the home offers great value for a first-time buyer, downsizer, or investor. Excellent opportunity to own an affordable property with updates already completed. Priced to sell fast.
ⓘ Source: listings_history table (triggers on properties + properties_extension) + one-shot
backfill from property_details.listing_events for pre-trigger history.
Tax reassessment forecast MI · Partial reset (capped growth)
- Current annual tax
- $2,158 · $180/mo
- Projected year-2 tax
- $2,158 · $180/mo
- Expected delta
- $0/yr ($0/mo · 0.0%)
ⓘ Screening estimate from a state-policy table — verify with the county assessor before closing.
Climate risk First Street
- Flood 2/10 Low FEMA zone X (unshaded) · 6% chance over 30 yrs
- Wildfire 1/10 Low
- Heat 3/10 Moderate 7 d/yr ≥95°F today · 16 d/yr by 30 yrs out
- Wind 2/10 Low
- Air quality 4/10 Moderate 6 unhealthy d/yr today · 6 by 30 yrs out
Nearby sold comps map
Loading sold comps map…
Walkable amenities ~0.75 mi
Loading nearby amenities…
Taxation est. · year 1
- Rental income
- $14,116
- − Mortgage interest
- −$3,921
- − Property taxes
- −$2,158
- − Insurance
- −$350
- − Repairs & maintenance
- −$1,129
- − Management
- −$1,129
- − Depreciation
- −$2,036
- Taxable income
- $3,392
- Est. tax owed @ 24.0%
- −$814
- After-tax cash flow
- $3,424/yr
For passive investors: Depreciation is non-cash, so a rental often shows a tax loss while cash-flowing — sheltering income. Rental losses are passive: they offset passive income freely, and up to $25,000/yr can offset ordinary (W-2) income if you actively participate and your MAGI is under $100k (phasing out to $0 by $150k); unused losses carry forward. On sale, claimed depreciation is recaptured at up to 25%, and gains may owe capital-gains tax (a 1031 exchange can defer both). Figures are a year-1 estimate at your 24.0% rate — not tax advice; consult a CPA.
Schools (NCES district)
- District
- Ecorse Public Schools
- NCES district ID
- 2612930
- Math proficiency
- 3% ▼ -4.00%
- Reading proficiency
- 7% ▼ -6.00%
- Median HH income
- $28,957
- Composite
- 3.46/100
- National rank
- #10075
- State rank
- #536 of 540 in MI
Livability — Ecorse
- Score
- 69/100
- State rank
- #348
- US rank
- #8880
Category grades
Schools grade is shown separately in the Schools card above.
Census & demographics
- Census place
- Ecorse, MI
- City population
- 9,166
- Population (ZIP)
- 9,166
Population outlook (Wayne County) Hauer SSP2
- Today (2025)
- 1,675,273 people
- By 2030
- 1,620,300 · -3.3%
- By 2040
- 1,502,341 · -10.3%
- By 2050
- 1,384,039 · -17.4%
- By 2075
- 1,124,592 · -32.9%
- By 2100
- 881,193 · -47.4%
Race, ethnicity, and origin ACS 2023
- Neighborhood character
- Diverse neighborhood (Simpson 0.69)
- Race & ethnicity
- Black 45% White 26% Hispanic / Latino 21% Two or more races 15% Native American 4%
- Hispanic origin (detail)
- Mexican 18% Puerto Rican 1%
- Common ancestry
- Lithuanian 3% Romanian 2% Slovak 1%
- Foreign-born
- 4% · Canada, Guatemala, Jamaica
- Languages at home
- 86% English-only · Spanish 13%
Political lean MEDSL · Wayne
- 2024 margin
- Strong D (+29.0) · D 62.7% · R 33.7% · Other 3.6%
- 2008→2024 swing
- -20.5pp toward R · 2008: 49.5pp · 2024: 29.0pp
- All cycles
- 2024: D+29.0 2020: D+38.1 2016: D+37.3 2012: D+46.9 2008: D+49.5
Not yet ingested
- Civics
- —
Market trends
- HPI YoY
- ▲ 102.51%
- Current HPI
- 404.5927
- Rent YoY
- —
- Metro
- —
- State GDP YoY
- ▲ 1.37%
- F500 in state
- 28
Industry mix (Fortune 500 HQ in MI)
| Industry | F500 HQs | Revenue |
|---|---|---|
| Automotive Parts | 3 | $48B |
|
||
| Automotive | 2 | $372B |
|
||
| Chemicals | 1 | $45B |
|
||
| Automotive Retail | 1 | $29B |
|
||
| Healthcare / Medical Devices | 1 | $23B |
|
||
| Automotive Technology | 1 | $20B |
|
||
Price history
-4.0% since first listed4 events — show timeline
- 2026-05-08 Price Changed $72,000 MiRealSource-MiMLS
- 2026-05-08 Price Changed $72,000 REALCOMP
- 2026-05-05 Listed $75,000 REALCOMP
- 2026-05-05 Listed $75,000 MiRealSource-MiMLS
Property tax history
+3.6%/yrLatest (2025): $2,158 · -48.3% YoY. Source: county tax records.
Cash-flow waterfall
monthlySold comps — $/sqft
last 12 mo · ≤1 miLoading sold comps…