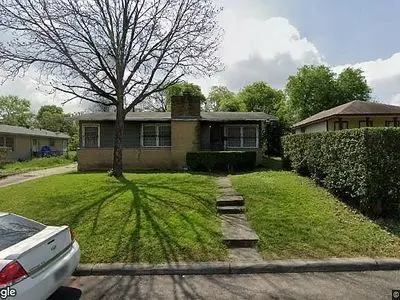
118 Sterling St · San Antonio, TX
Flood risk 1/10 · Minimal
- FEMA flood zone
- X (unshaded)
- Chance of flooding over 30 yrs
- 0.0%
- Est. flood insurance / yr
- $507 – $1,088
Fire risk 1/10 · Minimal
- Est. fire insurance / yr
- $1,222 – $2,270
Heat risk 8/10 · Major
- Hot days now (above 108°F)
- 7 days/yr
- Hot days in 30 yrs
- 22 days/yr
Wind risk 8/10 · Major
- Chance of severe wind over 30 yrs
- 80.0%
Air-quality risk 2/10 · Minimal
- Unhealthy air days now
- 0 days/yr
- Unhealthy air days in 30 yrs
- 2 days/yr
Risk factors via First Street. Map © Google.
Why this score? — see what drove the C grade
The composite is a weighted blend of 9 inputs, each scored 0–100. Each bar is that input's sub-score; the figure is the points it added to the 100-point composite (weight × sub-score).
- ARV discount +15.0/15.0
- Cash flow +14.5/30.0
- Appreciation +10.0/10.0
- 1% rule +4.6/10.0
- DSCR +4.4/10.0
- Livability +4.0/5.0
- Rent growth +2.6/5.0
- Condition / age +2.5/5.0
- Schools +1.4/10.0
$175,000
🖨 Deal sheet 📄 Offer letter ✓ Due diligence
Listing remarks
No calls until after 5p. m. please, I cannot be inundated with calls at work. The house has a den, 3 bedrooms and two bathrooms and a detached garage. .The foundation needs to be done. It needs TLC. I will post more pictures later. The roof was done this year. . the AC unit is 2 years old I believe. The patio and driveway do have some cracks. . Guest bathroom needs some repair. . The house needs to be updated. You are welcome to schedule a viewing. Thank you.
Key facts
- Built 1951
- Listed 29 days
Property features AI
Exterior
- Home design: Built in 1951
- Exterior features: Living area approximately 1608 square feet
Interior
- Interior features: Subdivision: East Side
Neighborhood map
What this means for you Summary
Snapshot
- This is a 3-bed/2.0-bath single-family listed at $175k.
Deal economics
- At list price, monthly cash flow is $39 ($463/yr) — positive.
- The deal already cash-flows at list — no discount required.
- To meet the 1% rule (rent ≥ 1% of price), the offer needs to be $167k (4.4% below list).
- Recommended offer: $167k (4.4% below list) — sets the bar for 1% rule.
- Cap rate 6.6% vs local median 3.8% in San Antonio — top-decile yield for the area; either an underpriced asset or a hidden risk that comps aren't pricing in. Stress-test before assuming the spread holds.
Location & tenants
- Location reads 80/100 on livability (#31 in TX, #1,616 nationally) — a professional / high-income tenant draw. Strengths: amenities A+, commute A+, cost of living A+; Watch: schools C-, crime F.
- San Antonio ISD (urban): math 12% / reading 22% proficiency, ranked #805 of 826 in TX (top 98%) — low school quality limits family demand, transient renter base, plan for 1-2y turnover; 80% free/reduced lunch — lower-income household profile, screen leases tightly.
- Market conditions: Rents flat; 113 active listings in the ZIP; 40 comparable units currently listed for rent nearby; rentals at typical pace (median 24d on market — plan ~3-4 weeks tenant-placement turnaround); lower-income renter base — watch delinquency; 8,308 units permitted in Bexar County in 2024 (2,506 in 5+ unit buildings).
- At $1,673/mo this rent would consume 48% of the median local household income ($42k/yr) (locally 705% of renters already pay >50% of income on rent) — very limited rent-growth headroom before tenants either downsize or default.
Forward outlook
- In year one you build about $19k of equity ($1k loan paydown + $18k appreciation (10.0% local appreciation)).
- Bexar County population projected at +50% by 2050 — long-run rental-demand tailwind backs the buy-and-hold thesis.
- At projected returns (10.0% appreciation + 0.5% rent growth), your $49k cash investment doubles in ~3 years — after that, you're playing with house money.
- By year 2, paydown + projected appreciation supports a ~$30k cash-out refi (75% LTV) — recoverable capital for the next deal without selling this one.
Negotiation context
- It's been on market 29 days — a 2% lower offer ($172k) is reasonable based on typical stale-listing flexibility.
Risks & watch-outs
- Watch-outs: built in 1951 — expect roof / HVAC / electrical / plumbing capex.
- Climate carrying-cost: severe wind risk, 80% chance of damaging wind over 30y; extreme-heat days projected 7→22/yr by 2055 (HVAC capex compounding) — expect insurance premiums to compound above CPI over the hold.
Questions for the listing agent
- Built in 1951 — when were the roof, HVAC, electrical panel, plumbing, and water heater last replaced?
- Is there a deadline driving the sale (1031 exchange, divorce, estate, relocation)? That informs how much negotiation room exists.
- Crime grade is F in this area — have there been break-ins, vandalism, or insurance claims at this property in the last 3 years? What carrier currently insures it and at what premium?
- What's the average days-on-market for RENTAL listings here right now (not sales)? A rising rental-DOM trend means longer vacancies and softer asking-rent achievability than the comps imply.
- What's the recent tenant-quality profile in this submarket — average credit score on applications, eviction rate, late-payment / NSF rate, and stable-employment percentage? A property-management company in the area should have these aggregated.
- How much new for-sale + rental construction is in the pipeline within 1–3 miles? Heavy new supply typically softens prices + rents 12–24 months out; constrained supply supports both.
Investment metrics
- 1% rule
- 0.96% ✗
- Cap rate
- 6.56%
- Cash-on-cash
- 0.95%
- DSCR
- 1.04
- GRM
- 8.7
CMA / ARV
- ARV (on-the-fly)
- $258,888
- Comps found
- 10
Show comp detail 10 sales within ~0.75 mi
| Address | Dist | Beds/Ba | Sqft | Sold | Price | $/sf | Match |
|---|---|---|---|---|---|---|---|
| 719 Amanda | 0.44mi | 3/2.0 | 1,545 (-4%) | 9mo | $278,000 | $180 | 66 |
| 414 Como | 0.56mi | 3/2.0 | 1,600 (-0%) | 9mo | $275,999 | $172 | 66 |
| 2134 Virginia Blvd | 0.59mi | 3/2.0 | 1,634 (+2%) | 8mo | $203,000 | $124 | 63 |
| 554 Yucca St | 0.23mi | 3/2.0 | 1,456 (-10%) | 16mo | $230,000 | $158 | 60 |
| 139 Reichert St | 0.54mi | 3/2.0 | 1,447 (-10%) | 2mo | $260,000 | $180 | 57 |
| 250 Bundy | 0.63mi | 4/2.0 (+1) | 1,493 (-7%) | 4mo | $239,900 | $161 | 51 |
| 2035 Martin Luther King | 0.59mi | 3/2.0 | 1,792 (+11%) | 7mo | $229,700 | $128 | 48 |
| 119 J | 0.68mi | 4/2.0 (+1) | 1,452 (-10%) | 2mo | $80,500 | $55 | 45 |
| 427 Morningview | 0.59mi | 3/2.0 | 1,500 (-7%) | 20mo | $245,000 | $163 | 45 |
| 2310 Martin Luther King Dr | 0.40mi | 4/2.0 (+1) | 1,398 (-13%) | 13mo | $199,000 | $142 | 44 |
Match score weights: distance 35% · size 25% · config 20% · recency 20%. Top-matched comps best support the ARV.
Projected returns pro-forma
10.0% appreciation · 0.53% rent growth · sell at horizon
- IRR
- 24.1%
- Equity multiple
- 2.91×
- Total profit
- $93,781
- Equity at exit
- $157,654
- IRR
- 20.7%
- Equity multiple
- 6.45×
- Total profit
- $266,943
- Equity at exit
- $339,987
Cash invested: $49,000 (down + closing). Projections, not guarantees.
Landlord ↔ Tenant lean methodology
- Overall (STATE)
- 87 Strongly Landlord-Friendly
- State Texas
- 87 Strongly Landlord-Friendly · R+5
- County
- — inherits STATE
- City
- — inherits STATE
ZIP-level market 78220
- Home prices YoY
- 9.1%
- Rents YoY
- 0.5%
- Active inventory
- 113
- Price-to-rent
- 8.7×
Monthly cashflow live
- Estimated rent
- $1,673 high interval (Pro) →
- Mortgage (P&I)
- −$918
- Tax from tax record
- −$293 /mo · $3,512/yr
- Insurance
- −$73
- HOA
- −$0
- Vacancy / Maint / Mgmt
- −$351
- Net cashflow
- $39
Break-even live
UW: 25.0% down · 7.5% · 30yr · 1.5% tax · 5.0% vac · 8.0% maint · 8.0% mgmt
Financing live
Cash to close
- Down payment
- $43,750
- Closing costs
- $5,250
- Reserves months
- —
- Total cash needed
- —
Loan-product check · same deal, 3 products live
Conventional
25% down · 7.5% · 30yr
- Down + closing
- —
- Monthly P&I
- —
- Monthly cashflow
- —
- DSCR
- —
- Eligible?
- —
Personal DTI + credit; lowest rate.
DSCR
20% down · 8.5% · 30yr
- Down + closing
- —
- Monthly P&I
- —
- Monthly cashflow
- —
- DSCR
- —
- Eligible?
- —
No personal income docs; deal must DSCR.
Hard money
10% down · 12.0% · 12mo
- Down + closing
- —
- Monthly P&I
- —
- Monthly cashflow
- —
- DSCR
- —
- Eligible?
- —
Short-term bridge; refi at stabilization.
Rent comps 40 comps
| Address | Beds | Baths | Sqft | Rent | $/sqft | DOM | Units | Dist |
|---|---|---|---|---|---|---|---|---|
| 154 Ferris Ave San Antonio, TX | 3.0 | 2.0 | 1438 | $1,275 | $0.89 | 21d | 1 | 0.23mi |
| 154 Ferris Ave San Antonio, TX | 3.0 | 2.0 | 1438 | $1,499 | $1.04 | 43d | 1 | 0.23mi |
| 323 Ferris Ave San Antonio, TX | 3.0 | 2.0 | 1298 | $1,450 | $1.12 | 1d | 1 | 0.54mi |
| 406 Como St San Antonio, TX | 3.0 | 1.5 | 1278 | $1,350 | $1.06 | 43d | 1 | 0.54mi |
| 610 Pecan Valley Dr San Antonio, TX | 3.0 | 1.0 | 1287 | $1,650 | $1.28 | 43d | 1 | 0.55mi |
| 2346 Dakota St Unit 1101 San Antonio, TX | 2.0 | 1.0 | 1728 | $1,250 | $0.72 | 16d | 1 | 0.62mi |
| 113 Anderson Ave Unit 101 San Antonio, TX | 3.0 | 2.5 | 1539 | $1,700 | $1.10 | 43d | 1 | 0.65mi |
| 227 S Grimes St Unit 202 San Antonio, TX | 3.0 | 2.5 | 1089 | $1,550 | $1.42 | 43d | 1 | 0.66mi |
| 314 Maryland St Unit 102 San Antonio, TX | 2.0 | 2.5 | 1055 | $1,295 | $1.23 | 43d | 1 | 0.71mi |
| 318 Ferguson Ave Unit 1 San Antonio, TX | 3.0 | 2.0 | 1450 | $1,550 | $1.07 | 4d | 1 | 0.74mi |
| 139 San Salvador Ave Unit 103 San Antonio, TX | 2.0 | 2.5 | 1245 | $1,490 | $1.20 | 14d | 1 | 0.75mi |
| 1431 Aransas Ave San Antonio, TX | 3.0 | 1.0 | 1108 | $1,195 | $1.08 | 14d | 1 | 0.75mi |
| 610 Belmont San Antonio, TX | 2.0 | 1.0 | 1050 | $1,195 | $1.14 | 43d | 1 | 0.76mi |
| 215 Coca-Cola Pl Unit 305 San Antonio, TX | 3.0 | 2.5 | 2032 | $2,990 | $1.47 | 23d | 1 | 0.76mi |
| 215 Coca-Cola Pl Unit 304 San Antonio, TX | 2.0 | 2.5 | 2094 | $2,990 | $1.43 | 19d | 1 | 0.76mi |
| 3363 E Commerce St #147 San Antonio, TX | 2.0 | 1.5 | 1990 | $2,825 | $1.42 | 43d | 1 | 0.76mi |
| 1827 Montana St #101 San Antonio, TX | 3.0 | 2.5 | 1859 | $2,250 | $1.21 | 1d | 1 | 0.76mi |
| 322 Vine St #102 San Antonio, TX | 3.0 | 2.5 | 1401 | $1,400 | $1.00 | 23d | 1 | 0.79mi |
| 215 Coca-Cola Pl Unit 313 San Antonio, TX | 3.0 | 2.5 | 2119 | $3,490 | $1.65 | 43d | 1 | 0.79mi |
| 215 San Salvador Ave Unit 101 San Antonio, TX | 3.0 | 2.5 | 1783 | $1,595 | $0.89 | 4d | 1 | 0.81mi |
| 313 San Salvador Ave San Antonio, TX | 4.0 | 2.5 | 1240 | $1,395 | $1.12 | 43d | 1 | 0.82mi |
| 122 S Walters St San Antonio, TX | 3.0 | 3.0 | 2000 | $2,200 | $1.10 | 43d | 1 | 0.82mi |
| 512 Cooper St San Antonio, TX | 2.0 | 1.0 | 1116 | $1,295 | $1.16 | 23d | 1 | 0.83mi |
| 307 San Salvador Ave Unit 101 San Antonio, TX | 3.0 | 2.5 | 1783 | $1,595 | $0.89 | 4d | 1 | 0.83mi |
| 1518 S Walters St Unit 102 San Antonio, TX | 3.0 | 2.5 | 1180 | $1,400 | $1.19 | 4d | 1 | 0.86mi |
| 242 Vine St San Antonio, TX | 4.0 | 2.0 | 1250 | $1,695 | $1.36 | 43d | 1 | 0.87mi |
| 1303 Essex St #102 San Antonio, TX | 3.0 | 2.5 | 1180 | $1,400 | $1.19 | 23d | 1 | 0.87mi |
| 2018 E Drexel Ave San Antonio, TX | 3.0 | 2.0 | 1268 | $1,750 | $1.38 | 23d | 1 | 0.90mi |
| 2818 E Houston St San Antonio, TX | 3.0 | 1.0 | 1184 | $1,495 | $1.26 | 14d | 1 | 0.95mi |
| 147 Vine St San Antonio, TX | 3.0 | 3.0 | 1438 | $1,700 | $1.18 | 23d | 1 | 1.00mi |
| 164 Day Rd San Antonio, TX | 3.0 | 2.5 | 1250 | $1,667 | $1.33 | 23d | 1 | 1.01mi |
| 906 Gulf St Unit 102 San Antonio, TX | 3.0 | 2.0 | 1300 | $1,750 | $1.35 | 4d | 1 | 1.02mi |
| 302 Cooper St Unit 201 San Antonio, TX | 4.0 | 2.0 | 1170 | $1,500 | $1.28 | 4d | 1 | 1.11mi |
| 302 Cooper St Unit 201 San Antonio, TX | 4.0 | 2.0 | 1170 | $1,500 | $1.28 | 43d | 1 | 1.11mi |
| 214 Nopal St Unit 201 San Antonio, TX | 4.0 | 2.0 | 1170 | $1,500 | $1.28 | 43d | 1 | 1.12mi |
| 521 S Polaris St San Antonio, TX | 3.0 | 1.0 | 1200 | $1,249 | $1.04 | 4d | 1 | 1.12mi |
| 1622 Gorman San Antonio, TX | 3.0 | 2.0 | 1189 | $1,325 | $1.11 | 17d | 1 | 1.13mi |
| 1618 Dakota St Unit 102 San Antonio, TX | 3.0 | 2.5 | 1768 | $1,925 | $1.09 | 16d | 1 | 1.14mi |
| 123 Dilworth St San Antonio, TX | 3.0 | 2.0 | 1384 | $1,900 | $1.37 | 43d | 1 | 1.16mi |
| 113 Dilworth St San Antonio, TX | 3.0 | 3.0 | 1383 | $1,850 | $1.34 | 23d | 1 | 1.18mi |
Listing history 16 events
-
2026-06-18days on market $175,000 Active 29 DOM
-
2026-06-17days on market $175,000 Active 28 DOM
-
2026-06-16days on market $175,000 Active 27 DOM
-
2026-06-15days on market $175,000 Active 26 DOM
-
2026-06-13days on market $175,000 Active 24 DOM
-
2026-06-09days on market $175,000 Active 20 DOM
-
2026-06-08days on market $175,000 Active 19 DOM
-
2026-06-07days on market $175,000 Active 18 DOM
-
2026-06-04days on market $175,000 Active 15 DOM
-
2026-06-03days on market $175,000 Active 14 DOM
-
2026-06-02days on market $175,000 Active 13 DOM
-
2026-06-01days on market $175,000 Active 12 DOM
-
2026-05-31days on market $175,000 Active 11 DOM
-
2026-05-20$175,000 Active
-
2002-03-15soldstatus
-
2002-03-15soldstatus
ⓘ Source: listings_history table (triggers on properties + properties_extension) + one-shot
backfill from property_details.listing_events for pre-trigger history.
Tax reassessment forecast TX · Resets to sale price
- Current annual tax
- $3,512 · $293/mo
- Projected year-2 tax
- $3,512 · $293/mo
- Expected delta
- $0/yr ($0/mo · 0.0%)
ⓘ Screening estimate from a state-policy table — verify with the county assessor before closing.
Climate risk First Street
- Flood 1/10 Low FEMA zone X (unshaded) · 0% chance over 30 yrs
- Wildfire 1/10 Low
- Heat 8/10 Severe 7 d/yr ≥108°F today · 22 d/yr by 30 yrs out
- Wind 8/10 Severe 80% chance of damaging wind over 30 yrs
- Air quality 2/10 Low 0 unhealthy d/yr today · 2 by 30 yrs out
Nearby sold comps map
Loading sold comps map…
Walkable amenities ~0.75 mi
Loading nearby amenities…
Taxation est. · year 1
- Rental income
- $20,080
- − Mortgage interest
- −$9,803
- − Property taxes
- −$3,512
- − Insurance
- −$875
- − Repairs & maintenance
- −$1,606
- − Management
- −$1,606
- − Depreciation
- −$5,091
- Taxable loss
- −$2,414
- Est. tax savings @ 24.0%
- +$579
- After-tax cash flow
- $1,043/yr
For passive investors: Depreciation is non-cash, so a rental often shows a tax loss while cash-flowing — sheltering income. Rental losses are passive: they offset passive income freely, and up to $25,000/yr can offset ordinary (W-2) income if you actively participate and your MAGI is under $100k (phasing out to $0 by $150k); unused losses carry forward. On sale, claimed depreciation is recaptured at up to 25%, and gains may owe capital-gains tax (a 1031 exchange can defer both). Figures are a year-1 estimate at your 24.0% rate — not tax advice; consult a CPA.
Schools (NCES district)
- District
- San Antonio ISD
- NCES district ID
- 4838730
- Math proficiency
- 12% ▼ -21.00%
- Reading proficiency
- 22% ▼ -7.00%
- Median HH income
- $30,952
- Composite
- 13.57/100
- National rank
- #9512
- State rank
- #805 of 826 in TX
Livability — San Antonio
- Score
- 80/100
- State rank
- #31
- US rank
- #1616
Category grades
Schools grade is shown separately in the Schools card above.
Census & demographics
- Census place
- San Antonio, TX
- County
- Bexar County · 1,990,555 people
- City population
- 1,806,925
- Metro
- San Antonio-New Braunfels, TX
- Population (ZIP)
- 19,423
- Household income
- $41,710
- Rent vs Own
- Severe rent burden
- 705.0
Population outlook (Bexar County) Hauer SSP2
- Today (2025)
- 2,336,851 people
- By 2030
- 2,560,728 · +9.6%
- By 2040
- 3,020,569 · +29.3%
- By 2050
- 3,493,522 · +49.5%
- By 2075
- 4,668,459 · +99.8%
- By 2100
- 5,533,242 · +136.8%
Race, ethnicity, and origin ACS 2023
- Neighborhood character
- Majority Hispanic (60%)
- Race & ethnicity
- Hispanic / Latino 60% Black 30% Two or more races 22% White 8%
- Hispanic origin (detail)
- Mexican 47% Puerto Rican 1%
- Foreign-born
- 11% · Canada
- Languages at home
- 63% English-only · Spanish 36%
Political lean MEDSL · Bexar
- 2024 margin
- Lean D (+9.8) · D 54.3% · R 44.6% · Other 1.1%
- 2008→2024 swing
- +4.2pp toward D · 2008: 5.6pp · 2024: 9.8pp
- All cycles
- 2024: D+9.8 2020: D+18.2 2016: D+13.5 2012: D+4.6 2008: D+5.6
Not yet ingested
- Civics
- —
Market trends
- HPI YoY
- ▲ 23.86%
- Current HPI
- 284.9844
- Rent YoY
- ▲ 0.53%
- Metro
- San Antonio-New Braunfels, TX
- State GDP YoY
- ▲ 3.95%
- F500 in state
- 110
Industry mix (Fortune 500 HQ in TX)
| Industry | F500 HQs | Revenue |
|---|---|---|
| Energy | 16 | $1,198B |
|
||
| Technology | 5 | $198B |
|
||
| Engineering / Construction | 4 | $72B |
|
||
| Energy Services | 3 | $60B |
|
||
| Utilities | 3 | $41B |
|
||
| Healthcare | 2 | $330B |
|
||
Price history
3 events — show timeline
- 2026-05-20 Listed $175,000 FSBO.com
- 2002-03-15 Sold (Public Records) — Public Records
- 2002-03-15 Sold (Public Records) — Public Records
Property tax history
+6.4%/yrLatest (2025): $3,512 · +10.0% YoY. Source: county tax records.
Cash-flow waterfall
monthlySold comps — $/sqft
last 12 mo · ≤1 miLoading sold comps…