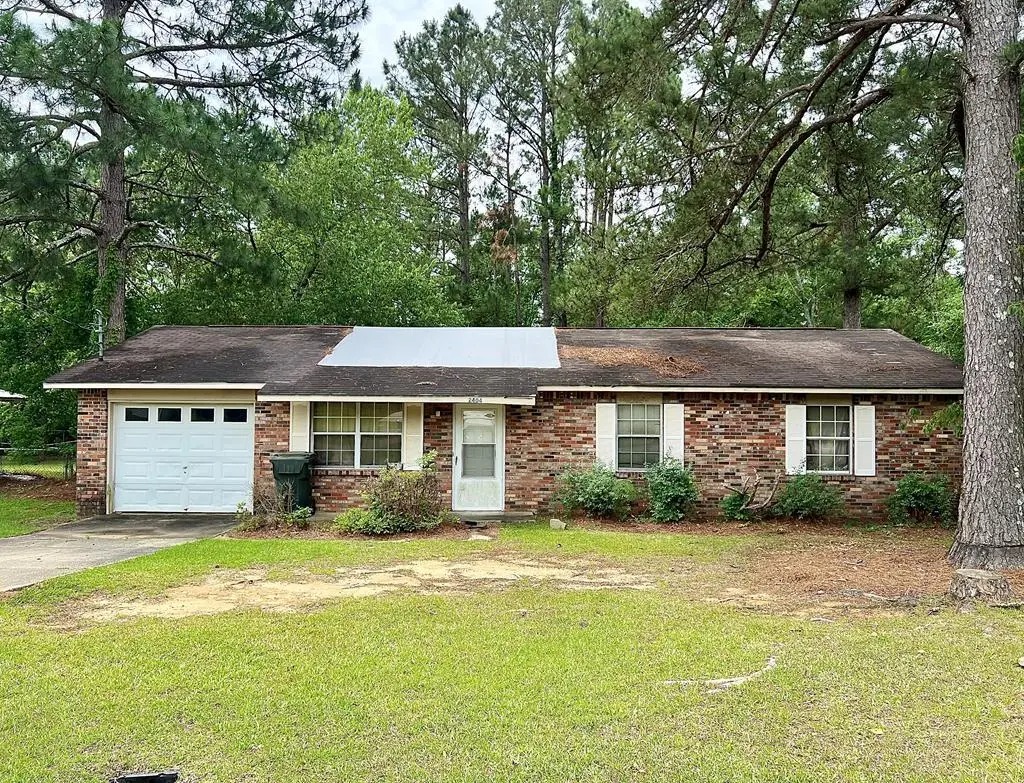
2404 Glen Haven Dr · Dothan, AL
Flood risk 1/10 · Minimal
- FEMA flood zone
- X (unshaded)
- Chance of flooding over 30 yrs
- 0.0%
- Est. flood insurance / yr
- $507 – $1,088
Fire risk 4/10 · Minor
- Est. fire insurance / yr
- $916 – $1,700
Heat risk 8/10 · Major
- Hot days now (above 107°F)
- 7 days/yr
- Hot days in 30 yrs
- 19 days/yr
Wind risk 8/10 · Major
- Chance of severe wind over 30 yrs
- 99.0%
Air-quality risk 4/10 · Minor
- Unhealthy air days now
- 5 days/yr
- Unhealthy air days in 30 yrs
- 6 days/yr
Risk factors via First Street. Map © Google.
Why this score? — see what drove the B grade
The composite is a weighted blend of 9 inputs, each scored 0–100. Each bar is that input's sub-score; the figure is the points it added to the 100-point composite (weight × sub-score).
- Cash flow +30.0/30.0
- ARV discount +13.1/15.0
- DSCR +10.0/10.0
- 1% rule +8.1/10.0
- Livability +3.2/5.0
- Rent growth +2.5/5.0
- Schools +2.5/10.0
- Condition / age +2.5/5.0
- Appreciation +0.0/10.0
$115,400
🖨 Deal sheet 📄 Offer letter ✓ Due diligence
Listing remarks
Calling ALL investors! Brick home in Glen Haven Subdivision. Home has 3 bedroom, 2 bath, large backyard. Home is being SOLD "AS-IS"! SUBJECT TO PROBATE COURT APPROVAL
Key facts
- 0.32 acre lot
- Garage
- Built 1994
Property features AI
Exterior
- Parking: Attached carport; 1 covered parking space; 1 total parking space
- Utilities: Public water; Public sewer
- Home design: Single-family residence; One level
- Construction: Brick construction
- Exterior features: Patio or porch (other); Waterfront location
Interior
- Kitchen: Eat-in kitchen
- Flooring: Other flooring
- Bathrooms: 2 full bathrooms
- Interior features: Storage; Eat-in kitchen; Aluminum window frames
- Laundry & utility: Laundry in garage
Neighborhood map
What this means for you Summary
Snapshot
- This is a 3-bed/1.0-bath single-family listed at $115k.
Deal economics
- At list price, monthly cash flow is $508 ($6k/yr) — positive.
- The deal already cash-flows at list — no discount required.
- Meets the 1% rule at list price ($2k rent vs $115k).
- Cap rate 11.6% vs local median 4.4% in Dothan — top-decile yield for the area; either an underpriced asset or a hidden risk that comps aren't pricing in. Stress-test before assuming the spread holds.
Location & tenants
- Location reads 64/100 on livability (#146 in AL) — a middle-class / working-renter tenant base. Strengths: cost of living A+, housing A+, health & safety A+; Watch: employment D, crime F, amenities F.
- Dothan City (urban): math 19% / reading 39% proficiency, ranked #73 of 129 in AL (top 57%) — low school quality limits family demand, transient renter base, plan for 1-2y turnover.
- Zoned schools: Beverlye Intermediate School (math 6% / reading 25%, grade F, #503 of 627 statewide, top 80%, 388 students, 90% FRL); Dothan High School (math 16% / reading 24%, grade F, #163 of 305 statewide, top 54%, 1,454 students, 70% FRL) — zoned schools average 80% FRL vs 59% district-wide (21 pts higher); higher-poverty schools than district average — tighter screening recommended.
- Market conditions: 410 active listings in the ZIP; 6 comparable units currently listed for rent nearby; rentals lingering (median 44d on market — plan ~5-8 weeks vacancy on turnover, expect pricing pressure); 100% of comp listings sitting > 30 days — soft ceiling on asking rent; 463 units permitted in Houston County in 2024 (96 in 5+ unit buildings).
Forward outlook
- Local home prices are declining (-3.0%/yr); year-one equity from $798 of loan paydown is wiped out by about $3k of value loss. Plan a longer hold.
- Houston County population projected at +7% by 2050 — modest demand growth; plan on rents tracking national, not racing it.
- At projected returns (-3.0% appreciation + 3.0% rent growth), your $32k cash investment doubles in ~7 years — after that, you're playing with house money.
Negotiation context
- Only 5 days on market — expect competitive offers; lowballing is unlikely to land.
Risks & watch-outs
- Climate carrying-cost: severe wind risk, 99% chance of damaging wind over 30y; extreme-heat days projected 7→19/yr by 2055 (HVAC capex compounding) — expect insurance premiums to compound above CPI over the hold.
Questions for the listing agent
- Is there a deadline driving the sale (1031 exchange, divorce, estate, relocation)? That informs how much negotiation room exists.
- Schools are D-rated, which usually means shorter tenancies and higher turnover. Who's the typical renter profile here, and what's been the actual vacancy rate?
- Crime grade is F in this area — have there been break-ins, vandalism, or insurance claims at this property in the last 3 years? What carrier currently insures it and at what premium?
- What's the average days-on-market for RENTAL listings here right now (not sales)? A rising rental-DOM trend means longer vacancies and softer asking-rent achievability than the comps imply.
- What's the recent tenant-quality profile in this submarket — average credit score on applications, eviction rate, late-payment / NSF rate, and stable-employment percentage? A property-management company in the area should have these aggregated.
- How much new for-sale + rental construction is in the pipeline within 1–3 miles? Heavy new supply typically softens prices + rents 12–24 months out; constrained supply supports both.
Investment metrics
- 1% rule
- 1.31% ✓
- Cap rate
- 11.58%
- Cash-on-cash
- 18.87%
- DSCR
- 1.84
- GRM
- 6.4
CMA / ARV
- ARV (on-the-fly)
- $131,924
- Comps found
- 10
Show comp detail 10 sales within ~0.75 mi
| Address | Dist | Beds/Ba | Sqft | Sold | Price | $/sf | Match |
|---|---|---|---|---|---|---|---|
| 2210 E Glen Hvn | 0.10mi | 3/2.0 | 1,084 (-3%) | 6mo | $155,000 | $143 | 81 |
| 2507 Dykes St | 0.10mi | 2/2.0 (-1) | 1,056 (-6%) | 11mo | $125,000 | $118 | 68 |
| 103 Valley Crest Dr | 0.05mi | 2/2.0 (-1) | 1,056 (-6%) | 17mo | $116,000 | $110 | 66 |
| 2412 Glen Hvn | 0.05mi | 2/2.0 (-1) | 1,056 (-6%) | 17mo | $116,000 | $110 | 65 |
| 2410 Mimosa Dr | 0.33mi | 3/1.5 | 1,008 (-10%) | 3mo | $163,000 | $162 | 64 |
| 203 Pine Hills Dr | 0.43mi | 3/1.5 | 1,134 (+1%) | 22mo | $73,500 | $65 | 57 |
| 2304 Creekwood Dr | 0.43mi | 3/2.0 | 1,008 (-10%) | 23mo | $135,000 | $134 | 40 |
| 201 Peartree Cir | 0.47mi | 3/2.0 | 1,258 (+12%) | 19mo | $145,000 | $115 | 37 |
| 103 Arrowhead Dr | 0.64mi | 3/2.0 | 1,192 (+7%) | 21mo | $157,300 | $132 | 37 |
| 104 Sycamore St | 0.48mi | 3/2.0 | 1,258 (+12%) | 21mo | $145,000 | $115 | 35 |
Match score weights: distance 35% · size 25% · config 20% · recency 20%. Top-matched comps best support the ARV.
Projected returns pro-forma
-3.0% appreciation · 3.0% rent growth · sell at horizon
- IRR
- 10.7%
- Equity multiple
- 1.42×
- Total profit
- $13,612
- Equity at exit
- $17,207
- IRR
- 19.7%
- Equity multiple
- 2.65×
- Total profit
- $53,327
- Equity at exit
- $9,978
Cash invested: $32,312 (down + closing). Projections, not guarantees.
Landlord ↔ Tenant lean methodology
- Overall (STATE)
- 90 Strongly Landlord-Friendly
- State Alabama
- 90 Strongly Landlord-Friendly · R+15
- County
- — inherits STATE
- City
- — inherits STATE
ZIP-level market 36301
- Home prices YoY
- -24.9%
- Active inventory
- 410
- Price-to-rent
- 6.4×
Monthly cashflow live
- Estimated rent
- $1,508 high interval (Pro) →
- Mortgage (P&I)
- −$605
- Tax from tax record
- −$30 /mo · $360/yr
- Insurance
- −$48
- HOA
- −$0
- Vacancy / Maint / Mgmt
- −$317
- Net cashflow
- $508
Break-even live
UW: 25.0% down · 7.5% · 30yr · 1.5% tax · 5.0% vac · 8.0% maint · 8.0% mgmt
Financing live
Cash to close
- Down payment
- $28,850
- Closing costs
- $3,462
- Reserves months
- —
- Total cash needed
- —
Loan-product check · same deal, 3 products live
Conventional
25% down · 7.5% · 30yr
- Down + closing
- —
- Monthly P&I
- —
- Monthly cashflow
- —
- DSCR
- —
- Eligible?
- —
Personal DTI + credit; lowest rate.
DSCR
20% down · 8.5% · 30yr
- Down + closing
- —
- Monthly P&I
- —
- Monthly cashflow
- —
- DSCR
- —
- Eligible?
- —
No personal income docs; deal must DSCR.
Hard money
10% down · 12.0% · 12mo
- Down + closing
- —
- Monthly P&I
- —
- Monthly cashflow
- —
- DSCR
- —
- Eligible?
- —
Short-term bridge; refi at stabilization.
Rent comps 6 comps
| Address | Beds | Baths | Sqft | Rent | $/sqft | DOM | Units | Dist |
|---|---|---|---|---|---|---|---|---|
| 2211 Shannondoah Dr Dothan, AL | 3.0 | 2.0 | 1409 | $1,450 | $1.03 | 43d | 1 | 0.16mi |
| 413 Christopher Dr Miami, AL | 3.0 | 2.0 | 1482 | $2,900 | $1.96 | 43d | 1 | 1.14mi |
| 1009 Jonathan St Dothan, AL | 3.0 | 1.5 | 1318 | $1,300 | $0.99 | 43d | 1 | 1.26mi |
| 306 Mustang Dr Dothan, AL | 3.0 | 1.0 | 1301 | $1,050 | $0.81 | 43d | 1 | 1.39mi |
| 31 Trillium Cir Dothan, AL | 1.0–3.0 | 1.0–2.0 | 958 | $1,290 | $1.35 | 43d | 15 | 1.40mi |
| 151 Radford Cir Dothan, AL | 2.0 | 1.5 | 1171 | $1,400 | $1.20 | 43d | 1 | 1.43mi |
Listing history 2 events
-
2026-05-13status Pending
-
2026-05-08$115,400 Active
ⓘ Source: listings_history table (triggers on properties + properties_extension) + one-shot
backfill from property_details.listing_events for pre-trigger history.
Tax reassessment forecast AL · Resets to sale price
- Current annual tax
- $360 · $30/mo
- Projected year-2 tax
- $473 · $39/mo
- Expected delta
- +$113/yr (+$9/mo · 31.3%)
ⓘ Screening estimate from a state-policy table — verify with the county assessor before closing.
Climate risk First Street
- Flood 1/10 Low FEMA zone X (unshaded) · 0% chance over 30 yrs
- Wildfire 4/10 Moderate
- Heat 8/10 Severe 7 d/yr ≥107°F today · 19 d/yr by 30 yrs out
- Wind 8/10 Severe 99% chance of damaging wind over 30 yrs
- Air quality 4/10 Moderate 5 unhealthy d/yr today · 6 by 30 yrs out
Nearby sold comps map
Loading sold comps map…
Walkable amenities ~0.75 mi
Loading nearby amenities…
Taxation est. · year 1
- Rental income
- $18,096
- − Mortgage interest
- −$6,464
- − Property taxes
- −$360
- − Insurance
- −$577
- − Repairs & maintenance
- −$1,448
- − Management
- −$1,448
- − Depreciation
- −$3,357
- Taxable income
- $4,442
- Est. tax owed @ 24.0%
- −$1,066
- After-tax cash flow
- $5,031/yr
For passive investors: Depreciation is non-cash, so a rental often shows a tax loss while cash-flowing — sheltering income. Rental losses are passive: they offset passive income freely, and up to $25,000/yr can offset ordinary (W-2) income if you actively participate and your MAGI is under $100k (phasing out to $0 by $150k); unused losses carry forward. On sale, claimed depreciation is recaptured at up to 25%, and gains may owe capital-gains tax (a 1031 exchange can defer both). Figures are a year-1 estimate at your 24.0% rate — not tax advice; consult a CPA.
Schools (NCES district)
- District
- Dothan City
- NCES district ID
- 0101230
- Math proficiency
- 19% ▼ -23.00%
- Reading proficiency
- 39% ▼ -3.00%
- Median HH income
- $42,279
- Composite
- 24.56/100
- National rank
- #7640
- State rank
- #73 of 129 in AL
Livability — Dothan
- Score
- 64/100
- State rank
- #146
- US rank
- #13662
Category grades
Schools grade is shown separately in the Schools card above.
Census & demographics
- Census place
- Dothan, AL
- City population
- 47,783
- Population (ZIP)
- 38,627
Population outlook (Houston County) Hauer SSP2
- Today (2025)
- 110,280 people
- By 2030
- 112,668 · +2.2%
- By 2040
- 116,149 · +5.3%
- By 2050
- 117,805 · +6.8%
- By 2075
- 118,577 · +7.5%
- By 2100
- 110,940 · +0.6%
Race, ethnicity, and origin ACS 2023
- Neighborhood character
- Diverse neighborhood (Simpson 0.55)
- Race & ethnicity
- White 59% Black 31% Hispanic / Latino 5% Two or more races 5%
- Hispanic origin (detail)
- Mexican 3%
- Common ancestry
- Slovak 1% Italian 1% Lithuanian 1%
- Foreign-born
- 3% · Canada
- Languages at home
- 95% English-only · Spanish 4%
Political lean MEDSL · Houston
- 2024 margin
- Solid R (+47.8) · D 25.7% · R 73.5%
- 2008→2024 swing
- -7.0pp toward R · 2008: -40.8pp · 2024: -47.8pp
- All cycles
- 2024: R+47.8 2020: R+42.7 2016: R+47.6 2012: R+40.3 2008: R+40.8
Not yet ingested
- Civics
- —
Market trends
- HPI YoY
- ▼ -53.46%
- Current HPI
- 161.1212
- Rent YoY
- —
- Metro
- —
- State GDP YoY
- ▲ 2.94%
- F500 in state
- 4
Industry mix (Fortune 500 HQ in AL)
| Industry | F500 HQs | Revenue |
|---|---|---|
| Financial Services | 1 | $8B |
|
||
| Healthcare | 1 | $5B |
|
||
Price history
2 events — show timeline
- 2026-05-13 Pending — SAMLS
- 2026-05-08 Listed $115,400 SAMLS
Property tax history
+3.6%/yrLatest (2025): $360 · +6.6% YoY. Source: county tax records.
Cash-flow waterfall
monthlySold comps — $/sqft
last 12 mo · ≤1 miLoading sold comps…