109 S Vine St · Wilton, IA
Flood risk No data
- FEMA flood zone
- —
- Chance of flooding over 30 yrs
- —
- Est. flood insurance / yr
- —
Fire risk No data
- Est. fire insurance / yr
- —
Heat risk No data
- Hot days now (above threshold)
- —
- Hot days in 30 yrs
- —
Wind risk No data
- Chance of severe wind over 30 yrs
- —
Air-quality risk No data
- Unhealthy air days now
- —
- Unhealthy air days in 30 yrs
- —
Risk factors via First Street. Map © Google.
Why this score? — see what drove the B- grade
The composite is a weighted blend of 9 inputs, each scored 0–100. Each bar is that input's sub-score; the figure is the points it added to the 100-point composite (weight × sub-score).
- Cash flow +27.4/30.0
- DSCR +9.6/10.0
- ARV discount +7.5/15.0
- 1% rule +7.4/10.0
- Schools +6.3/10.0
- Livability +4.0/5.0
- Rent growth +2.5/5.0
- Condition / age +2.5/5.0
- Appreciation +0.0/10.0
$93,300
🖨 Deal sheet 📄 Offer letter ✓ Due diligence
Listing remarks
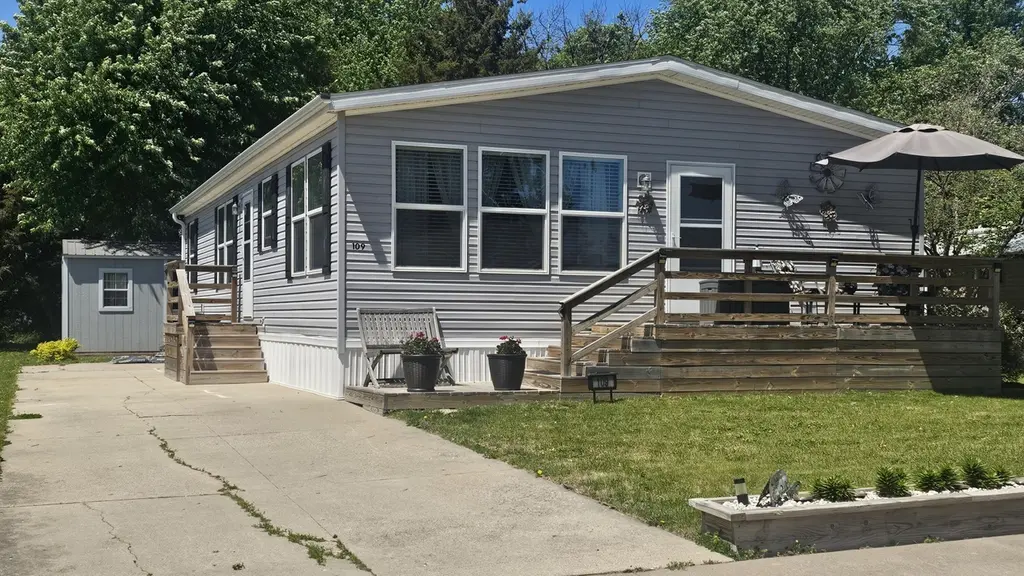
Consider this newer manufactured home with 3 bedrooms and 2 bathrooms. Situated on a dead end street on the skirts of Wilton. Enjoy the open concept living area. Dine at the table or at the island. Relax in the grand primary suite including a large walk-in closet. All bedrooms have walk-in closets! Soak in the outdoors from the deck. Premier shed. AHS Home Warranty with a strong offer. Home is on leased land. Contact Southtown MHP for lot rent and park guidelines. Seller to find home of choice.
Key facts
- Premier shed
- Grand primary suite
- Large walk-in closet
Tags
Property features AI
Exterior
- Utilities: Public water; Public sewer; Natural gas available
- Home design: One level; Mobile home; Residential property
- Construction: Vinyl siding
- Exterior features: Deck; Patio
Interior
- Kitchen: Dishwasher; Refrigerator
- Bedrooms: 3 bedrooms on the main level
- Bathrooms: 2 bathrooms on the main level
- Heating & cooling: Central air conditioning
- Interior features: Dishwasher; Refrigerator
- Laundry & utility: Washer and dryer on the main level
Neighborhood map
What this means for you Summary
Snapshot
- This is a 3-bed/2.0-bath other listed at $93k.
Deal economics
- At list price, monthly cash flow is $272 ($3k/yr) — positive.
- The deal already cash-flows at list — no discount required.
- Meets the 1% rule at list price ($1k rent vs $93k).
- Recommended offer: $91k (3.0% below list) — sets the bar for market timing.
Location & tenants
- Location reads 79/100 on livability (#101 in IA, #2,027 nationally) — a middle-class / working-renter tenant base. Strengths: crime A+, cost of living A+, housing A+; Watch: amenities F, commute F.
- Wilton Community School District (town): math 72% / reading 75% proficiency, ranked #80 of 289 in IA (top 28%) — strong family-tenant draw, lease renewals of 3-5y typical.
- Market conditions: 29 active listings in the ZIP; 65 units permitted in Muscatine County in 2024 (45 in 5+ unit buildings).
Forward outlook
- Local home prices are declining (-3.0%/yr); year-one equity from $645 of loan paydown is wiped out by about $3k of value loss. Plan a longer hold.
- Muscatine County population projected at +8% by 2050 — modest demand growth; plan on rents tracking national, not racing it.
- At projected returns (-3.0% appreciation + 3.0% rent growth), your $26k cash investment doubles in ~10 years — after that, you're playing with house money.
Negotiation context
- It's been on market 35 days — a 3% lower offer ($91k) is reasonable based on typical stale-listing flexibility.
Questions for the listing agent
- It's been on market 35 days. Have you received any prior offers? Is the seller open to a 3% concession, seller financing, or rate buy-down credit?
- Is there a deadline driving the sale (1031 exchange, divorce, estate, relocation)? That informs how much negotiation room exists.
- Schools are A-rated — typically a magnet for longer-tenancy family renters. What's the average tenant stay here, and is there a school-zone premium baked into asking?
- What's the average days-on-market for RENTAL listings here right now (not sales)? A rising rental-DOM trend means longer vacancies and softer asking-rent achievability than the comps imply.
- What's the recent tenant-quality profile in this submarket — average credit score on applications, eviction rate, late-payment / NSF rate, and stable-employment percentage? A property-management company in the area should have these aggregated.
- How much new for-sale + rental construction is in the pipeline within 1–3 miles? Heavy new supply typically softens prices + rents 12–24 months out; constrained supply supports both.
Investment metrics
- 1% rule
- 1.24% ✓
- Cap rate
- 9.79%
- Cash-on-cash
- 12.50%
- DSCR
- 1.56
- GRM
- 6.7
CMA / ARV
- ARV (median comp)
- $42,709
- List price
- $93,300
- Delta
- 118.46%
- Verdict
- OVERPRICED
- Comps
- 6 within 1.0 mi
Projected returns pro-forma
-3.0% appreciation · 3.0% rent growth · sell at horizon
- IRR
- 2.2%
- Equity multiple
- 1.09×
- Total profit
- $2,228
- Equity at exit
- $13,911
- IRR
- 11.8%
- Equity multiple
- 1.93×
- Total profit
- $24,325
- Equity at exit
- $8,067
Cash invested: $26,124 (down + closing). Projections, not guarantees.
Landlord ↔ Tenant lean methodology
- Overall (STATE)
- 83 Strongly Landlord-Friendly
- State Iowa
- 83 Strongly Landlord-Friendly · R+6
- County
- — inherits STATE
- City
- — inherits STATE
ZIP-level market 52778
- Home prices YoY
- -31.8%
- Active inventory
- 29
- Price-to-rent
- 6.7×
Monthly cashflow live
- Estimated rent
- $1,161 medium interval (Pro) →
- Mortgage (P&I)
- −$489
- Tax est. 1.5%
- −$117 /mo · $1,400/yr
- Insurance
- −$39
- HOA
- −$0
- Vacancy / Maint / Mgmt
- −$244
- Net cashflow
- $272
Break-even live
UW: 25.0% down · 7.5% · 30yr · 1.5% tax · 5.0% vac · 8.0% maint · 8.0% mgmt
Financing live
Cash to close
- Down payment
- $23,325
- Closing costs
- $2,799
- Reserves months
- —
- Total cash needed
- —
Loan-product check · same deal, 3 products live
Conventional
25% down · 7.5% · 30yr
- Down + closing
- —
- Monthly P&I
- —
- Monthly cashflow
- —
- DSCR
- —
- Eligible?
- —
Personal DTI + credit; lowest rate.
DSCR
20% down · 8.5% · 30yr
- Down + closing
- —
- Monthly P&I
- —
- Monthly cashflow
- —
- DSCR
- —
- Eligible?
- —
No personal income docs; deal must DSCR.
Hard money
10% down · 12.0% · 12mo
- Down + closing
- —
- Monthly P&I
- —
- Monthly cashflow
- —
- DSCR
- —
- Eligible?
- —
Short-term bridge; refi at stabilization.
Listing history 15 events
-
2026-06-18days on market $93,300 Active 35 DOM
-
2026-06-17days on market $93,300 Active 34 DOM
-
2026-06-16days on market $93,300 Active 33 DOM
-
2026-06-15days on market $93,300 Active 32 DOM
-
2026-06-13days on market $93,300 Active 30 DOM
-
2026-06-12days on market $93,300 Active 29 DOM
-
2026-06-09pricedays on market $93,300 Active 26 DOM
-
2026-06-08days on market $95,500 Active 25 DOM
-
2026-06-07days on market $95,500 Active 24 DOM
-
2026-06-04days on market $95,500 Active 20 DOM
-
2026-06-02days on market $95,500 Active 19 DOM
-
2026-06-01days on market $95,500 Active 18 DOM
-
2026-05-31days on market $95,500 Active 17 DOM
-
2026-05-31days on market $95,500 Active 16 DOM
-
2026-05-14$95,500 Active 499-char remark
ⓘ Source: listings_history table (triggers on properties + properties_extension) + one-shot
backfill from property_details.listing_events for pre-trigger history.
Nearby sold comps map
Loading sold comps map…
Walkable amenities ~0.75 mi
Loading nearby amenities…
Taxation est. · year 1
- Rental income
- $13,927
- − Mortgage interest
- −$5,226
- − Property taxes
- −$1,400
- − Insurance
- −$466
- − Repairs & maintenance
- −$1,114
- − Management
- −$1,114
- − Depreciation
- −$2,714
- Taxable income
- $1,892
- Est. tax owed @ 24.0%
- −$454
- After-tax cash flow
- $2,811/yr
For passive investors: Depreciation is non-cash, so a rental often shows a tax loss while cash-flowing — sheltering income. Rental losses are passive: they offset passive income freely, and up to $25,000/yr can offset ordinary (W-2) income if you actively participate and your MAGI is under $100k (phasing out to $0 by $150k); unused losses carry forward. On sale, claimed depreciation is recaptured at up to 25%, and gains may owe capital-gains tax (a 1031 exchange can defer both). Figures are a year-1 estimate at your 24.0% rate — not tax advice; consult a CPA.
Schools (NCES district)
- District
- Wilton Community School District
- NCES district ID
- 1931800
- Math proficiency
- 72% ▲ 1.00%
- Reading proficiency
- 75% ▲ 4.00%
- Median HH income
- $58,073
- Composite
- 63.04/100
- National rank
- #648
- State rank
- #80 of 289 in IA
Livability — Wilton
- Score
- 79/100
- State rank
- #101
- US rank
- #2027
Category grades
Schools grade is shown separately in the Schools card above.
Census & demographics
- Census place
- Wilton, IA
- Population (ZIP)
- 3,677
Population outlook (Muscatine County) Hauer SSP2
- Today (2025)
- 44,820 people
- By 2030
- 45,461 · +1.4%
- By 2040
- 46,765 · +4.3%
- By 2050
- 48,609 · +8.5%
- By 2075
- 56,014 · +25.0%
- By 2100
- 63,513 · +41.7%
Race, ethnicity, and origin ACS 2023
- Neighborhood character
- Predominantly White (91%)
- Race & ethnicity
- White 91% Hispanic / Latino 5% Two or more races 3% Black 1%
- Hispanic origin (detail)
- Mexican 5%
- Common ancestry
- Lithuanian 2% Italian 1% Iranian 1%
- Foreign-born
- 1% · China, Canada
- Languages at home
- 98% English-only · Spanish 1% Russian/Polish/Slavic 1% Arabic 1%
Political lean MEDSL · Muscatine
- 2024 margin
- R (+14.9) · D 41.7% · R 56.6% · Other 1.7%
- 2008→2024 swing
- -30.6pp toward R · 2008: 15.7pp · 2024: -14.9pp
- All cycles
- 2024: R+14.9 2020: R+7.0 2016: R+6.6 2012: D+15.5 2008: D+15.7
Not yet ingested
- Civics
- —
Market trends
- HPI YoY
- ▼ -93.07%
- Current HPI
- 199.9894
- Rent YoY
- —
- Metro
- —
- State GDP YoY
- ▲ 2.48%
- F500 in state
- 4
Industry mix (Fortune 500 HQ in IA)
| Industry | F500 HQs | Revenue |
|---|---|---|
| Financial Services | 1 | $16B |
|
||
| Retail / Convenience | 1 | $15B |
|
||
Price history
-2.3% since first listed2 events — show timeline
- 2026-06-09 Price Changed $93,300 Muscatine BOR
- 2026-05-14 Listed $95,500 Muscatine BOR
Property tax history
+3.2%/yrLatest (2021): $40 · +0.0% YoY. Source: county tax records.
Cash-flow waterfall
monthlySold comps — $/sqft
last 12 mo · ≤1 miLoading sold comps…