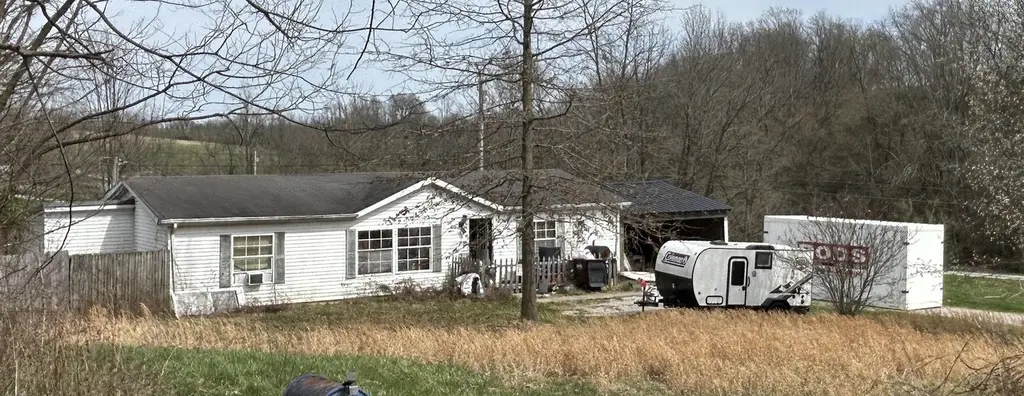
471 Goose Creek Rd · Mount Sterling, KY
Flood risk 1/10 · Minimal
- FEMA flood zone
- X (unshaded)
- Chance of flooding over 30 yrs
- 0.0%
- Est. flood insurance / yr
- $507 – $1,088
Fire risk 5/10 · Moderate
- Est. fire insurance / yr
- $839 – $1,559
Heat risk 4/10 · Minor
- Hot days now (above 101°F)
- 7 days/yr
- Hot days in 30 yrs
- 19 days/yr
Wind risk 2/10 · Minimal
- Chance of severe wind over 30 yrs
- 4.0%
Air-quality risk 1/10 · Minimal
- Unhealthy air days now
- 0 days/yr
- Unhealthy air days in 30 yrs
- 0 days/yr
Risk factors via First Street. Map © Google.
Why this score? — see what drove the B- grade
The composite is a weighted blend of 9 inputs, each scored 0–100. Each bar is that input's sub-score; the figure is the points it added to the 100-point composite (weight × sub-score).
- Cash flow +29.1/30.0
- DSCR +10.0/10.0
- ARV discount +7.5/15.0
- 1% rule +7.4/10.0
- Livability +3.2/5.0
- Schools +3.0/10.0
- Rent growth +2.5/5.0
- Condition / age +2.5/5.0
- Appreciation +0.0/10.0
$129,999
🖨 Deal sheet 📄 Offer letter ✓ Due diligence
Listing remarks MLS
This lovely property gives you the best of both worlds- convenience as well as privacy, thanks to it's awesome location and privacy fence! If you love hosting family dinners you will love the formal dining room this property has to offer. Enjoy country living while only being minutes from I64.
Key facts
- 1.49 acre lot
- Parking
- Built 2001
Property features AI
Exterior
- Parking: Driveway; Carport
- Utilities: Septic tank; Electricity connected
- Home design: Manufactured house; One story
- Construction: Vinyl siding; Composition roof; Block foundation; Built on a 1.49-acre lot
- Exterior features: Shed(s); Partial fencing; Public water
Interior
- Kitchen: Dishwasher; Refrigerator; Range
- Flooring: Carpet; Hardwood; Laminate
- Bathrooms: 2 full bathrooms
- Heating & cooling: Electric heating; Heat pump; Electric cooling; Heat pump cooling
- Interior features: Primary bedroom on the first floor; 7 total rooms; Crawl space foundation; No fireplace
- Laundry & utility: Washer hookup; Electric dryer hookup; Gas dryer hookup
Neighborhood map
What this means for you Summary
Snapshot
- This is a 3-bed/2.0-bath other listed at $130k.
Deal economics
- At list price, monthly cash flow is $447 ($5k/yr) — positive.
- The deal already cash-flows at list — no discount required.
- Meets the 1% rule at list price ($2k rent vs $130k).
- Recommended offer: $122k (6.0% below list) — sets the bar for market timing.
- Cap rate 10.4% vs local median 3.5% in Mount Sterling — top-decile yield for the area; either an underpriced asset or a hidden risk that comps aren't pricing in. Stress-test before assuming the spread holds.
Location & tenants
- Location reads 64/100 on livability (#297 in KY) — a middle-class / working-renter tenant base. Strengths: cost of living A+, housing A+, crime B+; Watch: amenities F, commute F, employment F.
- Clark County (town): math 28% / reading 41% proficiency, ranked #64 of 165 in KY (top 39%) — families likely to look elsewhere, expect single-tenant / working-renter base with shorter leases.
- Zoned schools: William G. Conkwright Elementary (math 12% / reading 22%, grade F, #607 of 676 statewide, top 91%, 505 students, 70% FRL); Robert D. Campbell Jr. High (math 28% / reading 47%, grade F, #73 of 217 statewide, top 36%, 820 students, 57% FRL).
- Market conditions: 291 active listings in the ZIP; 160 units permitted in Clark County in 2024 (61 in 5+ unit buildings).
- This rent runs 30% of the median local income ($64k/yr) — at the standard rent-burdened threshold; future hikes will face affordability resistance.
Forward outlook
- Local home prices are declining (-3.0%/yr); year-one equity from $899 of loan paydown is wiped out by about $4k of value loss. Plan a longer hold.
- Clark County population projected to shrink 7% by 2050 — rents likely to lag national; underwrite the cash flow, not the appreciation.
- At projected returns (-3.0% appreciation + 3.0% rent growth), your $36k cash investment doubles in ~8 years — after that, you're playing with house money.
Negotiation context
- It's been on market 84 days — a 6% lower offer ($122k) is reasonable based on typical stale-listing flexibility.
- 4 sale attempts since 23y ago; this cycle's ask has dropped $30k (19%) from the opening price — seller is motivated, your offer sets the floor, not the list.
- Current owner paid $110k; 18% above their basis — modest negotiation headroom, anchor on the comps not their cost.
Risks & watch-outs
- Climate carrying-cost: moderate wildfire risk — expect insurance premiums to compound above CPI over the hold.
Questions for the listing agent
- It's been on market 84 days. Have you received any prior offers? Is the seller open to a 6% concession, seller financing, or rate buy-down credit?
- Why hasn't it sold? Are there any deal-killer items the seller is aware of (foundation, flood, title, zoning, code violations)?
- Is there a deadline driving the sale (1031 exchange, divorce, estate, relocation)? That informs how much negotiation room exists.
- What's the average days-on-market for RENTAL listings here right now (not sales)? A rising rental-DOM trend means longer vacancies and softer asking-rent achievability than the comps imply.
- What's the recent tenant-quality profile in this submarket — average credit score on applications, eviction rate, late-payment / NSF rate, and stable-employment percentage? A property-management company in the area should have these aggregated.
- How much new for-sale + rental construction is in the pipeline within 1–3 miles? Heavy new supply typically softens prices + rents 12–24 months out; constrained supply supports both.
Investment metrics
- 1% rule
- 1.24% ✓
- Cap rate
- 10.42%
- Cash-on-cash
- 14.74%
- DSCR
- 1.66
- GRM
- 6.7
CMA / ARV
No comps found within radius.
Projected returns pro-forma
-3.0% appreciation · 3.0% rent growth · sell at horizon
- IRR
- 5.2%
- Equity multiple
- 1.20×
- Total profit
- $7,386
- Equity at exit
- $19,383
- IRR
- 14.7%
- Equity multiple
- 2.18×
- Total profit
- $43,008
- Equity at exit
- $11,240
Cash invested: $36,400 (down + closing). Projections, not guarantees.
Landlord ↔ Tenant lean methodology
- Overall (STATE)
- 83 Strongly Landlord-Friendly
- State Kentucky
- 83 Strongly Landlord-Friendly · R+16
- County
- — inherits STATE
- City
- — inherits STATE
ZIP-level market 40391
- Home prices YoY
- -17.0%
- Active inventory
- 291
- Price-to-rent
- 6.7×
Monthly cashflow live
- Estimated rent
- $1,609 medium interval (Pro) →
- Mortgage (P&I)
- −$682
- Tax from tax record
- −$88 /mo · $1,057/yr
- Insurance
- −$54
- HOA
- −$0
- Vacancy / Maint / Mgmt
- −$338
- Net cashflow
- $447
Break-even live
UW: 25.0% down · 7.5% · 30yr · 1.5% tax · 5.0% vac · 8.0% maint · 8.0% mgmt
Financing live
Cash to close
- Down payment
- $32,500
- Closing costs
- $3,900
- Reserves months
- —
- Total cash needed
- —
Loan-product check · same deal, 3 products live
Conventional
25% down · 7.5% · 30yr
- Down + closing
- —
- Monthly P&I
- —
- Monthly cashflow
- —
- DSCR
- —
- Eligible?
- —
Personal DTI + credit; lowest rate.
DSCR
20% down · 8.5% · 30yr
- Down + closing
- —
- Monthly P&I
- —
- Monthly cashflow
- —
- DSCR
- —
- Eligible?
- —
No personal income docs; deal must DSCR.
Hard money
10% down · 12.0% · 12mo
- Down + closing
- —
- Monthly P&I
- —
- Monthly cashflow
- —
- DSCR
- —
- Eligible?
- —
Short-term bridge; refi at stabilization.
Listing history 29 events
-
2026-06-18days on market $129,999 Active 84 DOM
-
2026-06-17days on market $129,999 Active 83 DOM
-
2026-06-16days on market $129,999 Active 82 DOM
-
2026-06-15days on market $129,999 Active 81 DOM
-
2026-06-14days on market $129,999 Active 79 DOM
-
2026-06-13days on market $129,999 Active 78 DOM
-
2026-06-10days on market $129,999 Active 76 DOM
-
2026-06-09days on market $129,999 Active 75 DOM
-
2026-06-08days on market $129,999 Active 74 DOM
-
2026-06-07days on market $129,999 Active 73 DOM
-
2026-06-05days on market $129,999 Active 70 DOM
-
2026-06-03days on market $129,999 Active 69 DOM
-
2026-06-02days on market $129,999 Active 68 DOM
-
2026-06-01days on market $129,999 Active 67 DOM
-
2026-05-31days on market $129,999 Active 66 DOM
-
2026-05-31days on market $129,999 Active 65 DOM
-
2026-05-23price $129,999
-
2026-05-05price $135,000
-
2026-03-26status Active
-
2026-03-25$160,000 Active
-
2026-03-25historical
-
2019-01-07soldstatus $110,000 Sold 294-char remark
Show marketing remark (294 chars)
This lovely property gives you the best of both worlds- convenience as well as privacy, thanks to it's awesome location and privacy fence! If you love hosting family dinners you will love the formal dining room this property has to offer. Enjoy country living while only being minutes from I64.
-
2019-01-07soldstatus $110,000
Show marketing remark (294 chars)
This lovely property gives you the best of both worlds- convenience as well as privacy, thanks to it's awesome location and privacy fence! If you love hosting family dinners you will love the formal dining room this property has to offer. Enjoy country living while only being minutes from I64.
-
2018-11-06status Pending 294-char remark
Show marketing remark (294 chars)
This lovely property gives you the best of both worlds- convenience as well as privacy, thanks to it's awesome location and privacy fence! If you love hosting family dinners you will love the formal dining room this property has to offer. Enjoy country living while only being minutes from I64.
-
2018-10-24price $125,000 294-char remark
Show marketing remark (294 chars)
This lovely property gives you the best of both worlds- convenience as well as privacy, thanks to it's awesome location and privacy fence! If you love hosting family dinners you will love the formal dining room this property has to offer. Enjoy country living while only being minutes from I64.
-
2018-09-21$129,900 Active 294-char remark
Show marketing remark (294 chars)
This lovely property gives you the best of both worlds- convenience as well as privacy, thanks to it's awesome location and privacy fence! If you love hosting family dinners you will love the formal dining room this property has to offer. Enjoy country living while only being minutes from I64.
-
2007-06-21soldstatus $72,000
-
2004-06-22historical
-
2003-03-21$89,000
ⓘ Source: listings_history table (triggers on properties + properties_extension) + one-shot
backfill from property_details.listing_events for pre-trigger history.
Tax reassessment forecast KY · Resets to sale price
- Current annual tax
- $1,057 · $88/mo
- Projected year-2 tax
- $1,118 · $93/mo
- Expected delta
- +$61/yr (+$5/mo · 5.8%)
ⓘ Screening estimate from a state-policy table — verify with the county assessor before closing.
Climate risk First Street
- Flood 1/10 Low FEMA zone X (unshaded) · 0% chance over 30 yrs
- Wildfire 5/10 Major
- Heat 4/10 Moderate 7 d/yr ≥101°F today · 19 d/yr by 30 yrs out
- Wind 2/10 Low 4% chance of damaging wind over 30 yrs
- Air quality 1/10 Low 0 unhealthy d/yr today · 0 by 30 yrs out
Nearby sold comps map
Loading sold comps map…
Walkable amenities ~0.75 mi
Loading nearby amenities…
Taxation est. · year 1
- Rental income
- $19,307
- − Mortgage interest
- −$7,282
- − Property taxes
- −$1,057
- − Insurance
- −$650
- − Repairs & maintenance
- −$1,545
- − Management
- −$1,545
- − Depreciation
- −$3,782
- Taxable income
- $3,447
- Est. tax owed @ 24.0%
- −$827
- After-tax cash flow
- $4,537/yr
For passive investors: Depreciation is non-cash, so a rental often shows a tax loss while cash-flowing — sheltering income. Rental losses are passive: they offset passive income freely, and up to $25,000/yr can offset ordinary (W-2) income if you actively participate and your MAGI is under $100k (phasing out to $0 by $150k); unused losses carry forward. On sale, claimed depreciation is recaptured at up to 25%, and gains may owe capital-gains tax (a 1031 exchange can defer both). Figures are a year-1 estimate at your 24.0% rate — not tax advice; consult a CPA.
Schools (NCES district)
- District
- Clark County
- NCES district ID
- 2101200
- Math proficiency
- 28% ▼ -25.00%
- Reading proficiency
- 41% ▼ -18.00%
- Median HH income
- $47,282
- Composite
- 29.63/100
- National rank
- #6469
- State rank
- #64 of 165 in KY
Livability — Mount Sterling
- Score
- 64/100
- State rank
- #297
- US rank
- #14214
Category grades
Schools grade is shown separately in the Schools card above.
Census & demographics
- County
- Clark County · 36,796 people
- City population
- 22,725
- Metro
- Lexington-Fayette, KY
- Population (ZIP)
- 36,796
- Household income
- $64,144
- Rent vs Own
- Severe rent burden
- 854.0
Population outlook (Clark County) Hauer SSP2
- Today (2025)
- 35,849 people
- By 2030
- 35,616 · -0.6%
- By 2040
- 34,727 · -3.1%
- By 2050
- 33,195 · -7.4%
- By 2075
- 29,439 · -17.9%
- By 2100
- 24,744 · -31.0%
Race, ethnicity, and origin ACS 2023
- Neighborhood character
- Predominantly White (88%)
- Race & ethnicity
- White 88% Black 4% Hispanic / Latino 4% Two or more races 3%
- Common ancestry
- Slovak 3% Italian 2% Serbian 2%
- Foreign-born
- 2% · Canada
- Languages at home
- 97% English-only · Spanish 2%
Political lean MEDSL · Clark
- 2024 margin
- Solid R (+35.3) · D 31.6% · R 66.9% · Other 1.6%
- 2008→2024 swing
- -10.3pp toward R · 2008: -25.1pp · 2024: -35.3pp
- All cycles
- 2024: R+35.3 2020: R+32.0 2016: R+37.1 2012: R+30.5 2008: R+25.1
Not yet ingested
- Civics
- —
Market trends
- HPI YoY
- ▼ -58.24%
- Current HPI
- 283.7839
- Rent YoY
- —
- Metro
- Lexington-Fayette, KY
- State GDP YoY
- ▲ 1.81%
- F500 in state
- 4
Industry mix (Fortune 500 HQ in KY)
| Industry | F500 HQs | Revenue |
|---|---|---|
| Healthcare | 1 | $118B |
|
||
| Food / Beverage | 1 | $7B |
|
||
Price history
+46.1% since first listed13 events — show timeline
- 2026-05-23 Price Changed $129,999 ImagineMLS
- 2026-05-05 Price Changed $135,000 ImagineMLS
- 2026-03-26 Relisted — ImagineMLS
- 2026-03-25 Listing Removed — ImagineMLS
- 2026-03-25 Listed $160,000 ImagineMLS
- 2019-01-07 Sold (Public Records) $110,000 Public Records
- 2019-01-07 Sold (MLS) $110,000 ImagineMLS
- 2018-11-06 Pending — ImagineMLS
- 2018-10-24 Price Changed $125,000 ImagineMLS
- 2018-09-21 Listed $129,900 ImagineMLS
- 2007-06-21 Sold (Public Records) $72,000 Public Records
- 2004-06-22 Listing Removed — ImagineMLS
- 2003-03-21 Listed $89,000 ImagineMLS
Property tax history
+4.0%/yrLatest (2025): $1,057 · -2.3% YoY. Source: county tax records.
Cash-flow waterfall
monthlySold comps — $/sqft
last 12 mo · ≤1 miLoading sold comps…