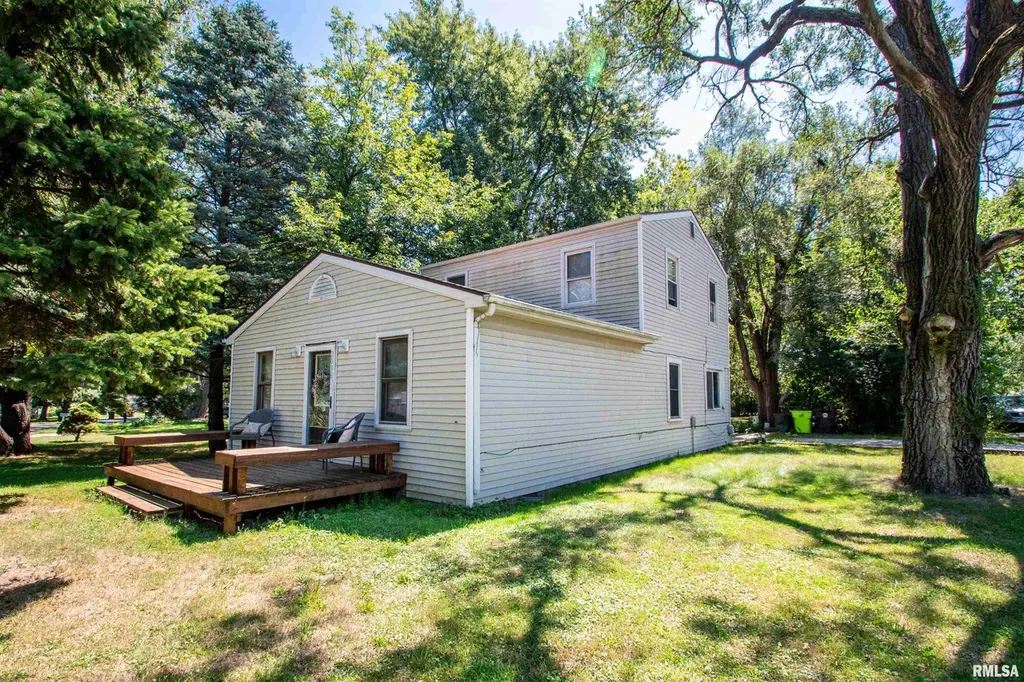
2036 W Richwoods Blvd · Peoria, IL
Flood risk 1/10 · Minimal
- FEMA flood zone
- X
- Chance of flooding over 30 yrs
- 0.0%
- Est. flood insurance / yr
- $507 – $1,088
Fire risk 1/10 · Minimal
- Est. fire insurance / yr
- $804 – $1,492
Heat risk 3/10 · Minor
- Hot days now (above 105°F)
- 7 days/yr
- Hot days in 30 yrs
- 18 days/yr
Wind risk 2/10 · Minimal
- Chance of severe wind over 30 yrs
- 1.0%
Air-quality risk 3/10 · Minor
- Unhealthy air days now
- 1 days/yr
- Unhealthy air days in 30 yrs
- 3 days/yr
Risk factors via First Street. Map © Google.
Why this score? — see what drove the C+ grade
The composite is a weighted blend of 9 inputs, each scored 0–100. Each bar is that input's sub-score; the figure is the points it added to the 100-point composite (weight × sub-score).
- Cash flow +26.5/30.0
- ARV discount +10.3/15.0
- DSCR +9.0/10.0
- 1% rule +7.6/10.0
- Livability +3.7/5.0
- Rent growth +3.1/5.0
- Condition / age +2.5/5.0
- Schools +1.1/10.0
- Appreciation +0.0/10.0
$98,000
🖨 Deal sheet (PDF) 📄 Offer letter ✓ Due diligence
Listing remarks MLS
GREAT 2 BEDROOM HOME WITH POSSIBLE 3RD BEDROOM. HOME HAS LARGE OPEN AREA WITH HIGH CEILINGS. CORNER LOT AND GREAT POTENTIAL. CLOSE TO INTERSTATE, PARKS, GROCERY STORES, AND RESTAURANTS. SOLD 'AS-IS'!
Key facts
- Close to parks
- High ceilings
- Large open area
Tags
Neighborhood map
What this means for you Summary
Snapshot
- This is a 2-bed/2.0-bath single-family listed at $98k.
Deal economics
- At list price, monthly cash flow is $260 ($3k/yr) — positive.
- The deal already cash-flows at list — no discount required.
- Meets the 1% rule at list price ($1k rent vs $98k).
- Recommended offer: $86k (12.0% below list) — sets the bar for market timing.
- Cap rate 9.5% vs local median 5.6% in Peoria — top-decile yield for the area; either an underpriced asset or a hidden risk that comps aren't pricing in. Stress-test before assuming the spread holds.
Location & tenants
- Location reads 73/100 on livability (#270 in IL) — a middle-class / working-renter tenant base. Strengths: commute A+, cost of living A+, housing A+; Watch: employment D+, schools F, crime F.
- Peoria SD 150 (urban): math 11% / reading 14% proficiency, ranked #554 of 620 in IL (top 89%) — low school quality limits family demand, transient renter base, plan for 1-2y turnover; 70% free/reduced lunch — lower-income household profile, screen leases tightly.
- Market conditions: Rents rising (+2.3%/yr); 180 active listings in the ZIP; 19 comparable units currently listed for rent nearby; rentals at typical pace (median 14d on market — plan ~3-4 weeks tenant-placement turnaround); 73 units permitted in Peoria County in 2024 (0 in 5+ unit buildings).
Forward outlook
- Local home prices are declining (-3.0%/yr); year-one equity from $678 of loan paydown is wiped out by about $3k of value loss. Plan a longer hold.
- Peoria County population projected at -11% by 2050 — secular population decline; favor cash flow + early exit over multi-decade hold.
Negotiation context
- It's been on market 311 days — a 12% lower offer ($86k) is reasonable based on typical stale-listing flexibility.
- 4 sale attempts since 3y ago with the ask held roughly flat each time — persistent listings suggest the price (not the market) is what's stuck; bring a comps-based counter.
- Current owner paid $85k; 15% above their basis — modest negotiation headroom, anchor on the comps not their cost.
Risks & watch-outs
- Watch-outs: built in 1939 — expect roof / HVAC / electrical / plumbing capex.
Questions for the listing agent
- It's been on market 311 days. Have you received any prior offers? Is the seller open to a 12% concession, seller financing, or rate buy-down credit?
- Built in 1939 — when were the roof, HVAC, electrical panel, plumbing, and water heater last replaced?
- Why hasn't it sold? Are there any deal-killer items the seller is aware of (foundation, flood, title, zoning, code violations)?
- Is there a deadline driving the sale (1031 exchange, divorce, estate, relocation)? That informs how much negotiation room exists.
- Schools are F-rated, which usually means shorter tenancies and higher turnover. Who's the typical renter profile here, and what's been the actual vacancy rate?
- Crime grade is F in this area — have there been break-ins, vandalism, or insurance claims at this property in the last 3 years? What carrier currently insures it and at what premium?
- What's the average days-on-market for RENTAL listings here right now (not sales)? A rising rental-DOM trend means longer vacancies and softer asking-rent achievability than the comps imply.
- What's the recent tenant-quality profile in this submarket — average credit score on applications, eviction rate, late-payment / NSF rate, and stable-employment percentage? A property-management company in the area should have these aggregated.
- How much new for-sale + rental construction is in the pipeline within 1–3 miles? Heavy new supply typically softens prices + rents 12–24 months out; constrained supply supports both.
Investment metrics
- 1% rule
- 1.26% ✓
- Cap rate
- 9.47%
- Cash-on-cash
- 11.35%
- DSCR
- 1.50
- GRM
- 6.6
CMA / ARV
- ARV (median comp)
- $104,575
- List price
- $98,000
- Delta
- -6.29%
- Verdict
- FAIR
- Comps
- 20 within 1.0 mi
Show comp detail 12 sales within ~0.75 mi
| Address | Dist | Beds/Ba | Sqft | Sold | Price | $/sf | Match |
|---|---|---|---|---|---|---|---|
| 2011 W Richwoods Blvd | 0.07mi | 3/2.5 (+1) | 1,420 (-5%) | 6mo | $130,000 | $92 | 77 |
| 1606 Circle Rd | 0.50mi | 3/2.0 (+1) | 1,503 (+1%) | 4mo | $137,000 | $91 | 67 |
| 2202 W Tripp Ave | 0.15mi | 2/1.0 | 1,296 (-13%) | 5mo | $31,000 | $24 | 64 |
| 3021 N Mission Rd | 0.35mi | 3/2.0 (+1) | 1,380 (-7%) | 5mo | $88,000 | $64 | 62 |
| 1413 W Gilbert Ave | 0.70mi | 2/2.0 | 1,428 (-4%) | 3mo | $58,000 | $41 | 59 |
| 1721 W Gilbert Ave | 0.57mi | 3/1.0 (+1) | 1,469 (-1%) | 6mo | $130,000 | $88 | 57 |
| 3913 N Sterling Ave | 0.56mi | 3/2.0 (+1) | 1,424 (-4%) | 9mo | $144,000 | $101 | 54 |
| 2416 W Overhill Rd | 0.50mi | 3/1.5 (+1) | 1,407 (-5%) | 9mo | $120,000 | $85 | 53 |
| 1403 W Margaret Ave | 0.66mi | 3/1.0 (+1) | 1,489 (+0%) | 9mo | $67,500 | $45 | 52 |
| 3421 N Rockwood Rd | 0.42mi | 3/1.0 (+1) | 1,332 (-10%) | 3mo | $145,900 | $110 | 51 |
| 2625 N Victoria Ave | 0.65mi | 2/1.0 | 1,620 (+9%) | 3mo | $103,000 | $64 | 48 |
| 2303 W Westport Rd | 0.59mi | 3/2.0 (+1) | 1,644 (+10%) | 4mo | $174,000 | $106 | 47 |
Match score weights: distance 35% · size 25% · config 20% · recency 20%. Top-matched comps best support the ARV.
Projected returns pro-forma
-3.0% appreciation · 2.3% rent growth · sell at horizon
- IRR
- -0.2%
- Equity multiple
- 0.99×
- Total profit
- $-174
- Equity at exit
- $14,612
- IRR
- 8.8%
- Equity multiple
- 1.65×
- Total profit
- $17,808
- Equity at exit
- $8,473
Cash invested: $27,440 (down + closing). Projections, not guarantees.
Landlord ↔ Tenant lean methodology
- Overall (STATE)
- 43 Moderately Tenant-Leaning
- State Illinois
- 43 Moderately Tenant-Leaning · D+7
- County
- — inherits STATE
- City
- — inherits STATE
ZIP-level market 61604
- Home prices YoY
- -24.6%
- Rents YoY
- 2.3%
- Active inventory
- 180
- Price-to-rent
- 6.6×
Monthly cashflow live
- Estimated rent
- $1,235 high interval (Pro) →
- Mortgage (P&I)
- −$514
- Tax from tax record
- −$162 /mo · $1,940/yr
- Insurance
- −$41
- HOA
- −$0
- Vacancy / Maint / Mgmt
- −$259
- Net cashflow
- $260
Break-even live
Sensitivity live
| Price | -10% $315 | -5% $287 | +0% $260 | +5% $232 | +10% $204 |
|---|---|---|---|---|---|
| Rent | -10% $162 | -5% $211 | +0% $260 | +5% $308 | +10% $357 |
| Rate | -1.0pp $309 | -0.5pp $284 | base $260 | +0.5pp $234 | +1.0pp $208 |
UW: 25.0% down · 7.5% · 30yr · 1.5% tax · 5.0% vac · 8.0% maint · 8.0% mgmt
Financing live
Cash to close
- Down payment
- $24,500
- Closing costs
- $2,940
- Reserves months
- —
- Total cash needed
- —
Loan-product check · same deal, 3 products live
Conventional
25% down · 7.5% · 30yr
- Down + closing
- —
- Monthly P&I
- —
- Monthly cashflow
- —
- DSCR
- —
- Eligible?
- —
Personal DTI + credit; lowest rate.
DSCR
20% down · 8.5% · 30yr
- Down + closing
- —
- Monthly P&I
- —
- Monthly cashflow
- —
- DSCR
- —
- Eligible?
- —
No personal income docs; deal must DSCR.
Hard money
10% down · 12.0% · 12mo
- Down + closing
- —
- Monthly P&I
- —
- Monthly cashflow
- —
- DSCR
- —
- Eligible?
- —
Short-term bridge; refi at stabilization.
Rent comps 19 comps
| Address | Beds | Baths | Sqft | Rent | $/sqft | DOM | Units | Dist |
|---|---|---|---|---|---|---|---|---|
| 3629 N Leroy Ave Unit A Peoria, IL | 2.0 | 1.0 | 1000 | $1,150 | $1.15 | 44d | 1 | 0.24mi |
| 4010 N Brandywine Dr Peoria, IL | 1.0–2.0 | 1.0–2.0 | 797 | $1,082 | $1.36 | 14d | 17 | 0.59mi |
| 1413 W Gilbert Ave Peoria, IL | 2.0 | 2.0 | 1428 | $1,500 | $1.05 | 14d | 1 | 0.69mi |
| 2610 N Renwood Ave Peoria, IL | 2.0 | 1.0 | 904 | $1,300 | $1.44 | 14d | 1 | 0.72mi |
| 3108 N Parish Ave Peoria, IL | 3.0 | 1.5 | 967 | $1,750 | $1.81 | 44d | 1 | 0.86mi |
| 3601 N Kingston Dr Peoria, IL | 2.0 | 2.0 | 1030 | $1,420 | $1.38 | 14d | 3 | 0.87mi |
| 1915 W Marlene Ave Unit B Peoria, IL | 2.0 | 1.5 | 1200 | $1,275 | $1.06 | 22d | 1 | 1.08mi |
| W Crestwood Dr Peoria, IL | 1.0–2.0 | 1.0 | 800 | $975 | $1.22 | 14d | 4 | 1.15mi |
| 913 W McClure Ave Peoria, IL | 3.0 | 1.0 | 1400 | $1,200 | $0.86 | 22d | 1 | 1.20mi |
| 2020 W Glen Ave Peoria, IL | 3.0 | 2.0 | 1320 | $1,700 | $1.29 | 14d | 1 | 1.23mi |
| 814 W McClure Ave Peoria, IL | 3.0 | 1.0 | 1148 | $1,100 | $0.96 | 44d | 1 | 1.28mi |
| 3444 W Dorchester Rdg Peoria, IL | 2.0 | 2.0 | 1089 | $1,275 | $1.17 | 14d | 1 | 1.28mi |
| 1308 W Covington Ct Peoria, IL | 2.0 | 1.5 | 975 | $1,170 | $1.20 | 22d | 1 | 1.29mi |
| 1327 W Covington Ct Peoria, IL | 2.0 | 2.0 | 1025 | $1,295 | $1.26 | 44d | 1 | 1.31mi |
| 2523 W Nebraska Ave Peoria, IL | 3.0 | 2.0 | 1600 | $1,450 | $0.91 | 22d | 1 | 1.32mi |
| 2023 N Underhill St Peoria, IL | 3.0 | 1.0 | 1050 | $1,200 | $1.14 | 14d | 1 | 1.33mi |
| 903 W Brons Ave Peoria, IL | 3.0 | 1.0 | 971 | $995 | $1.02 | 44d | 1 | 1.39mi |
| 2600 N Lavalle Ct Peoria, IL | 1.0–3.0 | 1.0–2.0 | 803 | $1,000 | $1.25 | 14d | 26 | 1.41mi |
| 1801 N Gentry Ln West Peoria, IL | 3.0 | 1.0 | 1000 | $1,650 | $1.65 | 14d | 1 | 1.48mi |
Listing history 28 events
-
2026-06-19days on market $98,000 Active 311 DOM
-
2026-06-18days on market $98,000 Active 310 DOM
-
2026-06-17days on market $98,000 Active 309 DOM
-
2026-06-16days on market $98,000 Active 308 DOM
-
2026-06-15days on market $98,000 Active 307 DOM
-
2026-06-14days on market $98,000 Active 305 DOM
-
2026-06-13days on market $98,000 Active 304 DOM
-
2026-06-10days on market $98,000 Active 302 DOM
-
2026-06-09days on market $98,000 Active 301 DOM
-
2026-06-08days on market $98,000 Active 300 DOM
-
2026-06-07days on market $98,000 Active 299 DOM
-
2026-06-03days on market $98,000 Active 295 DOM
-
2026-06-02pricedays on market $98,000 Active 294 DOM
-
2026-06-01days on market $99,900 Active 293 DOM
-
2026-05-31days on market $99,900 Active 292 DOM
-
2026-05-30days on market $99,900 Active 291 DOM
-
2025-11-22status Active 199-char remark
Show marketing remark (199 chars)
GREAT 2 BEDROOM HOME WITH POSSIBLE 3RD BEDROOM. HOME HAS LARGE OPEN AREA WITH HIGH CEILINGS. CORNER LOT AND GREAT POTENTIAL. CLOSE TO INTERSTATE, PARKS, GROCERY STORES, AND RESTAURANTS. SOLD 'AS-IS'!
-
2025-11-22price $99,900 199-char remark
Show marketing remark (199 chars)
GREAT 2 BEDROOM HOME WITH POSSIBLE 3RD BEDROOM. HOME HAS LARGE OPEN AREA WITH HIGH CEILINGS. CORNER LOT AND GREAT POTENTIAL. CLOSE TO INTERSTATE, PARKS, GROCERY STORES, AND RESTAURANTS. SOLD 'AS-IS'!
-
2025-11-09historical Under Contract 199-char remark
Show marketing remark (199 chars)
GREAT 2 BEDROOM HOME WITH POSSIBLE 3RD BEDROOM. HOME HAS LARGE OPEN AREA WITH HIGH CEILINGS. CORNER LOT AND GREAT POTENTIAL. CLOSE TO INTERSTATE, PARKS, GROCERY STORES, AND RESTAURANTS. SOLD 'AS-IS'!
-
2025-08-12$102,900 Active 199-char remark
Show marketing remark (199 chars)
GREAT 2 BEDROOM HOME WITH POSSIBLE 3RD BEDROOM. HOME HAS LARGE OPEN AREA WITH HIGH CEILINGS. CORNER LOT AND GREAT POTENTIAL. CLOSE TO INTERSTATE, PARKS, GROCERY STORES, AND RESTAURANTS. SOLD 'AS-IS'!
-
2023-09-25soldstatus $85,000 Closed 176-char remark
Show marketing remark (176 chars)
Great investment opportunity, 2 bedroom, 2 full bathroom home. Possible 3 bedroom has bunk bed. Nice size corner lot. Same renters since 2011. Schedule a private showing today.
-
2023-09-25soldstatus $85,000
Show marketing remark (176 chars)
Great investment opportunity, 2 bedroom, 2 full bathroom home. Possible 3 bedroom has bunk bed. Nice size corner lot. Same renters since 2011. Schedule a private showing today.
-
2023-09-05historical Under Contract 176-char remark
Show marketing remark (176 chars)
Great investment opportunity, 2 bedroom, 2 full bathroom home. Possible 3 bedroom has bunk bed. Nice size corner lot. Same renters since 2011. Schedule a private showing today.
-
2023-08-28status Active 176-char remark
Show marketing remark (176 chars)
Great investment opportunity, 2 bedroom, 2 full bathroom home. Possible 3 bedroom has bunk bed. Nice size corner lot. Same renters since 2011. Schedule a private showing today.
-
2023-04-17$89,000 Active 176-char remark
Show marketing remark (176 chars)
Great investment opportunity, 2 bedroom, 2 full bathroom home. Possible 3 bedroom has bunk bed. Nice size corner lot. Same renters since 2011. Schedule a private showing today.
-
2021-08-06historical
-
2021-08-06historical
-
2021-08-06historical
ⓘ Source: listings_history table (triggers on properties + properties_extension) + one-shot
backfill from property_details.listing_events for pre-trigger history.
Tax reassessment forecast IL · Partial reset (capped growth)
- Current annual tax
- $1,940 · $162/mo
- Projected year-2 tax
- $2,082 · $174/mo
- Expected delta
- +$142/yr (+$12/mo · 7.3%)
ⓘ Screening estimate from a state-policy table — verify with the county assessor before closing.
Climate risk First Street
- Flood 1/10 Low FEMA zone X · 0% chance over 30 yrs
- Wildfire 1/10 Low
- Heat 3/10 Moderate 7 d/yr ≥105°F today · 18 d/yr by 30 yrs out
- Wind 2/10 Low 100% chance of damaging wind over 30 yrs
- Air quality 3/10 Moderate 1 unhealthy d/yr today · 3 by 30 yrs out
Nearby sold comps map
Loading sold comps map…
Walkable amenities ~0.75 mi
Loading nearby amenities…
Taxation est. · year 1
- Rental income
- $14,824
- − Mortgage interest
- −$5,490
- − Property taxes
- −$1,940
- − Insurance
- −$490
- − Repairs & maintenance
- −$1,186
- − Management
- −$1,186
- − Depreciation
- −$2,851
- Taxable income
- $1,682
- Est. tax owed @ 24.0%
- −$404
- After-tax cash flow
- $2,710/yr
For passive investors: Depreciation is non-cash, so a rental often shows a tax loss while cash-flowing — sheltering income. Rental losses are passive: they offset passive income freely, and up to $25,000/yr can offset ordinary (W-2) income if you actively participate and your MAGI is under $100k (phasing out to $0 by $150k); unused losses carry forward. On sale, claimed depreciation is recaptured at up to 25%, and gains may owe capital-gains tax (a 1031 exchange can defer both). Figures are a year-1 estimate at your 24.0% rate — not tax advice; consult a CPA.
Schools (NCES district)
- District
- Peoria SD 150
- NCES district ID
- 1731230
- Math proficiency
- 11% ▼ -5.00%
- Reading proficiency
- 14% ▼ -4.00%
- Median HH income
- $41,951
- Composite
- 10.92/100
- National rank
- #9751
- State rank
- #554 of 620 in IL
Livability — Peoria
- Score
- 73/100
- State rank
- #270
- US rank
- #5096
Category grades
Schools grade is shown separately in the Schools card above.
Census & demographics
- Census place
- Peoria, IL
- County
- Peoria County · 120,495 people
- City population
- 114,670
- Metro
- Peoria, IL
- Population (ZIP)
- 28,313
- Household income
- $52,414
- Rent vs Own
- Severe rent burden
- 815.0
Population outlook (Peoria County) Hauer SSP2
- Today (2025)
- 183,007 people
- By 2030
- 179,643 · -1.8%
- By 2040
- 171,782 · -6.1%
- By 2050
- 163,508 · -10.7%
- By 2075
- 140,178 · -23.4%
- By 2100
- 114,493 · -37.4%
Race, ethnicity, and origin ACS 2023
- Neighborhood character
- Diverse neighborhood (Simpson 0.61)
- Race & ethnicity
- White 55% Black 29% Two or more races 10% Hispanic / Latino 7% Asian 2%
- Hispanic origin (detail)
- Mexican 5%
- Common ancestry
- Italian 2% Slovak 1% Iranian 1%
- Foreign-born
- 6% · Canada, China
- Languages at home
- 92% English-only · Spanish 4% Chinese 1% French/Haitian/Cajun 1%
Political lean MEDSL · Peoria
- 2024 margin
- Toss-up / Even · D 51.5% · R 46.9% · Other 1.6%
- 2008→2024 swing
- -9.2pp toward R · 2008: 13.9pp · 2024: 4.7pp
- All cycles
- 2024: D+4.7 2020: D+6.3 2016: D+2.8 2012: D+4.4 2008: D+13.9
Not yet ingested
- Civics
- —
Market trends
- HPI YoY
- ▼ -54.15%
- Current HPI
- 165.8838
- Rent YoY
- ▲ 2.30%
- Metro
- Peoria, IL
- State GDP YoY
- ▲ 1.59%
- F500 in state
- 60
Industry mix (Fortune 500 HQ in IL)
| Industry | F500 HQs | Revenue |
|---|---|---|
| Insurance | 4 | $201B |
|
||
| Consumer Goods | 4 | $87B |
|
||
| Industrial Machinery | 3 | $64B |
|
||
| Healthcare | 2 | $55B |
|
||
| Retail / Pharmacy | 1 | $148B |
|
||
| Agriculture / Food | 1 | $86B |
|
||
Price history
+12.2% since first listed12 events — show timeline
- 2025-11-22 Relisted — RMLSA as Distributed by MLS Grid
- 2025-11-22 Price Changed $99,900 RMLSA as Distributed by MLS Grid
- 2025-11-09 Contingent — RMLSA as Distributed by MLS Grid
- 2025-08-12 Listed $102,900 RMLSA as Distributed by MLS Grid
- 2023-09-25 Sold (Public Records) $85,000 Public Records
- 2023-09-25 Sold (MLS) $85,000 RMLSA as Distributed by MLS Grid
- 2023-09-05 Contingent — RMLSA as Distributed by MLS Grid
- 2023-08-28 Relisted — RMLSA as Distributed by MLS Grid
- 2023-04-17 Listed $89,000 RMLSA as Distributed by MLS Grid
- 2021-08-06 Listing Removed — RMLSA as Distributed by MLS Grid
- 2021-08-06 Listing Removed — RMLSA as Distributed by MLS Grid
- 2021-08-06 Listing Removed — RMLSA as Distributed by MLS Grid
Property tax history
-1.2%/yrLatest (2024): $1,940 · -18.1% YoY. Source: county tax records.
Cash-flow waterfall
monthlySold comps — $/sqft
last 12 mo · ≤1 miLoading sold comps…