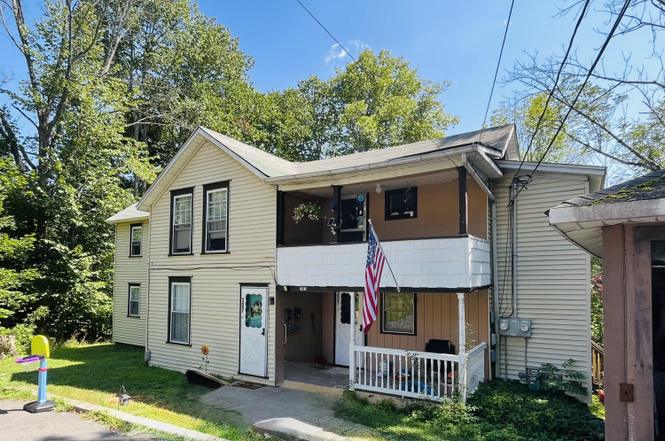
 Duplex
307 Grove St · Honesdale, PA
Flood risk 1/10 · Minimal
- FEMA flood zone
- X (unshaded)
- Chance of flooding over 30 yrs
- 0.0%
- Est. flood insurance / yr
- $473 – $860
Fire risk 1/10 · Minimal
- Est. fire insurance / yr
- $511 – $949
Heat risk 3/10 · Minor
- Hot days now (above 92°F)
- 7 days/yr
- Hot days in 30 yrs
- 17 days/yr
Wind risk 2/10 · Minimal
- Chance of severe wind over 30 yrs
- 2.0%
Air-quality risk 2/10 · Minimal
- Unhealthy air days now
- 1 days/yr
- Unhealthy air days in 30 yrs
- 2 days/yr
Risk factors via First Street. Map © Google.
Why this score? — see what drove the B- grade
The composite is a weighted blend of 9 inputs, each scored 0–100. Each bar is that input's sub-score; the figure is the points it added to the 100-point composite (weight × sub-score).
- Cash flow +24.8/30.0
- Appreciation +10.0/10.0
- DSCR +8.0/10.0
- ARV discount +7.5/15.0
- 1% rule +5.9/10.0
- Schools +4.7/10.0
- Livability +3.2/5.0
- Rent growth +2.5/5.0
- Condition / age +2.5/5.0
$329,000
🖨 Deal sheet 📄 Offer letter ✓ Due diligence
Multi-family units
County records classify this as Multi-Family (2-4 Unit). Listing-text estimate: 2 units. confirmed
Listing remarks
Charming Up & Down Duplex in HonesdaleThis versatile duplex offers two spacious units, one 2 bedroom and the other with 3 bedrooms. Each featuring enclosed back porches perfect for extra storage or year-round use. The upstairs unit boasts a brand-new kitchen with granite countertops and newer appliances, along with a front-facing balcony to enjoy the neighborhood views. The lower unit includes a delightful front porch and plenty of living space for comfort and convenience. Set back on a recessed lot, the property features a large backyard, ample parking, and a detached garage. While the garage needs some work, it offers great potential for additional income as storage rentals or enclo
Key facts
- Front-facing balcony
- Large backyard
- Brand-new kitchen
Tags
Property features AI
Finance
- Other: Zoned Residential
- Financial info: Residential income property (multi-family)
Exterior
- Parking: Detached 2-car garage; Driveway; Parking lot
- Utilities: Public water; Public sewer
- Home design: Duplex; Two levels; Residential income / Multi-family property
- Construction: Basement present (unfinished, walk-out access)
- Exterior features: Enclosed rear porch; Screened porch; Front porch; Balcony
Interior
- Kitchen: Microwave, Oven, Refrigerator
- Flooring: Carpet; Vinyl
- Bathrooms: Two full bathrooms
- Heating & cooling: Baseboard heating; Natural gas heating; Hot water heating
- Interior features: Microwave, Oven, Refrigerator; Unfinished walk-out basement; Balcony
- Laundry & utility: No laundry hookups listed
Neighborhood map
What this means for you Summary
Snapshot
- This is a 1×2bd/1.0ba + 1×3bd/1.0ba units multifamily listed at $329k.
Deal economics
- At list price, monthly cash flow is $692 ($8k/yr) — positive. Per door: $346/mo.
- The deal already cash-flows at list — no discount required.
- Meets the 1% rule at list price ($4k rent vs $329k).
- Recommended offer: $290k (12.0% below list) — sets the bar for market timing.
Location & tenants
- Location reads 64/100 on livability (#1,220 in PA) — a middle-class / working-renter tenant base. Strengths: cost of living A+, housing A, crime A-; Watch: amenities F, commute F, employment F.
- Wayne Highlands SD (town): math 48% / reading 64% proficiency, ranked #115 of 539 in PA (top 21%) — acceptable for families but not a draw, mixed tenant base, ~2y average lease.
- Market conditions: 66 active listings in the ZIP; 177 units permitted in Wayne County in 2024 (0 in 5+ unit buildings).
Forward outlook
- In year one you build about $35k of equity ($2k loan paydown + $33k appreciation (10.0% local appreciation)).
- Wayne County population projected at -17% by 2050 — secular population decline; favor cash flow + early exit over multi-decade hold.
- At projected returns (10.0% appreciation + 3.0% rent growth), your $92k cash investment doubles in ~3 years — after that, you're playing with house money.
- By year 2, paydown + projected appreciation supports a ~$57k cash-out refi (75% LTV) — recoverable capital for the next deal without selling this one.
Negotiation context
- It's been on market 189 days — a 12% lower offer ($290k) is reasonable based on typical stale-listing flexibility.
- 2 sale attempts; this cycle's ask has dropped $20k (6%) from the opening price — seller is motivated, your offer sets the floor, not the list.
- Current owner paid $135k; list at $329k implies a 144% gain — meaningful room to come down on a strong offer.
Risks & watch-outs
- Watch-outs: built in 1900 — expect roof / HVAC / electrical / plumbing capex.
Questions for the listing agent
- It's been on market 189 days. Have you received any prior offers? Is the seller open to a 12% concession, seller financing, or rate buy-down credit?
- Can we see the unit-by-unit rent roll, current vacancy, and any below-market leases? What's the average tenancy length?
- What capital expenditures (roof, boiler, parking lot, exteriors) have been made in the last 5 years, and what's planned in the next 2?
- Built in 1900 — when were the roof, HVAC, electrical panel, plumbing, and water heater last replaced?
- Why hasn't it sold? Are there any deal-killer items the seller is aware of (foundation, flood, title, zoning, code violations)?
- Is there a deadline driving the sale (1031 exchange, divorce, estate, relocation)? That informs how much negotiation room exists.
- Schools are B-rated — typically a magnet for longer-tenancy family renters. What's the average tenant stay here, and is there a school-zone premium baked into asking?
- What's the average days-on-market for RENTAL listings here right now (not sales)? A rising rental-DOM trend means longer vacancies and softer asking-rent achievability than the comps imply.
- What's the recent tenant-quality profile in this submarket — average credit score on applications, eviction rate, late-payment / NSF rate, and stable-employment percentage? A property-management company in the area should have these aggregated.
- How much new apartment / multifamily construction is in the pipeline within 1–3 miles? Heavy new supply (>2% of stock underway) typically softens rents 12–24 months out; light construction supports rent growth.
Investment metrics
- 1% rule
- 1.09% ✓
- Cap rate
- 8.82%
- Cash-on-cash
- 9.02%
- DSCR
- 1.40
- GRM
- 7.6
CMA / ARV
- ARV (on-the-fly)
- $208,552
- Comps found
- 4
Show comp detail 4 sales within ~0.75 mi
| Address | Dist | Beds/Ba | Sqft | Sold | Price | $/sf | Match |
|---|---|---|---|---|---|---|---|
| 247 B Terrace St | 0.13mi | 4/2.0 (-1) | 1,584 (-0%) | 12mo | $205,000 | $129 | 78 |
| 201 Green St | 0.16mi | 6/2.0 (+1) | 1,752 (+10%) | 13mo | $324,900 | $185 | 60 |
| 259 Terrace St | 0.09mi | 4/2.0 (-1) | 1,784 (+12%) | 13mo | $215,935 | $121 | 60 |
| 147 Tryon St | 0.63mi | 4/2.0 (-1) | 1,778 (+12%) | 12mo | $232,500 | $131 | 36 |
Match score weights: distance 35% · size 25% · config 20% · recency 20%. Top-matched comps best support the ARV.
Projected returns pro-forma
10.0% appreciation · 3.0% rent growth · sell at horizon
- IRR
- 30.9%
- Equity multiple
- 3.42×
- Total profit
- $223,239
- Equity at exit
- $296,389
- IRR
- 26.7%
- Equity multiple
- 7.76×
- Total profit
- $622,699
- Equity at exit
- $639,175
Cash invested: $92,120 (down + closing). Projections, not guarantees.
Landlord ↔ Tenant lean methodology
- Overall (STATE)
- 62 Landlord-Friendly
- State Pennsylvania
- 62 Landlord-Friendly · EVEN
- County
- — inherits STATE
- City
- — inherits STATE
ZIP-level market 18431
- Home prices YoY
- 10.6%
- Active inventory
- 66
- Price-to-rent
- 15.2×
Monthly cashflow live
- Estimated rent
- $3,600 medium interval (Pro) →
- Mortgage (P&I)
- −$1,725
- Tax from tax record
- −$290 /mo · $3,475/yr
- Insurance
- −$137
- HOA
- −$0
- Vacancy / Maint / Mgmt
- −$756
- Net cashflow
- $692
Break-even live
2-unit breakdown (identical units grouped — click to expand)
| Units | Beds | Baths | Est. rent |
|---|---|---|---|
| 1× unit | 2 | 1 | $1,800 |
| 1× unit | 3 | 1 | $1,800 |
| Total (2 units) | $3,600 | ||
UW: 25.0% down · 7.5% · 30yr · 1.5% tax · 5.0% vac · 8.0% maint · 8.0% mgmt
Financing live
Cash to close
- Down payment
- $82,250
- Closing costs
- $9,870
- Reserves months
- —
- Total cash needed
- —
Loan-product check · same deal, 3 products live
Conventional
25% down · 7.5% · 30yr
- Down + closing
- —
- Monthly P&I
- —
- Monthly cashflow
- —
- DSCR
- —
- Eligible?
- —
Personal DTI + credit; lowest rate.
DSCR
20% down · 8.5% · 30yr
- Down + closing
- —
- Monthly P&I
- —
- Monthly cashflow
- —
- DSCR
- —
- Eligible?
- —
No personal income docs; deal must DSCR.
Hard money
10% down · 12.0% · 12mo
- Down + closing
- —
- Monthly P&I
- —
- Monthly cashflow
- —
- DSCR
- —
- Eligible?
- —
Short-term bridge; refi at stabilization.
Listing history 8 events
-
2026-06-18days on market $329,000 Active 189 DOM
-
2026-06-17days on market $329,000 Active 188 DOM
-
2026-06-16days on market $329,000 Active 187 DOM
-
2026-06-15days on market $329,000 Active 186 DOM
-
2026-06-13days on market $329,000 Active 184 DOM
-
2026-06-12days on market $329,000 Active 183 DOM
-
2026-06-09remarks 695-char remark
-
2026-06-09$329,000 Active 180 DOM
ⓘ Source: listings_history table (triggers on properties + properties_extension) + one-shot
backfill from property_details.listing_events for pre-trigger history.
Tax reassessment forecast PA · Partial reset (capped growth)
- Current annual tax
- $3,475 · $290/mo
- Projected year-2 tax
- $4,336 · $361/mo
- Expected delta
- +$862/yr (+$72/mo · 24.8%)
ⓘ Screening estimate from a state-policy table — verify with the county assessor before closing.
Climate risk First Street
- Flood 1/10 Low FEMA zone X (unshaded) · 0% chance over 30 yrs
- Wildfire 1/10 Low
- Heat 3/10 Moderate 7 d/yr ≥92°F today · 17 d/yr by 30 yrs out
- Wind 2/10 Low 2% chance of damaging wind over 30 yrs
- Air quality 2/10 Low 1 unhealthy d/yr today · 2 by 30 yrs out
Nearby sold comps map
Loading sold comps map…
Walkable amenities ~0.75 mi
Loading nearby amenities…
Taxation est. · year 1
- Rental income
- $43,200
- − Mortgage interest
- −$18,429
- − Property taxes
- −$3,475
- − Insurance
- −$1,645
- − Repairs & maintenance
- −$3,456
- − Management
- −$3,456
- − Depreciation
- −$9,571
- Taxable income
- $3,168
- Est. tax owed @ 24.0%
- −$760
- After-tax cash flow
- $7,544/yr
For passive investors: Depreciation is non-cash, so a rental often shows a tax loss while cash-flowing — sheltering income. Rental losses are passive: they offset passive income freely, and up to $25,000/yr can offset ordinary (W-2) income if you actively participate and your MAGI is under $100k (phasing out to $0 by $150k); unused losses carry forward. On sale, claimed depreciation is recaptured at up to 25%, and gains may owe capital-gains tax (a 1031 exchange can defer both). Figures are a year-1 estimate at your 24.0% rate — not tax advice; consult a CPA.
Schools (NCES district)
- District
- Wayne Highlands SD
- NCES district ID
- 4224970
- Math proficiency
- 48% ▼ -12.00%
- Reading proficiency
- 64% ▼ -10.00%
- Median HH income
- $46,476
- Composite
- 47.36/100
- National rank
- #2292
- State rank
- #115 of 539 in PA
Livability — Honesdale
- Score
- 64/100
- State rank
- #1220
- US rank
- #14488
Category grades
Schools grade is shown separately in the Schools card above.
Census & demographics
- Census place
- Honesdale, PA
- Population (ZIP)
- 12,576
Population outlook (Wayne County) Hauer SSP2
- Today (2025)
- 47,924 people
- By 2030
- 46,191 · -3.6%
- By 2040
- 42,815 · -10.7%
- By 2050
- 39,873 · -16.8%
- By 2075
- 34,556 · -27.9%
- By 2100
- 28,358 · -40.8%
Race, ethnicity, and origin ACS 2023
- Neighborhood character
- Predominantly White (94%)
- Race & ethnicity
- White 94% Two or more races 4% Hispanic / Latino 3%
- Common ancestry
- Romanian 7% Lithuanian 2% Subsaharan African 2%
- Foreign-born
- 3%
- Languages at home
- 97% English-only · Spanish 1%
Political lean MEDSL · Wayne
- 2024 margin
- Solid R (+37.1) · D 31.1% · R 68.2%
- 2008→2024 swing
- -24.8pp toward R · 2008: -12.3pp · 2024: -37.1pp
- All cycles
- 2024: R+37.1 2020: R+33.6 2016: R+39.7 2012: R+20.9 2008: R+12.3
Not yet ingested
- Civics
- —
Market trends
- HPI YoY
- ▲ 30.12%
- Current HPI
- 313.5221
- Rent YoY
- —
- Metro
- —
- State GDP YoY
- ▲ 1.68%
- F500 in state
- 34
Industry mix (Fortune 500 HQ in PA)
| Industry | F500 HQs | Revenue |
|---|---|---|
| Healthcare | 2 | $309B |
|
||
| Insurance | 2 | $27B |
|
||
| Telecommunications / Media | 1 | $124B |
|
||
| Industrial Distribution | 1 | $22B |
|
||
| Financial Services | 1 | $20B |
|
||
| Chemicals / Materials | 1 | $18B |
|
||
Price history
+143.7% since first listed4 events — show timeline
- 2026-06-09 Relisted — PWMLS
- 2026-06-09 Price Changed $329,000 PWMLS
- 2025-09-03 Listed $349,000 PWMLS
- 2022-09-02 Sold (Public Records) $135,000 Public Records
Property tax history
+4.3%/yrLatest (2026): $3,475 · +1.9% YoY. Source: county tax records.
Cash-flow waterfall
monthlySold comps — $/sqft
last 12 mo · ≤1 miLoading sold comps…