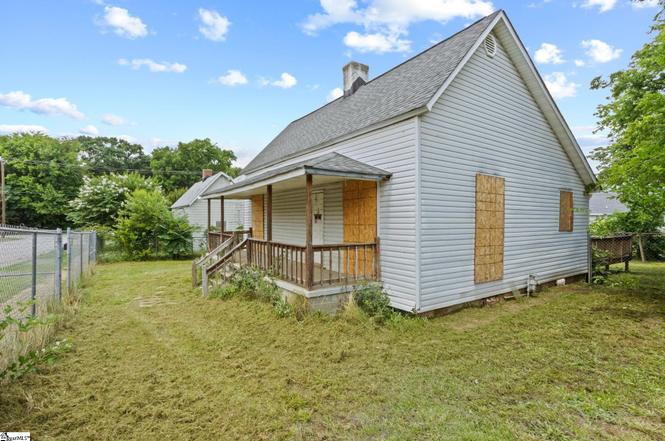
5 5th Ave · Greenville, SC
Flood risk 6/10 · Moderate
- FEMA flood zone
- X (unshaded)
- Chance of flooding over 30 yrs
- 0.73%
- Est. flood insurance / yr
- $507 – $1,088
Fire risk 1/10 · Minimal
- Est. fire insurance / yr
- $783 – $1,453
Heat risk 6/10 · Moderate
- Hot days now (above 102°F)
- 7 days/yr
- Hot days in 30 yrs
- 17 days/yr
Wind risk 2/10 · Minimal
- Chance of severe wind over 30 yrs
- 0.0%
Air-quality risk 4/10 · Minor
- Unhealthy air days now
- 3 days/yr
- Unhealthy air days in 30 yrs
- 4 days/yr
Risk factors via First Street. Map © Google.
Why this score? — see what drove the B+ grade
The composite is a weighted blend of 9 inputs, each scored 0–100. Each bar is that input's sub-score; the figure is the points it added to the 100-point composite (weight × sub-score).
- Cash flow +29.9/30.0
- ARV discount +15.0/15.0
- DSCR +10.0/10.0
- 1% rule +7.9/10.0
- Schools +4.2/10.0
- Livability +4.0/5.0
- Rent growth +2.5/5.0
- Condition / age +2.5/5.0
- Appreciation +0.0/10.0
$115,000
🖨 Deal sheet 📄 Offer letter ✓ Due diligence
Listing remarks
HIGHEST AND BEST OFFER REVIEW 6/16 at 5pm Multiple Offers. Attention investors, renovators, and savvy buyers! Opportunity awaits in the growing Greenville market with this 2BR/1BA home situated on a level lot just minutes from downtown Greenville. Whether you're looking for your next fix-and-flip, a buy-and-hold rental, or a property to renovate and make your own, this home offers excellent potential and a chance to build equity. The existing footprint provides a solid starting point for updates and improvements, while the location adds long-term value. Enjoy convenient access to downtown Greenville, the Swamp Rabbit Trail, parks, shopping, dining, entertainment, and major highways. With co
Key facts
- Swamp rabbit trail
- Level lot
- Shopping
Tags
Property features AI
Finance
- HOA & community: No HOA fees; No community amenities listed
Exterior
- Parking: Driveway (see remarks for details); Garage details referenced in parking features
- Utilities: Public water; Gas water heater; Public sewer; Public garbage pickup; Electric service (implied); Cooling: central forced air
- Home design: Single-story home; Built around 1963; Crawl space foundation; Vinyl siding; Architectural roof
- Construction: Vinyl siding exterior; Architectural shingle roof; Crawl space foundation; Built circa 1963
- Exterior features: Front porch; Deck; Level lot; Lot one-half acre or smaller; Lead-based paint disclosure required
Interior
- Kitchen: Kitchen approximately 15 x 11
- Bedrooms: Two bedrooms on the main level (primary ~15 x 11; second ~16 x 12)
- Flooring: Flooring: other (see remarks)
- Bathrooms: One full bathroom on the main level
- Heating & cooling: Natural gas heating; Central forced cooling
- Interior features: No fireplace; Other interior features (see remarks)
- Laundry & utility: Electric hookup for dryer
Neighborhood map
What this means for you Summary
Snapshot
- This is a 2-bed/1.0-bath single-family listed at $115k.
Deal economics
- At list price, monthly cash flow is $427 ($5k/yr) — positive.
- The deal already cash-flows at list — no discount required.
- Meets the 1% rule at list price ($1k rent vs $115k).
- Cap rate 10.7% vs local median 2.0% in Greenville — top-decile yield for the area; either an underpriced asset or a hidden risk that comps aren't pricing in. Stress-test before assuming the spread holds.
Location & tenants
- Location reads 79/100 on livability (#13 in SC, #2,003 nationally) — a middle-class / working-renter tenant base. Strengths: amenities A+, commute A+, health & safety A+; Watch: cost of living D+, crime F.
- Greenville 01 (suburban): math 44% / reading 54% proficiency, ranked #10 of 80 in SC (top 12%) — families likely to look elsewhere, expect single-tenant / working-renter base with shorter leases.
- Zoned schools: Cherrydale Elementary (math 27% / reading 19%, grade F, #469 of 597 statewide, top 79%, 689 students, 100% FRL) — zoned schools average 100% FRL vs 42% district-wide (58 pts higher); higher-poverty schools than district average — tighter screening recommended.
- Zoned-school proficiency averages 23% at this address vs 49% district-wide (-26 pts) — the specific schools serving this property underperform the Greenville 01 average; the district grade overstates school quality for this exact location.
- Market conditions: Rents flat; 196 active listings in the ZIP; 36 comparable units currently listed for rent nearby; rentals at typical pace (median 21d on market — plan ~3-4 weeks tenant-placement turnaround); 5,595 units permitted in Greenville County in 2024 (566 in 5+ unit buildings).
Forward outlook
- Local home prices are declining (-3.0%/yr); year-one equity from $795 of loan paydown is wiped out by about $3k of value loss. Plan a longer hold.
- Greenville County population projected at +34% by 2050 — long-run rental-demand tailwind backs the buy-and-hold thesis.
Negotiation context
- Only 5 days on market — expect competitive offers; lowballing is unlikely to land.
- Current owner paid $26k; list at $115k implies a 334% gain — meaningful room to come down on a strong offer.
Risks & watch-outs
- Climate carrying-cost: major flood risk; extreme-heat days projected 7→17/yr by 2055 (HVAC capex compounding) — expect insurance premiums to compound above CPI over the hold.
Questions for the listing agent
- Built in 1963 — when were the roof, HVAC, electrical panel, plumbing, and water heater last replaced?
- Is there a deadline driving the sale (1031 exchange, divorce, estate, relocation)? That informs how much negotiation room exists.
- Schools are B-rated — typically a magnet for longer-tenancy family renters. What's the average tenant stay here, and is there a school-zone premium baked into asking?
- Crime grade is F in this area — have there been break-ins, vandalism, or insurance claims at this property in the last 3 years? What carrier currently insures it and at what premium?
- What's the average days-on-market for RENTAL listings here right now (not sales)? A rising rental-DOM trend means longer vacancies and softer asking-rent achievability than the comps imply.
- What's the recent tenant-quality profile in this submarket — average credit score on applications, eviction rate, late-payment / NSF rate, and stable-employment percentage? A property-management company in the area should have these aggregated.
- How much new for-sale + rental construction is in the pipeline within 1–3 miles? Heavy new supply typically softens prices + rents 12–24 months out; constrained supply supports both.
Investment metrics
- 1% rule
- 1.29% ✓
- Cap rate
- 10.75%
- Cash-on-cash
- 15.90%
- DSCR
- 1.71
- GRM
- 6.5
CMA / ARV
- ARV (on-the-fly)
- $217,248
- Comps found
- 10
Show comp detail 10 sales within ~0.75 mi
| Address | Dist | Beds/Ba | Sqft | Sold | Price | $/sf | Match |
|---|---|---|---|---|---|---|---|
| 109 Hammett St | 0.07mi | 2/1.0 | 900 (-9%) | 9mo | $133,000 | $148 | 74 |
| 156 C St | 0.18mi | 2/1.0 | 938 (-5%) | 14mo | $124,000 | $132 | 71 |
| 38 2nd Ave | 0.27mi | 2/1.0 | 1,098 (+11%) | 3mo | $112,000 | $102 | 67 |
| 108 Mack St | 0.56mi | 2/2.0 | 1,018 (+3%) | 8mo | $234,000 | $230 | 58 |
| 11 Elrod St | 0.68mi | 2/1.0 | 945 (-5%) | 8mo | $200,000 | $212 | 54 |
| 7 Verner Creek Ct | 0.49mi | 3/1.5 (+1) | 1,044 (+5%) | 13mo | $228,500 | $219 | 51 |
| 200 W Hillcrest Dr | 0.75mi | 2/1.0 | 1,056 (+6%) | 11mo | $375,000 | $355 | 46 |
| 206 Robinson St | 0.69mi | 2/1.0 | 876 (-12%) | 5mo | $345,000 | $394 | 44 |
| 109 Chandler St | 0.74mi | 3/1.0 (+1) | 1,048 (+6%) | 15mo | $252,000 | $240 | 38 |
| 207 Old Paris Mountain Rd | 0.46mi | 3/2.0 (+1) | 1,103 (+11%) | 23mo | $229,735 | $208 | 32 |
Match score weights: distance 35% · size 25% · config 20% · recency 20%. Top-matched comps best support the ARV.
Projected returns pro-forma
-3.0% appreciation · 0.14% rent growth · sell at horizon
- IRR
- 3.6%
- Equity multiple
- 1.14×
- Total profit
- $4,386
- Equity at exit
- $17,147
- IRR
- 10.4%
- Equity multiple
- 1.70×
- Total profit
- $22,694
- Equity at exit
- $9,943
Cash invested: $32,200 (down + closing). Projections, not guarantees.
Landlord ↔ Tenant lean methodology
- Overall (STATE)
- 90 Strongly Landlord-Friendly
- State South Carolina
- 90 Strongly Landlord-Friendly · R+6
- County
- — inherits STATE
- City
- — inherits STATE
ZIP-level market 29609
- Rents YoY
- 0.1%
- Active inventory
- 196
- Price-to-rent
- 6.5×
Monthly cashflow live
- Estimated rent
- $1,484 high interval (Pro) →
- Mortgage (P&I)
- −$603
- Tax from tax record
- −$95 /mo · $1,140/yr
- Insurance
- −$48
- HOA
- −$0
- Vacancy / Maint / Mgmt
- −$312
- Net cashflow
- $427
Break-even live
UW: 25.0% down · 7.5% · 30yr · 1.5% tax · 5.0% vac · 8.0% maint · 8.0% mgmt
Financing live
Cash to close
- Down payment
- $28,750
- Closing costs
- $3,450
- Reserves months
- —
- Total cash needed
- —
Loan-product check · same deal, 3 products live
Conventional
25% down · 7.5% · 30yr
- Down + closing
- —
- Monthly P&I
- —
- Monthly cashflow
- —
- DSCR
- —
- Eligible?
- —
Personal DTI + credit; lowest rate.
DSCR
20% down · 8.5% · 30yr
- Down + closing
- —
- Monthly P&I
- —
- Monthly cashflow
- —
- DSCR
- —
- Eligible?
- —
No personal income docs; deal must DSCR.
Hard money
10% down · 12.0% · 12mo
- Down + closing
- —
- Monthly P&I
- —
- Monthly cashflow
- —
- DSCR
- —
- Eligible?
- —
Short-term bridge; refi at stabilization.
Rent comps 36 comps
| Address | Beds | Baths | Sqft | Rent | $/sqft | DOM | Units | Dist |
|---|---|---|---|---|---|---|---|---|
| 135 D St Greenville, SC | 2.0 | 1.0 | 938 | $1,150 | $1.23 | 21d | 1 | 0.19mi |
| 31 Victor St Greenville, SC | 1.0–2.0 | 1.0 | 759 | $2,419 | $3.18 | 23d | 15 | 0.23mi |
| 31 Victor St Unit 201 Greenville, SC | 2.0 | 1.0 | 895 | $1,700 | $1.90 | 23d | 1 | 0.27mi |
| 31 Victor St Unit 144 Greenville, SC | 2.0 | 1.0 | 860 | $1,634 | $1.90 | 23d | 1 | 0.27mi |
| 31 Victor St Unit 220 Greenville, SC | 1.0 | 1.0 | 659 | $1,252 | $1.90 | 23d | 1 | 0.27mi |
| 31 Victor St Unit 328 Greenville, SC | 2.0 | 1.0 | 835 | $1,585 | $1.90 | 23d | 1 | 0.27mi |
| 31 Victor St Unit 339 Greenville, SC | 2.0 | 1.0 | 975 | $1,853 | $1.90 | 23d | 1 | 0.27mi |
| 31 Victor St Unit 132 Greenville, SC | 1.0 | 1.0 | 783 | $1,488 | $1.90 | 23d | 1 | 0.27mi |
| 31 Victor St Unit 331 Greenville, SC | 2.0 | 1.0 | 995 | $2,204 | $2.22 | 23d | 1 | 0.27mi |
| 9 Cone Crest Ct Greenville, SC | 2.0 | 1.0 | 818 | $1,350 | $1.65 | 21d | 1 | 0.49mi |
| 1101 Hampton Avenue Ext Greenville, SC | 2.0 | 1.0 | 742 | $1,011 | $1.36 | 2d | 5 | 0.58mi |
| 1101 Hampton Avenue Ext Unit b Greenville, SC | 2.0 | 1.0 | 785 | $1,022 | $1.30 | 2d | 1 | 0.58mi |
| 1101 Hampton Avenue Ext Unit c Greenville, SC | 2.0 | 1.0 | 785 | $1,022 | $1.30 | 14d | 1 | 0.58mi |
| 1101 Hampton Avenue Ext Unit 1107-A Greenville, SC | 2.0 | 1.0 | 700 | $917 | $1.31 | 23d | 1 | 0.58mi |
| 1250 WATER TOWER Cir Greenville, SC | 2.0 | 1.0–2.0 | 790 | $1,959 | $2.48 | 3d | 28 | 0.59mi |
| 1103 Hampton Ave Unit D Greenville, SC | 2.0 | 1.0 | 700 | $917 | $1.31 | 23d | 1 | 0.60mi |
| 1103 Hampton Ave Unit D Greenville, SC | 2.0 | 1.0 | 750 | $1,000 | $1.33 | 14d | 1 | 0.60mi |
| 1107 Hampton Avenue Ext Apt A Greenville, SC | 2.0 | 1.0 | 750 | $1,175 | $1.57 | 23d | 1 | 0.60mi |
| 1109 Hampton Avenue Ext Unit c Greenville, SC | 2.0 | 1.0 | 785 | $1,022 | $1.30 | 2d | 1 | 0.61mi |
| 1109 Hampton Avenue Ext Unit c Greenville, SC | 2.0 | 1.0 | 785 | $1,100 | $1.40 | 14d | 1 | 0.61mi |
| 1109 Hampton Ave Unit A Greenville, SC | 2.0 | 1.0 | 785 | $1,022 | $1.30 | 14d | 1 | 0.61mi |
| 1121 Tsali Cir Greenville, SC | 2.0 | 1.0–2.0 | 906 | $2,401 | $2.65 | 3d | 8 | 0.63mi |
| 409 Pinckney St Apt 2D Greenville, SC | 2.0 | 1.0 | 900 | $1,300 | $1.44 | 3d | 1 | 0.68mi |
| 802 Hampton Ave Unit A Greenville, SC | 2.0 | 1.0 | 900 | $1,300 | $1.44 | 23d | 1 | 0.70mi |
| 403 McCrary St Greenville, SC | 2.0 | 1.0 | 868 | $1,200 | $1.38 | 3d | 1 | 0.74mi |
| 221 Church St Greenville, SC | 2.0 | 1.0 | 900 | $1,395 | $1.55 | 3d | 1 | 0.75mi |
| 3001 Old Buncombe Rd Greenville, SC | 1.0 | 1.0 | 650 | $875 | $1.35 | 14d | 1 | 0.86mi |
| 808 N Main St Greenville, SC | 2.0 | 1.0 | 800 | $1,050 | $1.31 | 2d | 1 | 1.09mi |
| 205 N Beacon St Greenville, SC | 2.0 | 1.0 | 752 | $1,850 | $2.46 | 23d | 1 | 1.15mi |
| 18 E Stone Ave Greenville, SC | 3.0 | 1.0–2.5 | 1017 | $2,193 | $2.16 | 3d | 20 | 1.19mi |
| 31 Swanson Ct Greenville, SC | 2.0 | 1.0 | 1050 | $1,950 | $1.86 | 23d | 1 | 1.28mi |
| 39 E 7th St Greenville, SC | 3.0 | 2.0 | 1120 | $1,750 | $1.56 | 3d | 1 | 1.33mi |
| 500 Birnie St Greenville, SC | 2.0 | 1.0 | 980 | $1,475 | $1.51 | 23d | 1 | 1.38mi |
| 233 N Main St Unit 405 Greenville, SC | 2.0 | 1.0 | 936 | $1,995 | $2.13 | 14d | 1 | 1.39mi |
| 33 9th St Greenville, SC | 2.0 | 1.0 | 886 | $1,000 | $1.13 | 23d | 1 | 1.44mi |
| 1 Craven St Unit 8 Greenville, SC | 2.0 | 1.0 | 850 | $1,350 | $1.59 | 3d | 1 | 1.49mi |
Listing history 6 events
-
2026-06-17status $115,000 Pending 5 DOM
-
2026-06-16days on market $115,000 Active 5 DOM
-
2026-06-15days on market $115,000 Active 4 DOM
-
2026-06-13days on market $115,000 Active 2 DOM
-
2026-06-13remarks 699-char remark
-
2026-06-13$115,000 Active 1 DOM
ⓘ Source: listings_history table (triggers on properties + properties_extension) + one-shot
backfill from property_details.listing_events for pre-trigger history.
Tax reassessment forecast SC · Resets to sale price
- Current annual tax
- $1,140 · $95/mo
- Projected year-2 tax
- $1,140 · $95/mo
- Expected delta
- $0/yr ($0/mo · 0.0%)
ⓘ Screening estimate from a state-policy table — verify with the county assessor before closing.
Climate risk First Street
- Flood 6/10 Major FEMA zone X (unshaded) · 73% chance over 30 yrs
- Wildfire 1/10 Low
- Heat 6/10 Major 7 d/yr ≥102°F today · 17 d/yr by 30 yrs out
- Wind 2/10 Low 0% chance of damaging wind over 30 yrs
- Air quality 4/10 Moderate 3 unhealthy d/yr today · 4 by 30 yrs out
Nearby sold comps map
Loading sold comps map…
Walkable amenities ~0.75 mi
Loading nearby amenities…
Taxation est. · year 1
- Rental income
- $17,814
- − Mortgage interest
- −$6,442
- − Property taxes
- −$1,140
- − Insurance
- −$575
- − Repairs & maintenance
- −$1,425
- − Management
- −$1,425
- − Depreciation
- −$3,345
- Taxable income
- $3,462
- Est. tax owed @ 24.0%
- −$831
- After-tax cash flow
- $4,290/yr
For passive investors: Depreciation is non-cash, so a rental often shows a tax loss while cash-flowing — sheltering income. Rental losses are passive: they offset passive income freely, and up to $25,000/yr can offset ordinary (W-2) income if you actively participate and your MAGI is under $100k (phasing out to $0 by $150k); unused losses carry forward. On sale, claimed depreciation is recaptured at up to 25%, and gains may owe capital-gains tax (a 1031 exchange can defer both). Figures are a year-1 estimate at your 24.0% rate — not tax advice; consult a CPA.
Schools (NCES district)
- District
- Greenville 01
- NCES district ID
- 4502310
- Math proficiency
- 44% ▼ -10.00%
- Reading proficiency
- 54% ▼ -2.00%
- Median HH income
- $49,596
- Composite
- 41.88/100
- National rank
- #3370
- State rank
- #10 of 80 in SC
Livability — Greenville
- Score
- 79/100
- State rank
- #13
- US rank
- #2003
Category grades
Schools grade is shown separately in the Schools card above.
Census & demographics
- County
- Greenville County · 573,815 people
- City population
- 230,766
- Metro
- Greenville-Anderson, SC
- Population (ZIP)
- 32,292
- Household income
- $65,342
- Rent vs Own
- Severe rent burden
- 1685.0
Population outlook (Greenville County) Hauer SSP2
- Today (2025)
- 574,580 people
- By 2030
- 615,615 · +7.1%
- By 2040
- 695,373 · +21.0%
- By 2050
- 769,367 · +33.9%
- By 2075
- 933,296 · +62.4%
- By 2100
- 1,029,196 · +79.1%
Race, ethnicity, and origin ACS 2023
- Neighborhood character
- Predominantly White (70%)
- Race & ethnicity
- White 70% Black 12% Hispanic / Latino 12% Two or more races 6% Asian 2%
- Hispanic origin (detail)
- Mexican 4% Puerto Rican 2% Dominican 1%
- Common ancestry
- Slovak 4% Italian 3% Serbian 2%
- Foreign-born
- 9% · Canada, Vietnam, Jamaica
- Languages at home
- 88% English-only · Spanish 8% Other Asian/Pacific 1% Vietnamese 1%
Political lean MEDSL · Greenville
- 2024 margin
- Strong R (+22.2) · D 38.0% · R 60.2% · Other 1.8%
- 2008→2024 swing
- +1.7pp toward D · 2008: -23.9pp · 2024: -22.2pp
- All cycles
- 2024: R+22.2 2020: R+18.2 2016: R+24.7 2012: R+27.8 2008: R+23.9
Not yet ingested
- Civics
- —
Market trends
- HPI YoY
- ▼ -291.09%
- Current HPI
- 277.6004
- Rent YoY
- ▲ 0.14%
- Metro
- Greenville-Anderson, SC
- State GDP YoY
- ▲ 4.51%
- F500 in state
- 2
Industry mix (Fortune 500 HQ in SC)
| Industry | F500 HQs | Revenue |
|---|---|---|
| Packaging | 1 | $7B |
|
||
Price history
+975.9% since first listed3 events — show timeline
- 2026-06-11 Listed $115,000 Greater Greenville MLS
- 1990-10-23 Sold (Public Records) $26,500 Public Records
- 1985-08-20 Sold (Public Records) $10,689 Public Records
Property tax history
+6.3%/yrLatest (2025): $1,140 · +3.4% YoY. Source: county tax records.
Cash-flow waterfall
monthlySold comps — $/sqft
last 12 mo · ≤1 miLoading sold comps…