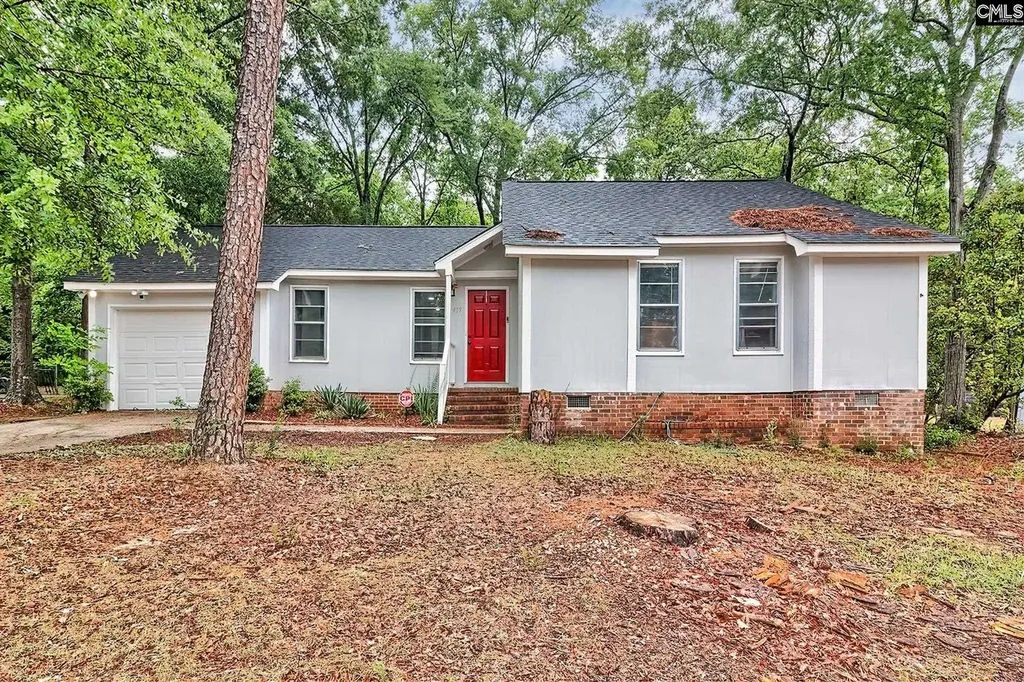
419 Parlock Rd · Irmo, SC
Flood risk 1/10 · Minimal
- FEMA flood zone
- X
- Chance of flooding over 30 yrs
- 0.0%
- Est. flood insurance / yr
- $435 – $905
Fire risk 2/10 · Minimal
- Est. fire insurance / yr
- $783 – $1,453
Heat risk 6/10 · Moderate
- Hot days now (above threshold)
- 7 days/yr
- Hot days in 30 yrs
- 15 days/yr
Wind risk No data
- Chance of severe wind over 30 yrs
- —
Air-quality risk No data
- Unhealthy air days now
- —
- Unhealthy air days in 30 yrs
- —
Risk factors via First Street. Map © Google.
Why this score? — see what drove the D grade
The composite is a weighted blend of 9 inputs, each scored 0–100. Each bar is that input's sub-score; the figure is the points it added to the 100-point composite (weight × sub-score).
- Cash flow +13.1/30.0
- ARV discount +7.5/15.0
- Schools +4.5/10.0
- DSCR +3.9/10.0
- Livability +3.7/5.0
- 1% rule +3.0/10.0
- Rent growth +2.7/5.0
- Condition / age +2.5/5.0
- Appreciation +0.0/10.0
$234,000
🖨 Deal sheet 📄 Offer letter ✓ Due diligence
Listing remarks
Welcome home to this beautifully updated single-story property tucked away on a spacious lot. From the moment you arrive, you’ll love the modern gray exterior, bold red front door, and peaceful setting surrounded by mature trees. Inside, the home offers a bright open layout with updated flooring, recessed lighting, and a large living area perfect for entertaining or relaxing. The oversized living room features plenty of natural light and flows seamlessly into the dining area and kitchen. The kitchen includes granite countertops, stainless steel appliances, updated fixtures, abundant cabinet space, and a functional layout ideal for everyday living. The adjoining dining area overlooks t
Key facts
- Private backyard
- Updated flooring
- Recessed lighting
Tags
Property features AI
Exterior
- Parking: Attached garage with 1-car capacity
- Utilities: Public water; Public sewer
- Home design: Single-story home
- Construction: Crawlspace foundation
- Exterior features: Wood exterior finish; Paved road access
Interior
- Kitchen: Eat-in kitchen; Painted cabinets; Granite countertops
- Bedrooms: Primary bedroom on main level with double vanity, walk-in closet, and ceiling fan; Second bedroom on main level with private closet; Third bedroom on main level with private closet
- Flooring: Luxury vinyl plank flooring in living areas and kitchen
- Bathrooms: Two full bathrooms
- Heating & cooling: Central heating; Central cooling
- Interior features: Ceiling fans throughout; Smoke detector; Disposal; Microwave installed above stove; Free-standing smooth-surface range
- Laundry & utility: Washer and dryer located on the main level
Neighborhood map
What this means for you Summary
Snapshot
- This is a 3-bed/2.0-bath single-family listed at $234k.
Deal economics
- At list price, monthly cash flow is $-9 ($-105/yr) — negative.
- To cash-flow at today's rent, offer at most $232k (0.7% below list).
- To meet the 1% rule (rent ≥ 1% of price), the offer needs to be $187k (20.0% below list).
- Recommended offer: $187k (20.0% below list) — sets the bar for 1% rule.
Location & tenants
- Location reads 73/100 on livability (#38 in SC) — a middle-class / working-renter tenant base. Strengths: cost of living A+, housing A+, employment B; Watch: amenities F, commute F.
- Lexington 05 (suburban): math 47% / reading 55% proficiency, ranked #5 of 80 in SC (top 6%) — acceptable for families but not a draw, mixed tenant base, ~2y average lease.
- Zoned schools: H. E. Corley Elementary (math 42% / reading 52%, grade D-, #209 of 597 statewide, top 36%, 558 students, 74% FRL); Dutch Fork High (math 54% / reading 86%, grade B+, #58 of 196 statewide, top 30%, 1,726 students, 52% FRL) — zoned schools average 63% FRL vs 27% district-wide (36 pts higher); higher-poverty schools than district average — tighter screening recommended.
- Market conditions: Rents flat; 315 active listings in the ZIP; 5 comparable units currently listed for rent nearby; rentals at typical pace (median 14d on market — plan ~3-4 weeks tenant-placement turnaround); solid renter incomes; 3,472 units permitted in Richland County in 2024 (1,096 in 5+ unit buildings).
Forward outlook
- Local home prices are declining (-3.0%/yr); year-one equity from $2k of loan paydown is wiped out by about $7k of value loss. Plan a longer hold.
- Richland County population projected at +30% by 2050 — long-run rental-demand tailwind backs the buy-and-hold thesis.
Negotiation context
- It's been on market 41 days — a 3% lower offer ($227k) is reasonable based on typical stale-listing flexibility.
- 6 sale attempts since 2y ago with the ask held roughly flat each time — persistent listings suggest the price (not the market) is what's stuck; bring a comps-based counter.
Risks & watch-outs
- Climate carrying-cost: extreme-heat days projected 7→15/yr by 2055 (HVAC capex compounding) — expect insurance premiums to compound above CPI over the hold.
Questions for the listing agent
- What do current leases actually rent for vs. the listed asking? Can we see a recent rent roll and the last 12 months of T-12 income?
- It's been on market 41 days. Have you received any prior offers? Is the seller open to a 20% concession, seller financing, or rate buy-down credit?
- Built in 1979 — when were the roof, HVAC, electrical panel, plumbing, and water heater last replaced?
- Is there a deadline driving the sale (1031 exchange, divorce, estate, relocation)? That informs how much negotiation room exists.
- Schools are B-rated — typically a magnet for longer-tenancy family renters. What's the average tenant stay here, and is there a school-zone premium baked into asking?
- The area grade is low — what's the realistic commute time and amenity access for the typical tenant pool here? Any planned neighborhood developments (good or bad) we should know about?
- What's the average days-on-market for RENTAL listings here right now (not sales)? A rising rental-DOM trend means longer vacancies and softer asking-rent achievability than the comps imply.
- What's the recent tenant-quality profile in this submarket — average credit score on applications, eviction rate, late-payment / NSF rate, and stable-employment percentage? A property-management company in the area should have these aggregated.
- How much new for-sale + rental construction is in the pipeline within 1–3 miles? Heavy new supply typically softens prices + rents 12–24 months out; constrained supply supports both.
Investment metrics
- 1% rule
- 0.80% ✗
- Cap rate
- 6.25%
- Cash-on-cash
- -0.16%
- DSCR
- 0.99
- GRM
- 10.4
CMA / ARV
No comps found within radius.
Projected returns pro-forma
-3.0% appreciation · 0.78% rent growth · sell at horizon
- IRR
- -18.9%
- Equity multiple
- 0.35×
- Total profit
- $-42,622
- Equity at exit
- $34,890
- IRR
- -16.3%
- Equity multiple
- 0.17×
- Total profit
- $-54,107
- Equity at exit
- $20,232
Cash invested: $65,520 (down + closing). Projections, not guarantees.
Landlord ↔ Tenant lean methodology
- Overall (STATE)
- 90 Strongly Landlord-Friendly
- State South Carolina
- 90 Strongly Landlord-Friendly · R+6
- County
- — inherits STATE
- City
- — inherits STATE
ZIP-level market 29063
- Rents YoY
- 0.8%
- Active inventory
- 315
- Price-to-rent
- 10.4×
Monthly cashflow live
- Estimated rent
- $1,873 high interval (Pro) →
- Mortgage (P&I)
- −$1,227
- Tax from tax record
- −$164 /mo · $1,967/yr
- Insurance
- −$98
- HOA
- −$0
- Vacancy / Maint / Mgmt
- −$393
- Net cashflow
- $-9
Break-even live
UW: 25.0% down · 7.5% · 30yr · 1.5% tax · 5.0% vac · 8.0% maint · 8.0% mgmt
Financing live
Cash to close
- Down payment
- $58,500
- Closing costs
- $7,020
- Reserves months
- —
- Total cash needed
- —
Loan-product check · same deal, 3 products live
Conventional
25% down · 7.5% · 30yr
- Down + closing
- —
- Monthly P&I
- —
- Monthly cashflow
- —
- DSCR
- —
- Eligible?
- —
Personal DTI + credit; lowest rate.
DSCR
20% down · 8.5% · 30yr
- Down + closing
- —
- Monthly P&I
- —
- Monthly cashflow
- —
- DSCR
- —
- Eligible?
- —
No personal income docs; deal must DSCR.
Hard money
10% down · 12.0% · 12mo
- Down + closing
- —
- Monthly P&I
- —
- Monthly cashflow
- —
- DSCR
- —
- Eligible?
- —
Short-term bridge; refi at stabilization.
Rent comps 5 comps
| Address | Beds | Baths | Sqft | Rent | $/sqft | DOM | Units | Dist |
|---|---|---|---|---|---|---|---|---|
| 136 Weston Watch Rd Irmo, SC | 3.0 | 2.0 | 1200 | $1,695 | $1.41 | 3d | 1 | 0.21mi |
| 13 Dyers Hall Ct Irmo, SC | 3.0 | 2.0 | 1127 | $1,699 | $1.51 | 23d | 1 | 0.48mi |
| 530 Chadford Rd Irmo, SC | 3.0 | 2.0 | 1196 | $1,695 | $1.42 | 14d | 1 | 0.64mi |
| 228 Chadford Rd Irmo, SC | 3.0 | 2.0 | 1318 | $1,861 | $1.41 | 14d | 1 | 0.94mi |
| 22 Dean Crest Ct Irmo, SC | 3.0 | 2.0 | 1301 | $1,695 | $1.30 | 3d | 1 | 1.00mi |
Listing history 33 events
-
2026-06-15days on market $234,000 Active 41 DOM
-
2026-06-14days on market $234,000 Active 39 DOM
-
2026-06-13days on market $234,000 Active 38 DOM
-
2026-06-10days on market $234,000 Active 36 DOM
-
2026-06-09days on market $234,000 Active 35 DOM
-
2026-06-08days on market $234,000 Active 34 DOM
-
2026-06-07days on market $234,000 Active 33 DOM
-
2026-06-03days on market $234,000 Active 29 DOM
-
2026-06-03days on market $234,000 Active 28 DOM
-
2026-06-01days on market $234,000 Active 27 DOM
-
2026-05-31days on market $234,000 Active 26 DOM
-
2026-05-05$234,000 Active
-
2024-08-12soldstatus $229,400
-
2024-07-30status Pending
-
2024-07-15historical Active - Contingent
-
2024-07-02price $224,900
-
2024-07-01status Active
-
2024-06-25status Pending
-
2024-06-10historical Active - Contingent
-
2024-05-29$223,900 Active
-
2024-04-26status Active
-
2024-04-12historical Active - Contingent
-
2024-04-11status Active
-
2024-04-03status Pending
-
2024-03-19historical Active - Contingent
-
2024-03-12price $219,900
-
2024-03-06price $224,900
-
2024-02-23price $231,900
-
2024-02-09$235,900 Active
-
2017-10-10price $114,900
-
2000-12-14soldstatus $65,502
-
1987-07-01soldstatus $58,800
-
1984-09-01soldstatus $52,600
ⓘ Source: listings_history table (triggers on properties + properties_extension) + one-shot
backfill from property_details.listing_events for pre-trigger history.
Tax reassessment forecast SC · Resets to sale price
- Current annual tax
- $1,967 · $164/mo
- Projected year-2 tax
- $1,967 · $164/mo
- Expected delta
- $0/yr ($0/mo · 0.0%)
ⓘ Screening estimate from a state-policy table — verify with the county assessor before closing.
Climate risk First Street
- Flood 1/10 Low FEMA zone X · 0% chance over 30 yrs
- Wildfire 2/10 Low
- Heat 6/10 Major
Nearby sold comps map
Loading sold comps map…
Walkable amenities ~0.75 mi
Loading nearby amenities…
Taxation est. · year 1
- Rental income
- $22,477
- − Mortgage interest
- −$13,108
- − Property taxes
- −$1,967
- − Insurance
- −$1,170
- − Repairs & maintenance
- −$1,798
- − Management
- −$1,798
- − Depreciation
- −$6,807
- Taxable loss
- −$4,171
- Est. tax savings @ 24.0%
- +$1,001
- After-tax cash flow
- $896/yr
For passive investors: Depreciation is non-cash, so a rental often shows a tax loss while cash-flowing — sheltering income. Rental losses are passive: they offset passive income freely, and up to $25,000/yr can offset ordinary (W-2) income if you actively participate and your MAGI is under $100k (phasing out to $0 by $150k); unused losses carry forward. On sale, claimed depreciation is recaptured at up to 25%, and gains may owe capital-gains tax (a 1031 exchange can defer both). Figures are a year-1 estimate at your 24.0% rate — not tax advice; consult a CPA.
Schools (NCES district)
- District
- Lexington 05
- NCES district ID
- 4502820
- Math proficiency
- 47% ▼ -7.00%
- Reading proficiency
- 55% ▼ -4.00%
- Median HH income
- $67,732
- Composite
- 45.28/100
- National rank
- #2656
- State rank
- #5 of 80 in SC
Livability — Irmo
- Score
- 73/100
- State rank
- #38
- US rank
- #5024
Category grades
Schools grade is shown separately in the Schools card above.
Census & demographics
- Census place
- Irmo, SC
- County
- Richland County · 389,530 people
- City population
- 38,201
- Metro
- Columbia, SC
- Population (ZIP)
- 38,201
- Household income
- $91,973
- Rent vs Own
- Severe rent burden
- 962.0
Population outlook (Richland County) Hauer SSP2
- Today (2025)
- 459,667 people
- By 2030
- 487,524 · +6.1%
- By 2040
- 542,035 · +17.9%
- By 2050
- 595,371 · +29.5%
- By 2075
- 732,998 · +59.5%
- By 2100
- 820,415 · +78.5%
Race, ethnicity, and origin ACS 2023
- Neighborhood character
- Majority White (65%)
- Race & ethnicity
- White 65% Black 26% Two or more races 5% Hispanic / Latino 3% Asian 2%
- Common ancestry
- Romanian 4% Slovak 4% Serbian 3%
- Foreign-born
- 4% · Canada
- Languages at home
- 95% English-only · Spanish 2% Russian/Polish/Slavic 1% Other Indo-European 1%
Political lean MEDSL · Richland
- 2024 margin
- Solid D (+34.6) · D 66.4% · R 31.8% · Other 1.8%
- 2008→2024 swing
- +5.7pp toward D · 2008: 28.9pp · 2024: 34.6pp
- All cycles
- 2024: D+34.6 2020: D+38.3 2016: D+32.9 2012: D+33.3 2008: D+28.9
Not yet ingested
- Civics
- —
Market trends
- HPI YoY
- ▼ -130.57%
- Current HPI
- 204.0147
- Rent YoY
- ▲ 0.78%
- Metro
- Columbia, SC
- State GDP YoY
- ▲ 4.51%
- F500 in state
- 2
Industry mix (Fortune 500 HQ in SC)
| Industry | F500 HQs | Revenue |
|---|---|---|
| Packaging | 1 | $7B |
|
||
Price history
+344.9% since first listed22 events — show timeline
- 2026-05-05 Listed $234,000 Consolidated MLS
- 2024-08-12 Sold (Public Records) $229,400 Public Records
- 2024-07-30 Pending — Consolidated MLS
- 2024-07-15 Contingent — Consolidated MLS
- 2024-07-02 Price Changed $224,900 Consolidated MLS
- 2024-07-01 Relisted — Consolidated MLS
- 2024-06-25 Pending — Consolidated MLS
- 2024-06-10 Contingent — Consolidated MLS
- 2024-05-29 Listed $223,900 Consolidated MLS
- 2024-04-26 Relisted — Consolidated MLS
- 2024-04-12 Contingent — Consolidated MLS
- 2024-04-11 Relisted — Consolidated MLS
- 2024-04-03 Pending — Consolidated MLS
- 2024-03-19 Contingent — Consolidated MLS
- 2024-03-12 Price Changed $219,900 Consolidated MLS
- 2024-03-06 Price Changed $224,900 Consolidated MLS
- 2024-02-23 Price Changed $231,900 Consolidated MLS
- 2024-02-09 Listed $235,900 Consolidated MLS
- 2017-10-10 Price Changed $114,900 Consolidated MLS
- 2000-12-14 Sold (Public Records) $65,502 Public Records
- 1987-07-01 Sold (Public Records) $58,800 Public Records
- 1984-09-01 Sold (Public Records) $52,600 Public Records
Property tax history
-1.3%/yrLatest (2025): $1,967 · -37.5% YoY. Source: county tax records.
Cash-flow waterfall
monthlySold comps — $/sqft
last 12 mo · ≤1 miLoading sold comps…