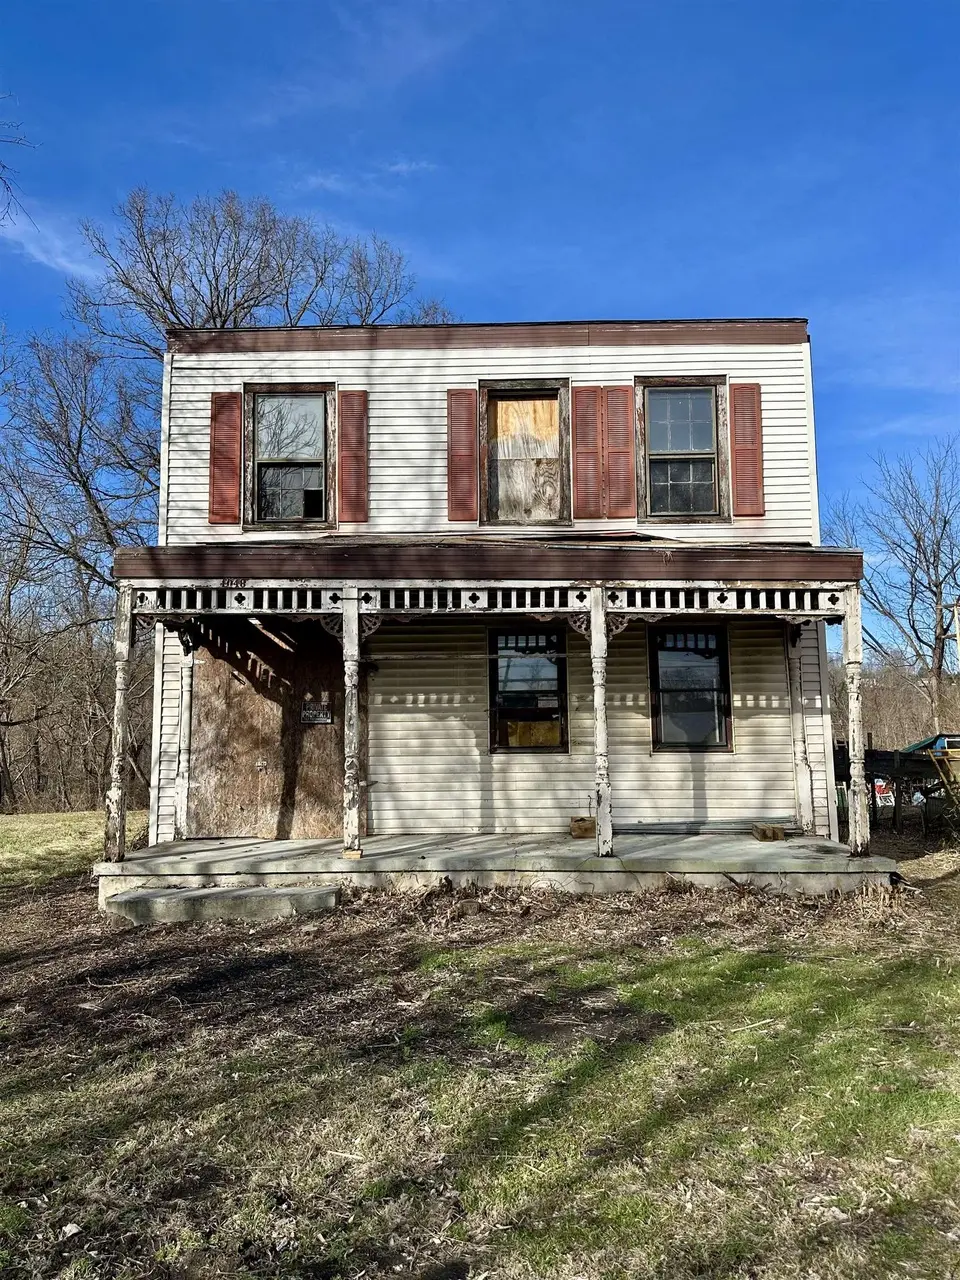
1048 Stockton St · Radford, VA
Flood risk No data
- FEMA flood zone
- —
- Chance of flooding over 30 yrs
- —
- Est. flood insurance / yr
- —
Fire risk No data
- Est. fire insurance / yr
- —
Heat risk No data
- Hot days now (above threshold)
- —
- Hot days in 30 yrs
- —
Wind risk No data
- Chance of severe wind over 30 yrs
- —
Air-quality risk No data
- Unhealthy air days now
- —
- Unhealthy air days in 30 yrs
- —
Risk factors via First Street. Map © Google.
Why this score? — see what drove the B grade
The composite is a weighted blend of 9 inputs, each scored 0–100. Each bar is that input's sub-score; the figure is the points it added to the 100-point composite (weight × sub-score).
- Cash flow +30.0/30.0
- 1% rule +10.0/10.0
- DSCR +10.0/10.0
- ARV discount +7.5/15.0
- Schools +5.9/10.0
- Rent growth +4.2/5.0
- Livability +3.4/5.0
- Condition / age +2.5/5.0
- Appreciation +0.0/10.0
$36,500
🖨 Deal sheet 📄 Offer letter ✓ Due diligence
Listing remarks MLS
Investor opportunity in the heart of Radford. This 2-bedroom, 2-bath home is situated on one of Radford’s original parceled lots, just steps from Radford University and Radford's recreation fields. The property is in very distressed condition and will require a full renovation. Heart pine floors may be salvageable. Some original architectural details remain and would worth bringing back to life. Ideal for experienced investors or contractors seeking a project in a highly desirable rental or resale location. Sold as-is, where-is.
Key facts
- Full renovation
- 0.25 acre lot
- Built 1920
Tags
Neighborhood map
What this means for you Summary
Snapshot
- This is a 2-bed/2.0-bath single-family listed at $36k.
Deal economics
- At list price, monthly cash flow is $682 ($8k/yr) — positive.
- The deal already cash-flows at list — no discount required.
- Meets the 1% rule at list price ($1k rent vs $36k).
- Recommended offer: $32k (12.0% below list) — sets the bar for market timing.
- Cap rate 28.7% vs local median 3.6% in Radford — top-decile yield for the area; either an underpriced asset or a hidden risk that comps aren't pricing in. Stress-test before assuming the spread holds.
Location & tenants
- Location reads 68/100 on livability (#269 in VA) — a middle-class / working-renter tenant base. Strengths: cost of living A+, schools A-, crime A-; Watch: amenities F, commute F, employment F.
- Radford City Public School District (urban): math 66% / reading 78% proficiency, ranked #26 of 131 in VA (top 20%) — strong family-tenant draw, lease renewals of 3-5y typical.
- Market conditions: Rents rising fast (+6.6%/yr); 150 active listings in the ZIP; 1 comparable units currently listed for rent nearby; 28 units permitted in Radford city in 2024 (0 in 5+ unit buildings).
Forward outlook
- Local home prices are declining (-3.0%/yr); year-one equity from $252 of loan paydown is wiped out by about $1k of value loss. Plan a longer hold.
- Radford County population projected at +32% by 2050 — long-run rental-demand tailwind backs the buy-and-hold thesis.
- At projected returns (-3.0% appreciation + 6.6% rent growth), your $10k cash investment doubles in ~2 years — after that, you're playing with house money.
Negotiation context
- It's been on market 124 days — a 12% lower offer ($32k) is reasonable based on typical stale-listing flexibility.
- Current owner paid $7k; list at $36k implies a 407% gain — meaningful room to come down on a strong offer.
Risks & watch-outs
- Watch-outs: built in 1920 — expect roof / HVAC / electrical / plumbing capex.
Questions for the listing agent
- It's been on market 124 days. Have you received any prior offers? Is the seller open to a 12% concession, seller financing, or rate buy-down credit?
- Built in 1920 — when were the roof, HVAC, electrical panel, plumbing, and water heater last replaced?
- Why hasn't it sold? Are there any deal-killer items the seller is aware of (foundation, flood, title, zoning, code violations)?
- Is there a deadline driving the sale (1031 exchange, divorce, estate, relocation)? That informs how much negotiation room exists.
- Schools are A-rated — typically a magnet for longer-tenancy family renters. What's the average tenant stay here, and is there a school-zone premium baked into asking?
- What's the average days-on-market for RENTAL listings here right now (not sales)? A rising rental-DOM trend means longer vacancies and softer asking-rent achievability than the comps imply.
- What's the recent tenant-quality profile in this submarket — average credit score on applications, eviction rate, late-payment / NSF rate, and stable-employment percentage? A property-management company in the area should have these aggregated.
- How much new for-sale + rental construction is in the pipeline within 1–3 miles? Heavy new supply typically softens prices + rents 12–24 months out; constrained supply supports both.
Investment metrics
- 1% rule
- 3.17% ✓
- Cap rate
- 28.72%
- Cash-on-cash
- 80.10%
- DSCR
- 4.56
- GRM
- 2.6
CMA / ARV
- ARV (median comp)
- $262,546
- List price
- $36,500
- Delta
- -86.10%
- Verdict
- UNDERPRICED
- Comps
- 20 within 1.0 mi
Show comp detail 4 sales within ~0.75 mi
| Address | Dist | Beds/Ba | Sqft | Sold | Price | $/sf | Match |
|---|---|---|---|---|---|---|---|
| 1026 Stockton St | 0.03mi | 3/2.0 (+1) | 1,856 (+3%) | 21mo | $254,000 | $137 | 72 |
| 112 Jackson Cir | 0.63mi | 3/2.0 (+1) | 1,922 (+6%) | 5mo | $250,000 | $130 | 51 |
| 5980 Dudley Ferry Rd | 0.66mi | 3/2.5 (+1) | 1,638 (-9%) | 12mo | $470,000 | $287 | 36 |
| 6638 Riverview Dr | 0.56mi | 3/1.5 (+1) | 1,560 (-14%) | 14mo | $250,000 | $160 | 33 |
Match score weights: distance 35% · size 25% · config 20% · recency 20%. Top-matched comps best support the ARV.
Projected returns pro-forma
-3.0% appreciation · 6.63% rent growth · sell at horizon
- IRR
- 84.3%
- Equity multiple
- 5.10×
- Total profit
- $41,926
- Equity at exit
- $5,442
- IRR
- 88.4%
- Equity multiple
- 11.95×
- Total profit
- $111,868
- Equity at exit
- $3,156
Cash invested: $10,220 (down + closing). Projections, not guarantees.
Landlord ↔ Tenant lean methodology
- Overall (STATE)
- 55 Moderately Landlord-Leaning
- State Virginia
- 55 Moderately Landlord-Leaning · D+2
- County
- — inherits STATE
- City
- — inherits STATE
ZIP-level market 24141
- Home prices YoY
- -26.2%
- Rents YoY
- 6.6%
- Active inventory
- 150
- Price-to-rent
- 2.6×
Monthly cashflow live
- Estimated rent
- $1,158 medium interval (Pro) →
- Mortgage (P&I)
- −$191
- Tax from tax record
- −$26 /mo · $314/yr
- Insurance
- −$15
- HOA
- −$0
- Vacancy / Maint / Mgmt
- −$243
- Net cashflow
- $682
Break-even live
UW: 25.0% down · 7.5% · 30yr · 1.5% tax · 5.0% vac · 8.0% maint · 8.0% mgmt
Financing live
Cash to close
- Down payment
- $9,125
- Closing costs
- $1,095
- Reserves months
- —
- Total cash needed
- —
Loan-product check · same deal, 3 products live
Conventional
25% down · 7.5% · 30yr
- Down + closing
- —
- Monthly P&I
- —
- Monthly cashflow
- —
- DSCR
- —
- Eligible?
- —
Personal DTI + credit; lowest rate.
DSCR
20% down · 8.5% · 30yr
- Down + closing
- —
- Monthly P&I
- —
- Monthly cashflow
- —
- DSCR
- —
- Eligible?
- —
No personal income docs; deal must DSCR.
Hard money
10% down · 12.0% · 12mo
- Down + closing
- —
- Monthly P&I
- —
- Monthly cashflow
- —
- DSCR
- —
- Eligible?
- —
Short-term bridge; refi at stabilization.
Rent comps 1 comps
| Address | Beds | Baths | Sqft | Rent | $/sqft | DOM | Units | Dist |
|---|---|---|---|---|---|---|---|---|
| 101 Ridgewood Ln Radford, VA | 2.0–3.0 | 1.0–2.0 | 1188 | $999 | $0.84 | 43d | 1 | 1.50mi |
Listing history 4 events
-
2026-04-01price $36,500 540-char remark
Show marketing remark (540 chars)
Investor opportunity in the heart of Radford. This 2-bedroom, 2-bath home is situated on one of Radford’s original parceled lots, just steps from Radford University and Radford's recreation fields. The property is in very distressed condition and will require a full renovation. Heart pine floors may be salvageable. Some original architectural details remain and would worth bringing back to life. Ideal for experienced investors or contractors seeking a project in a highly desirable rental or resale location. Sold as-is, where-is.
-
2026-02-08price $39,900 540-char remark
Show marketing remark (540 chars)
Investor opportunity in the heart of Radford. This 2-bedroom, 2-bath home is situated on one of Radford’s original parceled lots, just steps from Radford University and Radford's recreation fields. The property is in very distressed condition and will require a full renovation. Heart pine floors may be salvageable. Some original architectural details remain and would worth bringing back to life. Ideal for experienced investors or contractors seeking a project in a highly desirable rental or resale location. Sold as-is, where-is.
-
2026-01-18$42,500 Active 540-char remark
Show marketing remark (540 chars)
Investor opportunity in the heart of Radford. This 2-bedroom, 2-bath home is situated on one of Radford’s original parceled lots, just steps from Radford University and Radford's recreation fields. The property is in very distressed condition and will require a full renovation. Heart pine floors may be salvageable. Some original architectural details remain and would worth bringing back to life. Ideal for experienced investors or contractors seeking a project in a highly desirable rental or resale location. Sold as-is, where-is.
-
2025-09-16soldstatus $7,200
ⓘ Source: listings_history table (triggers on properties + properties_extension) + one-shot
backfill from property_details.listing_events for pre-trigger history.
Tax reassessment forecast VA · Resets to sale price
- Current annual tax
- $314 · $26/mo
- Projected year-2 tax
- $314 · $26/mo
- Expected delta
- $0/yr ($0/mo · 0.0%)
ⓘ Screening estimate from a state-policy table — verify with the county assessor before closing.
Nearby sold comps map
Loading sold comps map…
Walkable amenities ~0.75 mi
Loading nearby amenities…
Taxation est. · year 1
- Rental income
- $13,899
- − Mortgage interest
- −$2,045
- − Property taxes
- −$314
- − Insurance
- −$182
- − Repairs & maintenance
- −$1,112
- − Management
- −$1,112
- − Depreciation
- −$1,062
- Taxable income
- $8,072
- Est. tax owed @ 24.0%
- −$1,937
- After-tax cash flow
- $6,249/yr
For passive investors: Depreciation is non-cash, so a rental often shows a tax loss while cash-flowing — sheltering income. Rental losses are passive: they offset passive income freely, and up to $25,000/yr can offset ordinary (W-2) income if you actively participate and your MAGI is under $100k (phasing out to $0 by $150k); unused losses carry forward. On sale, claimed depreciation is recaptured at up to 25%, and gains may owe capital-gains tax (a 1031 exchange can defer both). Figures are a year-1 estimate at your 24.0% rate — not tax advice; consult a CPA.
Schools (NCES district)
- District
- Radford City Public School District
- NCES district ID
- 5103180
- Math proficiency
- 66% ▼ -22.00%
- Reading proficiency
- 78% ▼ -5.00%
- Median HH income
- $32,239
- Composite
- 59.29/100
- National rank
- #935
- State rank
- #26 of 131 in VA
Livability — Radford
- Score
- 68/100
- State rank
- #269
- US rank
- #9496
Category grades
Schools grade is shown separately in the Schools card above.
Census & demographics
- Census place
- Radford, VA
- County
- Radford City · 21,484 people
- City population
- 21,484
- Metro
- Blacksburg-Christiansburg, VA
- Population (ZIP)
- 21,484
- Household income
- $62,969
- Rent vs Own
- Severe rent burden
- 1211.0
Population outlook (Radford County) Hauer SSP2
- Today (2025)
- 21,530 people
- By 2030
- 23,199 · +7.8%
- By 2040
- 25,758 · +19.6%
- By 2050
- 28,422 · +32.0%
- By 2075
- 35,350 · +64.2%
- By 2100
- 42,449 · +97.2%
Race, ethnicity, and origin ACS 2023
- Neighborhood character
- Predominantly White (85%)
- Race & ethnicity
- White 85% Black 7% Hispanic / Latino 4% Two or more races 3% Asian 2%
- Common ancestry
- Slovak 3% Serbian 2% Romanian 1%
- Foreign-born
- 3% · Canada, Vietnam, China
- Languages at home
- 95% English-only · Spanish 2% Other Indo-European 1%
Political lean MEDSL · Radford
- 2024 margin
- Toss-up / Even · D 49.3% · R 48.8% · Other 1.9%
- 2008→2024 swing
- -8.9pp toward R · 2008: 9.4pp · 2024: 0.5pp
- All cycles
- 2024: D+0.5 2020: D+9.1 2016: D+4.7 2012: D+3.9 2008: D+9.4
Not yet ingested
- Civics
- —
Market trends
- HPI YoY
- ▼ -85.42%
- Current HPI
- 240.7418
- Rent YoY
- ▲ 6.63%
- Metro
- Blacksburg-Christiansburg, VA
- State GDP YoY
- ▲ 2.40%
- F500 in state
- 50
Industry mix (Fortune 500 HQ in VA)
| Industry | F500 HQs | Revenue |
|---|---|---|
| Aerospace / Defense | 4 | $236B |
|
||
| Technology / Defense | 3 | $32B |
|
||
| Financial Services | 2 | $176B |
|
||
| Utilities | 2 | $27B |
|
||
| Insurance | 2 | $25B |
|
||
| Technology | 2 | $15B |
|
||
Price history
+406.9% since first listed4 events — show timeline
- 2026-04-01 Price Changed $36,500 NRVMLS
- 2026-02-08 Price Changed $39,900 NRVMLS
- 2026-01-18 Listed $42,500 NRVMLS
- 2025-09-16 Sold (Public Records) $7,200 Public Records
Property tax history
+3.0%/yrLatest (2025): $314 · +18.8% YoY. Source: county tax records.
Cash-flow waterfall
monthlySold comps — $/sqft
last 12 mo · ≤1 miLoading sold comps…