3526 Rock Springs Ct · Potosi, TX
Flood risk 1/10 · Minimal
- FEMA flood zone
- A
- Chance of flooding over 30 yrs
- 0.0%
- Est. flood insurance / yr
- $1,009 – $1,996
Fire risk 4/10 · Minor
- Est. fire insurance / yr
- $1,222 – $2,270
Heat risk 7/10 · Major
- Hot days now (above 103°F)
- 7 days/yr
- Hot days in 30 yrs
- 24 days/yr
Wind risk 4/10 · Minor
- Chance of severe wind over 30 yrs
- 22.0%
Air-quality risk 1/10 · Minimal
- Unhealthy air days now
- 0 days/yr
- Unhealthy air days in 30 yrs
- 0 days/yr
Risk factors via First Street. Map © Google.
Why this score? — see what drove the D+ grade
The composite is a weighted blend of 9 inputs, each scored 0–100. Each bar is that input's sub-score; the figure is the points it added to the 100-point composite (weight × sub-score).
- Cash flow +16.9/30.0
- Schools +5.6/10.0
- DSCR +5.3/10.0
- Rent growth +5.0/5.0
- 1% rule +4.6/10.0
- Condition / age +4.0/5.0
- ARV discount +3.8/15.0
- Livability +3.5/5.0
- Appreciation +0.0/10.0
$241,990
🖨 Deal sheet 📄 Offer letter ✓ Due diligence
Listing remarks
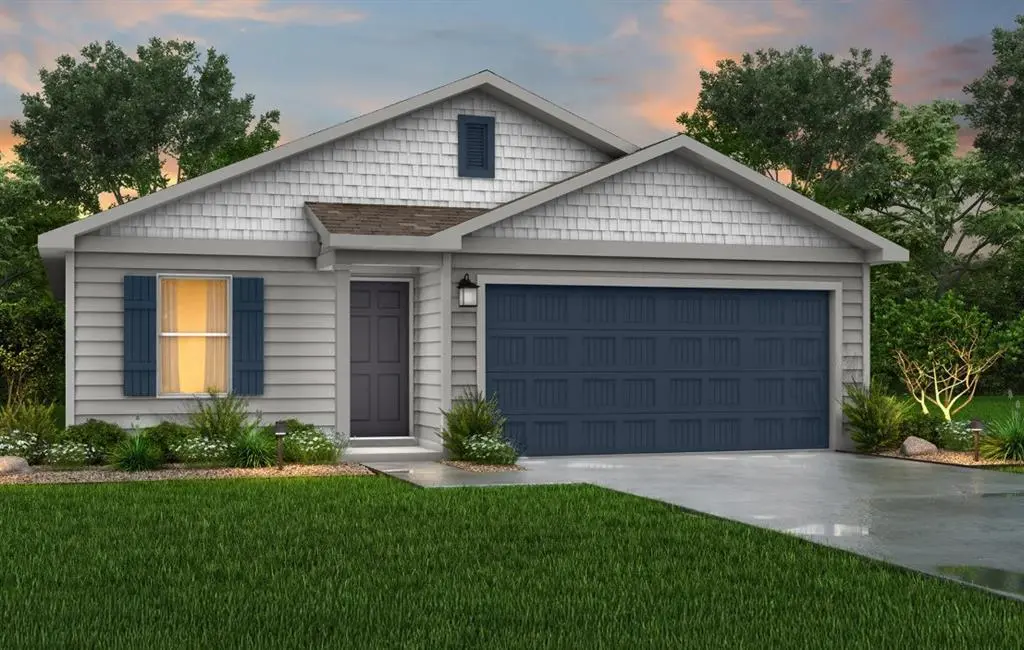
MLS# 21239285 - Built by NHC - Aug 2026 completion! ~ Model 1209 A1 - Washington The Washington Plan from our Liberty Series is a thoughtfully designed single-story home featuring 3 bedrooms, 2 bathrooms, a 2-car garage, and 1,209 square feet of functional living space. As you step inside, you’ll find two secondary bedrooms and a full bathroom conveniently located at the front of the home. Continue into the bright and open living area, where the kitchen with a central island seamlessly overlooks the dining area and family room, creating a perfect space for everyday living and entertaining. The laundry room is thoughtfully situated off the kitchen for easy access. The primary bedroom,
Key facts
- 5,663 sq ft lot
- 2 garage spots
- Built 2026
Property features AI
Finance
- Other: Special listing condition: Builder; Possession at closing/funding
- Financial info: Acceptable financing: Cash, Conventional, FHA, VA; Treat as clear loan type; No second mortgage reported
- HOA & community: No homeowners association
Exterior
- Parking: 2-car garage (garage faces front, approximately 19' x 20'); Covered parking for 2; 1 carport space
- Security: No smart-home features reported
- Utilities: City water; City sewer; Electric service available; Not in a municipal utility district
- Home design: Single family residential; Single-story; New construction (incomplete, year built 2026); Not attached to another unit
- Construction: Composition roof; Board & batten siding and fiber cement siding; Siding exterior; Slab foundation; New construction (2026)
- Exterior features: Less than 0.5 acre lot; Subdivision: Cedar Creek On Maple; Directions to property provided
Interior
- Kitchen: Dishwasher; Electric cooktop; Electric range; Microwave; Eat-in kitchen with pantry
- Bedrooms: 3 bedrooms (all on the main level); Primary bedroom with walk-in closet
- Flooring: Carpet; Laminate
- Bathrooms: 2 full bathrooms
- Heating & cooling: Central heating (electric); Central air conditioning (electric)
- Interior features: Double vanity; Eat-in kitchen; Pantry; One living area; One dining area; Total of 6 rooms; One level (single-story)
- Laundry & utility: Utilities and laundry details not provided
Neighborhood map
What this means for you Summary
Snapshot
- This is a 3-bed/2.0-bath single-family listed at $242k. Condition is rated good.
Deal economics
- At list price, monthly cash flow is $36 ($432/yr) — positive.
- The deal already cash-flows at list — no discount required.
- To meet the 1% rule (rent ≥ 1% of price), the offer needs to be $232k (4.1% below list).
- Recommended offer: $232k (4.1% below list) — sets the bar for 1% rule.
- Cap rate 7.1% vs local median 4.7% in Potosi — top-decile yield for the area; either an underpriced asset or a hidden risk that comps aren't pricing in. Stress-test before assuming the spread holds.
Location & tenants
- Location reads 69/100 on livability (#398 in TX) — a middle-class / working-renter tenant base. Strengths: crime A+, employment A+, cost of living A+; Watch: health & safety D+, schools F, amenities F.
- Wylie ISD (rural): math 63% / reading 62% proficiency, ranked #32 of 826 in TX (top 4%) — acceptable for families but not a draw, mixed tenant base, ~2y average lease; only 17% free/reduced lunch — higher-income household profile.
- Market conditions: Rents rising fast (+33.5%/yr); 370 active listings in the ZIP; solid renter incomes; 508 units permitted in Taylor County in 2024 (0 in 5+ unit buildings).
- This rent runs 31% of the median local income ($90k/yr) — at the standard rent-burdened threshold; future hikes will face affordability resistance.
Forward outlook
- Local home prices are declining (-3.0%/yr); year-one equity from $2k of loan paydown is wiped out by about $7k of value loss. Plan a longer hold.
- Taylor County population projected at +16% by 2050 — long-run rental-demand tailwind backs the buy-and-hold thesis.
Negotiation context
- It's been on market 17 days — a 2% lower offer ($238k) is reasonable based on typical stale-listing flexibility.
- 2 sale attempts with the ask held roughly flat each time — persistent listings suggest the price (not the market) is what's stuck; bring a comps-based counter.
Risks & watch-outs
- Watch-outs: flood insurance adds $125/mo.
- Climate carrying-cost: in FEMA flood zone A (mandatory federal flood insurance); extreme-heat days projected 7→24/yr by 2055 (HVAC capex compounding) — expect insurance premiums to compound above CPI over the hold.
Questions for the listing agent
- What's the actual annual flood-insurance premium (NFIP or private), and is the property in a SFHA with mandatory coverage?
- Is there a deadline driving the sale (1031 exchange, divorce, estate, relocation)? That informs how much negotiation room exists.
- Schools are F-rated, which usually means shorter tenancies and higher turnover. Who's the typical renter profile here, and what's been the actual vacancy rate?
- The area grade is low — what's the realistic commute time and amenity access for the typical tenant pool here? Any planned neighborhood developments (good or bad) we should know about?
- What's the average days-on-market for RENTAL listings here right now (not sales)? A rising rental-DOM trend means longer vacancies and softer asking-rent achievability than the comps imply.
- What's the recent tenant-quality profile in this submarket — average credit score on applications, eviction rate, late-payment / NSF rate, and stable-employment percentage? A property-management company in the area should have these aggregated.
- How much new for-sale + rental construction is in the pipeline within 1–3 miles? Heavy new supply typically softens prices + rents 12–24 months out; constrained supply supports both.
Investment metrics
- 1% rule
- 0.96% ✗
- Cap rate
- 7.09%
- Cash-on-cash
- 2.85%
- DSCR
- 1.13
- GRM
- 8.7
CMA / ARV
- ARV (on-the-fly)
- $223,665
- Comps found
- 12
Show comp detail 12 sales within ~0.75 mi
| Address | Dist | Beds/Ba | Sqft | Sold | Price | $/sf | Match |
|---|---|---|---|---|---|---|---|
| 1899 Trigger Happy Trl | 0.00mi | 3/2.0 | 1,217 (+1%) | 6mo | $225,000 | $185 | 94 |
| 1905 Trigger Happy Trl | 0.00mi | 3/2.0 | 1,217 (+1%) | 6mo | $225,000 | $185 | 94 |
| 1906 Trigger Happy Trl | 0.00mi | 3/2.0 | 1,217 (+1%) | 6mo | $225,000 | $185 | 94 |
| 1900 Trigger Happy Trl | 0.00mi | 3/2.0 | 1,217 (+1%) | 6mo | $225,000 | $185 | 94 |
| 184 Showdown Rd | 0.00mi | 3/2.0 | 1,237 (+2%) | 6mo | $226,900 | $183 | 91 |
| 268 Showdown Rd | 0.00mi | 3/2.0 | 1,217 (+1%) | 13mo | $210,500 | $173 | 88 |
| 190 Showdown Rd | 0.00mi | 3/2.0 | 1,237 (+2%) | 10mo | $226,900 | $183 | 88 |
| 196 Showdown Rd | 0.00mi | 3/2.0 | 1,237 (+2%) | 10mo | $226,900 | $183 | 88 |
| 319 Showdown Rd | 0.00mi | 3/2.0 | 1,270 (+5%) | 9mo | $239,900 | $189 | 84 |
| 292 Tombstone Dr | 0.00mi | 3/2.0 | 1,143 (-6%) | 17mo | $199,900 | $175 | 77 |
| 103 Waterloo Dr | 0.00mi | 3/2.0 | 1,380 (+14%) | 19mo | $250,000 | $181 | 61 |
| 526 FM 1750 | 0.67mi | 2/2.5 (-1) | 1,336 (+10%) | 3mo | $480,000 | $359 | 42 |
Match score weights: distance 35% · size 25% · config 20% · recency 20%. Top-matched comps best support the ARV.
Projected returns pro-forma
-3.0% appreciation · 8.0% rent growth · sell at horizon
- IRR
- -9.4%
- Equity multiple
- 0.64×
- Total profit
- $-24,543
- Equity at exit
- $36,081
- IRR
- 6.1%
- Equity multiple
- 1.56×
- Total profit
- $37,862
- Equity at exit
- $20,923
Cash invested: $67,757 (down + closing). Projections, not guarantees.
Landlord ↔ Tenant lean methodology
- Overall (STATE)
- 87 Strongly Landlord-Friendly
- State Texas
- 87 Strongly Landlord-Friendly · R+5
- County
- — inherits STATE
- City
- — inherits STATE
ZIP-level market 79602
- Home prices YoY
- -19.6%
- Rents YoY
- 33.5%
- Active inventory
- 370
- Price-to-rent
- 8.7×
Monthly cashflow live
- Estimated rent
- $2,321 medium interval (Pro) →
- Mortgage (P&I)
- −$1,269
- Tax est. 1.5%
- −$302 /mo · $3,630/yr
- Insurance
- −$101
- Flood insurance flood zone
- −$125 /mo · $1,502/yr
- HOA
- −$0
- Vacancy / Maint / Mgmt
- −$487
- Net cashflow
- $36
Break-even live
UW: 25.0% down · 7.5% · 30yr · 1.5% tax · 5.0% vac · 8.0% maint · 8.0% mgmt
Financing live
Cash to close
- Down payment
- $60,498
- Closing costs
- $7,260
- Reserves months
- —
- Total cash needed
- —
Loan-product check · same deal, 3 products live
Conventional
25% down · 7.5% · 30yr
- Down + closing
- —
- Monthly P&I
- —
- Monthly cashflow
- —
- DSCR
- —
- Eligible?
- —
Personal DTI + credit; lowest rate.
DSCR
20% down · 8.5% · 30yr
- Down + closing
- —
- Monthly P&I
- —
- Monthly cashflow
- —
- DSCR
- —
- Eligible?
- —
No personal income docs; deal must DSCR.
Hard money
10% down · 12.0% · 12mo
- Down + closing
- —
- Monthly P&I
- —
- Monthly cashflow
- —
- DSCR
- —
- Eligible?
- —
Short-term bridge; refi at stabilization.
Listing history 5 events
-
2026-05-15status Pending
-
2026-05-07status Active
-
2026-04-23status Pending
-
2026-04-15price $241,990
-
2026-04-14$239,990 Active
ⓘ Source: listings_history table (triggers on properties + properties_extension) + one-shot
backfill from property_details.listing_events for pre-trigger history.
Climate risk First Street
- Flood 1/10 Low FEMA zone A · 0% chance over 30 yrs
- Wildfire 4/10 Moderate
- Heat 7/10 Severe 7 d/yr ≥103°F today · 24 d/yr by 30 yrs out
- Wind 4/10 Moderate 22% chance of damaging wind over 30 yrs
- Air quality 1/10 Low 0 unhealthy d/yr today · 0 by 30 yrs out
Nearby sold comps map
Loading sold comps map…
Walkable amenities ~0.75 mi
Loading nearby amenities…
Taxation est. · year 1
- Rental income
- $27,851
- − Mortgage interest
- −$13,555
- − Property taxes
- −$3,630
- − Insurance
- −$2,712
- − Repairs & maintenance
- −$2,228
- − Management
- −$2,228
- − Depreciation
- −$7,040
- Taxable loss
- −$3,542
- Est. tax savings @ 24.0%
- +$850
- After-tax cash flow
- $1,282/yr
For passive investors: Depreciation is non-cash, so a rental often shows a tax loss while cash-flowing — sheltering income. Rental losses are passive: they offset passive income freely, and up to $25,000/yr can offset ordinary (W-2) income if you actively participate and your MAGI is under $100k (phasing out to $0 by $150k); unused losses carry forward. On sale, claimed depreciation is recaptured at up to 25%, and gains may owe capital-gains tax (a 1031 exchange can defer both). Figures are a year-1 estimate at your 24.0% rate — not tax advice; consult a CPA.
Condition & rehab AI · 2 photos
This single-family home is in excellent condition with a modern kitchen and well-maintained exterior. It offers a good investment opportunity with potential for minor updates to enhance its curb appeal and functionality.
Value-add opportunities
- Both Painting the exterior and interior walls — Fresh paint can enhance curb appeal and interior aesthetics.
- Both Landscaping improvements — Enhanced landscaping can increase both resale and rental value.
- Both Adding smart home features — Smart home features can attract tech-savvy buyers and renters.
- Both Upgrading the kitchen appliances — Modern appliances can make the kitchen more functional and appealing to potential buyers and renters.
Renovation cost estimate screening
Value-add ROI direction
- Both Painting the exterior and interior walls — Fresh paint can enhance curb appeal and interior aesthetics. ↑
- Both Landscaping improvements — Enhanced landscaping can increase both resale and rental value. ↑
- Both Adding smart home features — Smart home features can attract tech-savvy buyers and renters. ↑
- Both Upgrading the kitchen appliances — Modern appliances can make the kitchen more functional and appealing to potential buyers and renters. ↑
ⓘ Cost ranges are severity-bucket heuristics (US national rule-of-thumb). Get contractor quotes + a written scope before underwriting a rehab budget.
Schools (NCES district)
- District
- Wylie ISD
- NCES district ID
- 4846500
- Math proficiency
- 63% ▼ -12.00%
- Reading proficiency
- 62% ▼ -4.00%
- Median HH income
- $78,248
- Composite
- 55.86/100
- National rank
- #1206
- State rank
- #32 of 826 in TX
Livability — Potosi
- Score
- 69/100
- State rank
- #398
- US rank
- #8264
Category grades
Schools grade is shown separately in the Schools card above.
Census & demographics
- Census place
- Potosi, TX
- County
- Taylor County · 136,672 people
- City population
- 26,588
- Metro
- Abilene, TX
- Population (ZIP)
- 27,425
- Household income
- $89,551
- Rent vs Own
- Severe rent burden
- 338.0
Population outlook (Taylor County) Hauer SSP2
- Today (2025)
- 145,270 people
- By 2030
- 150,050 · +3.3%
- By 2040
- 159,417 · +9.7%
- By 2050
- 168,883 · +16.3%
- By 2075
- 194,436 · +33.8%
- By 2100
- 203,163 · +39.9%
Race, ethnicity, and origin ACS 2023
- Neighborhood character
- Majority White (64%)
- Race & ethnicity
- White 64% Hispanic / Latino 22% Two or more races 12% Black 10% Asian 2%
- Hispanic origin (detail)
- Mexican 19%
- Common ancestry
- Romanian 2% Italian 2% Portuguese 2%
- Foreign-born
- 6% · Canada, Vietnam, Jamaica
- Languages at home
- 87% English-only · Spanish 9% Other Asian/Pacific 1% French/Haitian/Cajun 1%
Political lean MEDSL · Taylor
- 2024 margin
- Solid R (+49.8) · D 24.6% · R 74.4% · Other 1.0%
- 2008→2024 swing
- -4.2pp toward R · 2008: -45.6pp · 2024: -49.8pp
- All cycles
- 2024: R+49.8 2020: R+45.3 2016: R+51.1 2012: R+53.6 2008: R+45.6
Not yet ingested
- Civics
- —
Market trends
- HPI YoY
- ▼ -46.04%
- Current HPI
- 189.3098
- Rent YoY
- ▲ 33.46%
- Metro
- Abilene, TX
- State GDP YoY
- ▲ 3.95%
- F500 in state
- 110
Industry mix (Fortune 500 HQ in TX)
| Industry | F500 HQs | Revenue |
|---|---|---|
| Energy | 16 | $1,198B |
|
||
| Technology | 5 | $198B |
|
||
| Engineering / Construction | 4 | $72B |
|
||
| Energy Services | 3 | $60B |
|
||
| Utilities | 3 | $41B |
|
||
| Healthcare | 2 | $330B |
|
||
Price history
+0.8% since first listed5 events — show timeline
- 2026-05-15 Pending — NTREIS
- 2026-05-07 Relisted — NTREIS
- 2026-04-23 Pending — NTREIS
- 2026-04-15 Price Changed $241,990 NTREIS
- 2026-04-14 Listed $239,990 NTREIS
Cash-flow waterfall
monthlySold comps — $/sqft
last 12 mo · ≤1 miLoading sold comps…