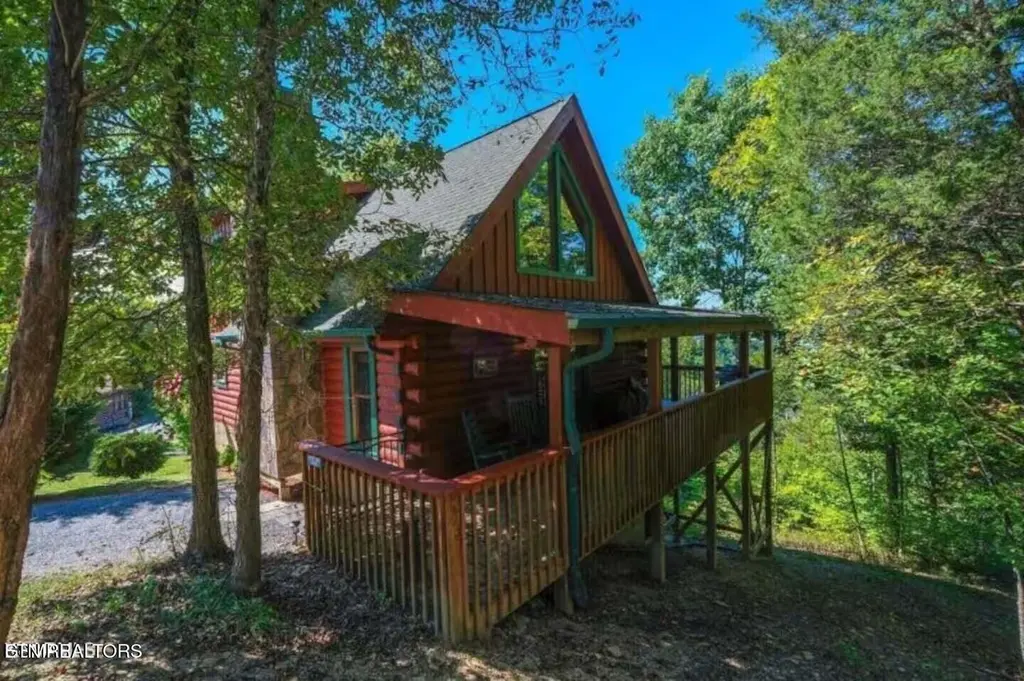
929 Buck Way · Fairgarden, TN
Flood risk 1/10 · Minimal
- FEMA flood zone
- X (unshaded)
- Chance of flooding over 30 yrs
- 0.0%
- Est. flood insurance / yr
- $507 – $1,088
Fire risk 3/10 · Minor
- Est. fire insurance / yr
- $949 – $1,763
Heat risk 5/10 · Moderate
- Hot days now (above 103°F)
- 7 days/yr
- Hot days in 30 yrs
- 20 days/yr
Wind risk 2/10 · Minimal
- Chance of severe wind over 30 yrs
- —
Air-quality risk 3/10 · Minor
- Unhealthy air days now
- 2 days/yr
- Unhealthy air days in 30 yrs
- 2 days/yr
Risk factors via First Street. Map © Google.
Why this score? — see what drove the C- grade
The composite is a weighted blend of 9 inputs, each scored 0–100. Each bar is that input's sub-score; the figure is the points it added to the 100-point composite (weight × sub-score).
- Cash flow +15.0/30.0
- Appreciation +10.0/10.0
- ARV discount +7.5/15.0
- 1% rule +5.0/10.0
- DSCR +5.0/10.0
- Livability +2.7/5.0
- Schools +2.5/10.0
- Condition / age +2.5/5.0
- Rent growth +1.9/5.0
$1
🖨 Deal sheet 📄 Offer letter ✓ Due diligence
Listing remarks
WAY BELOW MARKET VALUE!!!! Motivated seller!!!! Looking for the perfect investment or mountain getaway? Look no further! This stunning turnkey cabin in Douglas Lake Resort offers breathtaking views of Douglas Lake and the Smoky Mountains. With two spacious master suites (one on each floor), you'll love the upstairs Juliette balcony where you can unwind and take in the scenery. The open floor plan showcases soaring cathedral ceilings with gleaming tongue-and-groove wood, a cozy stacked stone fireplace with gas logs, and plenty of natural light. Recent updates include new mattresses, fresh exterior staining, , and a water treatment system--giving you peace of mind and comfort. Step outside to
Key facts
- 9,147 sq ft lot
- Built 2000
- Listed 16 days
Property features AI
Finance
- HOA & community: Homeowners association with a $500 quarterly fee (approx. $166.67/month)
Exterior
- Utilities: Private well water
- Home design: Log cabin; Single-family residence; Residential property
- Construction: Log construction
- Exterior features: Asphalt roof; Mountainous topography; Located in Douglas Chapel Estates subdivision
Interior
- Bathrooms: 2 full bathrooms
- Heating & cooling: Central heating; Central air conditioning
- Interior features: Wood-burning fireplace (2 total); 6 total rooms
Neighborhood map
What this means for you Summary
Snapshot
- This is a 2-bed/2.0-bath single-family listed at $1.
Deal economics
- At list price, monthly cash flow is $1k ($12k/yr) — positive.
- The deal already cash-flows at list — no discount required.
- Meets the 1% rule at list price ($2k rent vs $1).
- Cap rate 1226698.2% vs local median 1.9% in Fairgarden — top-decile yield for the area; either an underpriced asset or a hidden risk that comps aren't pricing in. Stress-test before assuming the spread holds.
Location & tenants
- Location reads 54/100 on livability (#381 in TN) — a working-class tenant base; expect higher turnover. Strengths: cost of living A+, housing A-; Watch: schools F, crime F, amenities F.
- Sevier County (rural): math 31% / reading 28% proficiency, ranked #62 of 139 in TN (top 45%) — low school quality limits family demand, transient renter base, plan for 1-2y turnover.
- Market conditions: Rents soft (-2.6%/yr); 1127 active listings in the ZIP; 1,594 units permitted in Sevier County in 2024 (456 in 5+ unit buildings).
- This rent runs 31% of the median local income ($58k/yr) — at the standard rent-burdened threshold; future hikes will face affordability resistance.
Forward outlook
- Sevier County population projected at +22% by 2050 — long-run rental-demand tailwind backs the buy-and-hold thesis.
- At projected returns (10.0% appreciation + 0.0% rent growth), your $0 cash investment doubles in ~1 year — after that, you're playing with house money.
Negotiation context
- It's been on market 17 days — a 2% lower offer ($0) is reasonable based on typical stale-listing flexibility.
- 8 sale attempts since 15y ago with the ask held roughly flat each time — persistent listings suggest the price (not the market) is what's stuck; bring a comps-based counter.
Risks & watch-outs
- Climate carrying-cost: extreme-heat days projected 7→20/yr by 2055 (HVAC capex compounding) — expect insurance premiums to compound above CPI over the hold.
Questions for the listing agent
- What does the HOA fee cover, when was the last increase, and are there any pending special assessments or reserve-fund shortfalls?
- Is there a deadline driving the sale (1031 exchange, divorce, estate, relocation)? That informs how much negotiation room exists.
- Schools are F-rated, which usually means shorter tenancies and higher turnover. Who's the typical renter profile here, and what's been the actual vacancy rate?
- Crime grade is F in this area — have there been break-ins, vandalism, or insurance claims at this property in the last 3 years? What carrier currently insures it and at what premium?
- What's the average days-on-market for RENTAL listings here right now (not sales)? A rising rental-DOM trend means longer vacancies and softer asking-rent achievability than the comps imply.
- What's the recent tenant-quality profile in this submarket — average credit score on applications, eviction rate, late-payment / NSF rate, and stable-employment percentage? A property-management company in the area should have these aggregated.
- How much new for-sale + rental construction is in the pipeline within 1–3 miles? Heavy new supply typically softens prices + rents 12–24 months out; constrained supply supports both.
Investment metrics
- 1% rule
- 150538.00% ✓
- Cap rate
- 1226698.24%
- Cash-on-cash
- 4381042.67%
- DSCR
- 194932.75
- GRM
- 0.0
CMA / ARV
- ARV (median comp)
- $437,966
- List price
- $1
- Delta
- 1.61%
- Verdict
- FAIR
- Comps
- 16 within 1.0 mi
Show comp detail 3 sales within ~0.75 mi
| Address | Dist | Beds/Ba | Sqft | Sold | Price | $/sf | Match |
|---|---|---|---|---|---|---|---|
| 1006 Gordon Way | 0.09mi | 2/2.0 | 1,008 (+1%) | 5mo | $367,500 | $365 | 90 |
| 933 Buck Way | 0.02mi | 2/2.0 | 1,008 (+1%) | 14mo | $399,900 | $397 | 85 |
| 2607 Windfall Estates Dr | 0.35mi | 1/1.0 (-1) | 1,000 (+0%) | 1mo | $150,000 | $150 | 74 |
Match score weights: distance 35% · size 25% · config 20% · recency 20%. Top-matched comps best support the ARV.
Projected returns pro-forma
10.0% appreciation · 0.0% rent growth · sell at horizon
- IRR
- —
- Equity multiple
- 217220.41×
- Total profit
- $60,821
- Equity at exit
- $1
- IRR
- —
- Equity multiple
- 429497.79×
- Total profit
- $120,259
- Equity at exit
- $2
Cash invested: $0 (down + closing). Projections, not guarantees.
Landlord ↔ Tenant lean methodology
- Overall (STATE)
- 87 Strongly Landlord-Friendly
- State Tennessee
- 87 Strongly Landlord-Friendly · R+13
- County
- — inherits STATE
- City
- — inherits STATE
ZIP-level market 37876
- Home prices YoY
- 2.4%
- Rents YoY
- -2.6%
- Active inventory
- 1127
Monthly cashflow live
- Estimated rent
- $1,505 medium interval (Pro) →
- Mortgage (P&I)
- −$0
- Tax est. 1.5%
- −$0 /mo · $0/yr
- Insurance
- −$0
- HOA
- −$167
- Vacancy / Maint / Mgmt
- −$316
- Net cashflow
- $1,022
Break-even live
UW: 25.0% down · 7.5% · 30yr · 1.5% tax · 5.0% vac · 8.0% maint · 8.0% mgmt
Financing live
Cash to close
- Down payment
- $0
- Closing costs
- $0
- Reserves months
- —
- Total cash needed
- —
Loan-product check · same deal, 3 products live
Conventional
25% down · 7.5% · 30yr
- Down + closing
- —
- Monthly P&I
- —
- Monthly cashflow
- —
- DSCR
- —
- Eligible?
- —
Personal DTI + credit; lowest rate.
DSCR
20% down · 8.5% · 30yr
- Down + closing
- —
- Monthly P&I
- —
- Monthly cashflow
- —
- DSCR
- —
- Eligible?
- —
No personal income docs; deal must DSCR.
Hard money
10% down · 12.0% · 12mo
- Down + closing
- —
- Monthly P&I
- —
- Monthly cashflow
- —
- DSCR
- —
- Eligible?
- —
Short-term bridge; refi at stabilization.
HOA detail
- Monthly dues
- $167 · $2,004/yr
- Likely covers
- watergas
Listing history 50 events
-
2026-06-19pricedays on market $1 Active 17 DOM
-
2026-06-18price $445,000 Active 16 DOM
-
2026-06-18price $1 Active 16 DOM
-
2026-06-18price $445,000 Active 16 DOM
-
2026-06-18price $1 Active 16 DOM
-
2026-06-18price $445,000 Active 16 DOM
-
2026-06-18price $1 Active 16 DOM
-
2026-06-18price $445,000 Active 16 DOM
-
2026-06-18pricedays on market $1 Active 16 DOM
-
2026-06-18price $445,000 Active 15 DOM
-
2026-06-18price $1 Active 15 DOM
-
2026-06-17price $445,000 Active 15 DOM
-
2026-06-17price $1 Active 15 DOM
-
2026-06-17price $445,000 Active 15 DOM
-
2026-06-17pricedays on market $1 Active 15 DOM
-
2026-06-17price $445,000 Active 14 DOM
-
2026-06-17price $1 Active 14 DOM
-
2026-06-16price $445,000 Active 14 DOM
-
2026-06-16pricedays on market $1 Active 14 DOM
-
2026-06-16price $445,000 Active 13 DOM
-
2026-06-15price $1 Active 13 DOM
-
2026-06-15price $445,000 Active 13 DOM
-
2026-06-15pricedays on market $1 Active 13 DOM
-
2026-06-14price $445,000 Active 11 DOM
-
2026-06-14pricedays on market $1 Active 11 DOM
-
2026-06-13price $445,000 Active 10 DOM
-
2026-06-13pricedays on market $1 Active 10 DOM
-
2026-06-12price $445,000 Active 8 DOM
-
2026-06-10pricedays on market $1 Active 8 DOM
-
2026-06-09price $445,000 Active 7 DOM
-
2026-06-09pricedays on market $1 Active 7 DOM
-
2026-06-09price $445,000 Active 6 DOM
-
2026-06-09price $1 Active 6 DOM
-
2026-06-08price $445,000 Active 6 DOM
-
2026-06-08pricedays on market $1 Active 6 DOM
-
2026-06-07price $445,000 Active 5 DOM
-
2026-06-07pricedays on market $1 Active 5 DOM
-
2026-04-22$445,000 Active 1316-char remark
-
2025-08-30$445,000 Active 1318-char remark
-
2025-08-06historical
-
2025-06-18$450,000 Active
-
2025-01-15historical
-
2024-08-19$599,999 Active
-
2022-04-18soldstatus $525,000
-
2022-04-12soldstatus $525,000
-
2022-04-08soldstatus $525,000 Closed
-
2022-04-08soldstatus $525,000
-
2022-03-09historical Pending - Continue to Show - Financing
-
2022-03-07$599,900 Active
-
2017-01-03soldstatus $142,000
ⓘ Source: listings_history table (triggers on properties + properties_extension) + one-shot
backfill from property_details.listing_events for pre-trigger history.
Climate risk First Street
- Flood 1/10 Low FEMA zone X (unshaded) · 0% chance over 30 yrs
- Wildfire 3/10 Moderate
- Heat 5/10 Major 7 d/yr ≥103°F today · 20 d/yr by 30 yrs out
- Wind 2/10 Low
- Air quality 3/10 Moderate 2 unhealthy d/yr today · 2 by 30 yrs out
Nearby sold comps map
Loading sold comps map…
Walkable amenities ~0.75 mi
Loading nearby amenities…
Taxation est. · year 1
- Rental income
- $18,065
- − Mortgage interest
- −$0
- − Property taxes
- −$0
- − Insurance
- −$0
- − Repairs & maintenance
- −$1,445
- − Management
- −$1,445
- − HOA
- −$2,004
- − Depreciation
- −$0
- Taxable income
- $13,170
- Est. tax owed @ 24.0%
- −$3,161
- After-tax cash flow
- $9,106/yr
For passive investors: Depreciation is non-cash, so a rental often shows a tax loss while cash-flowing — sheltering income. Rental losses are passive: they offset passive income freely, and up to $25,000/yr can offset ordinary (W-2) income if you actively participate and your MAGI is under $100k (phasing out to $0 by $150k); unused losses carry forward. On sale, claimed depreciation is recaptured at up to 25%, and gains may owe capital-gains tax (a 1031 exchange can defer both). Figures are a year-1 estimate at your 24.0% rate — not tax advice; consult a CPA.
Schools (NCES district)
- District
- Sevier County
- NCES district ID
- 4703780
- Math proficiency
- 31% ▼ -6.00%
- Reading proficiency
- 28% ▼ -4.00%
- Median HH income
- $42,730
- Composite
- 25.12/100
- National rank
- #7527
- State rank
- #62 of 139 in TN
Livability — Fairgarden
- Score
- 54/100
- State rank
- #381
- US rank
- #24205
Category grades
Schools grade is shown separately in the Schools card above.
Census & demographics
- County
- Sevier County · 80,402 people
- Metro
- Sevierville, TN
- Population (ZIP)
- 33,561
- Household income
- $58,277
- Rent vs Own
- Severe rent burden
- 611.0
Population outlook (Sevier County) Hauer SSP2
- Today (2025)
- 107,903 people
- By 2030
- 113,633 · +5.3%
- By 2040
- 123,969 · +14.9%
- By 2050
- 132,123 · +22.4%
- By 2075
- 148,524 · +37.6%
- By 2100
- 153,436 · +42.2%
Race, ethnicity, and origin ACS 2023
- Neighborhood character
- Predominantly White (89%)
- Race & ethnicity
- White 89% Hispanic / Latino 5% Two or more races 5% Black 1%
- Common ancestry
- Slovak 5% Serbian 4% Romanian 2%
- Foreign-born
- 3% · Canada
- Languages at home
- 95% English-only · Spanish 3% Russian/Polish/Slavic 1%
Political lean MEDSL · Sevier
- 2024 margin
- Solid R (+61.1) · D 18.9% · R 80.1% · Other 1.0%
- 2008→2024 swing
- -13.1pp toward R · 2008: -48.1pp · 2024: -61.1pp
- All cycles
- 2024: R+61.1 2020: R+57.6 2016: R+61.7 2012: R+54.8 2008: R+48.1
Not yet ingested
- Civics
- —
Market trends
- HPI YoY
- ▲ 11.06%
- Current HPI
- 477.19
- Rent YoY
- ▼ -2.57%
- Metro
- Sevierville, TN
- State GDP YoY
- ▲ 2.78%
- F500 in state
- 22
Industry mix (Fortune 500 HQ in TN)
| Industry | F500 HQs | Revenue |
|---|---|---|
| Healthcare | 3 | $91B |
|
||
| Retail | 3 | $72B |
|
||
| Transportation / Logistics | 1 | $88B |
|
||
| Paper / Packaging | 1 | $19B |
|
||
| Insurance | 1 | $13B |
|
||
| Energy | 1 | $12B |
|
||
Price history
+488.6% since first listed20 events — show timeline
- 2026-06-02 Listed $1 TVRMLS
- 2026-05-28 Listing Removed — Knoxville MLS
- 2026-04-22 Listed $445,000 Knoxville MLS
- 2025-08-06 Listing Removed — Knoxville MLS
- 2025-06-18 Listed $450,000 Knoxville MLS
- 2025-01-15 Listing Removed — Knoxville MLS
- 2024-08-19 Listed $599,999 Knoxville MLS
- 2022-04-18 Sold (Public Records) $525,000 Public Records
- 2022-04-12 Sold (MLS) $525,000 GSMAR
- 2022-04-08 Sold (MLS) $525,000 REALTRACS as Distributed by MLS Grid
- 2022-04-08 Sold (MLS) $525,000 Knoxville MLS
- 2022-03-09 Contingent — Knoxville MLS
- 2022-03-07 Listed $599,900 Knoxville MLS
- 2017-01-03 Sold (Public Records) $142,000 Public Records
- 2017-01-03 Sold (MLS) $142,000 GSMAR
- 2012-03-29 Sold (MLS) $76,500 Knoxville MLS
- 2011-12-21 Sold (MLS) $76,500 GSMAR
- 2011-11-01 Listed $70,500 Knoxville MLS
- 2011-09-01 Listed $70,500 Knoxville MLS
- 2011-09-01 Listed $75,600 GSMAR
Property tax history
+4.4%/yrLatest (2025): $636 · +0.0% YoY. Source: county tax records.
Cash-flow waterfall
monthlySold comps — $/sqft
last 12 mo · ≤1 miLoading sold comps…