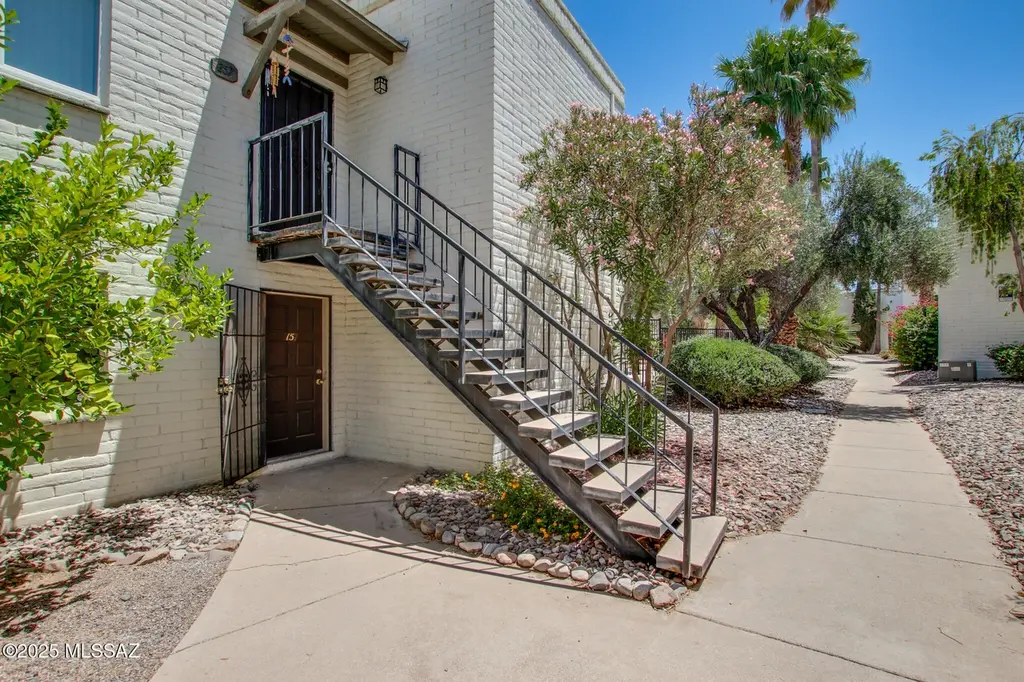
8450 E Old Spanish Trl #157 · Tucson, AZ
Flood risk 1/10 · Minimal
- FEMA flood zone
- X (unshaded)
- Chance of flooding over 30 yrs
- 0.0%
- Est. flood insurance / yr
- $507 – $1,088
Fire risk 1/10 · Minimal
- Est. fire insurance / yr
- $610 – $1,132
Heat risk 7/10 · Major
- Hot days now (above 105°F)
- 5 days/yr
- Hot days in 30 yrs
- 13 days/yr
Wind risk 1/10 · Minimal
- Chance of severe wind over 30 yrs
- —
Air-quality risk 1/10 · Minimal
- Unhealthy air days now
- 0 days/yr
- Unhealthy air days in 30 yrs
- 0 days/yr
Risk factors via First Street. Map © Google.
Why this score? — see what drove the F grade
The composite is a weighted blend of 9 inputs, each scored 0–100. Each bar is that input's sub-score; the figure is the points it added to the 100-point composite (weight × sub-score).
- ARV discount +9.2/15.0
- Cash flow +6.9/30.0
- Condition / age +4.0/5.0
- 1% rule +3.7/10.0
- Livability +3.7/5.0
- Rent growth +2.9/5.0
- Schools +1.6/10.0
- DSCR +1.1/10.0
- Appreciation +0.0/10.0
$112,500
🖨 Deal sheet 📄 Offer letter ✓ Due diligence
Listing remarks MLS
This newly renovated first-floor condo is ready for easy move-in! Enjoy an open concept living space with new flooring throughout, new cabinets and countertops in the kitchen and bathroom, and a brand-new AC installed in 2025! Relax outside with easy access to the beautiful, HOA-maintained pool. Two on-site laundry facilities are also available.
Key facts
- New flooring
- New cabinets
- Hoa maintained pool
Tags
Neighborhood map
What this means for you Summary
Snapshot
- This is a 1-bed/1.0-bath condo listed at $112k. Condition is rated good.
Deal economics
- At list price, monthly cash flow is $-170 ($-2k/yr) — negative.
- To cash-flow at today's rent, offer at most $111k (1.0% below list).
- To meet the 1% rule (rent ≥ 1% of price), the offer needs to be $97k (13.4% below list).
- Recommended offer: $97k (13.4% below list) — sets the bar for 1% rule.
- Cap rate 4.5% vs local median 3.7% in Tucson — meaningfully above typical; check what's discounted (condition, days-on-market, listing class) to confirm the premium yield is real.
Location & tenants
- Location reads 74/100 on livability (#17 in AZ, #4,502 nationally) — a middle-class / working-renter tenant base. Strengths: commute A+, cost of living A+, housing A+; Watch: health & safety C-, schools D+, crime F.
- Tucson Unified District (4403) (urban): math 14% / reading 23% proficiency, ranked #190 of 249 in AZ (top 76%) — low school quality limits family demand, transient renter base, plan for 1-2y turnover.
- Market conditions: Rents rising (+1.6%/yr); 210 active listings in the ZIP; 40 comparable units currently listed for rent nearby; rentals leasing fast (median 12d on market — plan ~1-2 weeks tenant-placement turnaround); 5,268 units permitted in Pima County in 2024 (996 in 5+ unit buildings).
Forward outlook
- Local home prices are declining (-3.0%/yr); year-one equity from $778 of loan paydown is wiped out by about $3k of value loss. Plan a longer hold.
- Pima County population projected at +8% by 2050 — modest demand growth; plan on rents tracking national, not racing it.
Negotiation context
- It's been on market 73 days — a 6% lower offer ($106k) is reasonable based on typical stale-listing flexibility.
Risks & watch-outs
- Climate carrying-cost: extreme-heat days projected 5→13/yr by 2055 (HVAC capex compounding) — expect insurance premiums to compound above CPI over the hold.
Questions for the listing agent
- What do current leases actually rent for vs. the listed asking? Can we see a recent rent roll and the last 12 months of T-12 income?
- It's been on market 73 days. Have you received any prior offers? Is the seller open to a 13% concession, seller financing, or rate buy-down credit?
- Built in 1974 — when were the roof, HVAC, electrical panel, plumbing, and water heater last replaced?
- What does the HOA fee cover, when was the last increase, and are there any pending special assessments or reserve-fund shortfalls?
- Any open or pending special assessments — roof, HVAC, plumbing, elevator, façade? What's the per-unit balance and payoff schedule, and is the seller paying it off at close or rolling it to the buyer?
- Why hasn't it sold? Are there any deal-killer items the seller is aware of (foundation, flood, title, zoning, code violations)?
- Is there a deadline driving the sale (1031 exchange, divorce, estate, relocation)? That informs how much negotiation room exists.
- Schools are D-rated, which usually means shorter tenancies and higher turnover. Who's the typical renter profile here, and what's been the actual vacancy rate?
- Crime grade is F in this area — have there been break-ins, vandalism, or insurance claims at this property in the last 3 years? What carrier currently insures it and at what premium?
- The area grade is low — what's the realistic commute time and amenity access for the typical tenant pool here? Any planned neighborhood developments (good or bad) we should know about?
- What's the average days-on-market for RENTAL listings here right now (not sales)? A rising rental-DOM trend means longer vacancies and softer asking-rent achievability than the comps imply.
- What's the recent tenant-quality profile in this submarket — average credit score on applications, eviction rate, late-payment / NSF rate, and stable-employment percentage? A property-management company in the area should have these aggregated.
- How much new apartment / multifamily construction is in the pipeline within 1–3 miles? Heavy new supply (>2% of stock underway) typically softens rents 12–24 months out; light construction supports rent growth.
Investment metrics
- 1% rule
- 0.87% ✗
- Cap rate
- 4.48%
- Cash-on-cash
- -6.48%
- DSCR
- 0.71
- GRM
- 9.6
CMA / ARV
- ARV (median comp)
- $116,991
- List price
- $112,500
- Delta
- -3.84%
- Verdict
- FAIR
- Comps
- 20 within 1.0 mi
Projected returns pro-forma
-3.0% appreciation · 1.61% rent growth · sell at horizon
- IRR
- -29.3%
- Equity multiple
- 0.04×
- Total profit
- $-30,296
- Equity at exit
- $16,774
- IRR
- -38.1%
- Equity multiple
- -0.44×
- Total profit
- $-45,232
- Equity at exit
- $9,727
Cash invested: $31,500 (down + closing). Projections, not guarantees.
Landlord ↔ Tenant lean methodology
- Overall (STATE)
- 87 Strongly Landlord-Friendly
- State Arizona
- 87 Strongly Landlord-Friendly · R+3
- County
- — inherits STATE
- City
- — inherits STATE
ZIP-level market 85710
- Rents YoY
- 1.6%
- Active inventory
- 210
- Price-to-rent
- 9.6×
Monthly cashflow live
- Estimated rent
- $974 high interval (Pro) →
- Mortgage (P&I)
- −$590
- Tax est. 1.5%
- −$141 /mo · $1,688/yr
- Insurance
- −$47
- HOA est. from 1 same-building comp
- −$162
- Vacancy / Maint / Mgmt
- −$205
- Net cashflow
- $-170
Break-even live
UW: 25.0% down · 7.5% · 30yr · 1.5% tax · 5.0% vac · 8.0% maint · 8.0% mgmt
Financing live
Cash to close
- Down payment
- $28,125
- Closing costs
- $3,375
- Reserves months
- —
- Total cash needed
- —
Loan-product check · same deal, 3 products live
Conventional
25% down · 7.5% · 30yr
- Down + closing
- —
- Monthly P&I
- —
- Monthly cashflow
- —
- DSCR
- —
- Eligible?
- —
Personal DTI + credit; lowest rate.
DSCR
20% down · 8.5% · 30yr
- Down + closing
- —
- Monthly P&I
- —
- Monthly cashflow
- —
- DSCR
- —
- Eligible?
- —
No personal income docs; deal must DSCR.
Hard money
10% down · 12.0% · 12mo
- Down + closing
- —
- Monthly P&I
- —
- Monthly cashflow
- —
- DSCR
- —
- Eligible?
- —
Short-term bridge; refi at stabilization.
Rent comps 40 comps
| Address | Beds | Baths | Sqft | Rent | $/sqft | DOM | Units | Dist |
|---|---|---|---|---|---|---|---|---|
| 8450 E Old Spanish Trl Unit 258 Tucson, AZ | 1.0 | 1.0 | 768 | $900 | $1.17 | 24d | 1 | 0.03mi |
| 8490 E Old Spanish Trl Tucson, AZ | 1.0 | 1.0 | 600 | $898 | $1.50 | 2d | 3 | 0.12mi |
| 8550 E Old Spanish Trl Tucson, AZ | 2.0 | 2.0 | 918 | $1,143 | $1.25 | 3d | 1 | 0.19mi |
| 8550 E Old Spanish Trl Tucson, AZ | 1.0 | 1.0 | 643 | $995 | $1.55 | 24d | 1 | 0.19mi |
| 8601 E Old Spanish Trl Tucson, AZ | 1.0–2.0 | 1.0–2.0 | 771 | $904 | $1.17 | 3d | 20 | 0.22mi |
| 8580 E Old Spanish Trl Tucson, AZ | 2.0 | 2.0 | 918 | $1,195 | $1.30 | 24d | 1 | 0.24mi |
| 8477 E Broadway Blvd Tucson, AZ | 1.0–2.0 | 1.0 | 675 | $649 | $0.96 | 3d | 11 | 0.24mi |
| 8600 E Old Spanish Trl Tucson, AZ | 1.0–3.0 | 1.0–2.0 | 891 | $1,021 | $1.15 | 2d | 20 | 0.29mi |
| 201 S Camino Seco Tucson, AZ | 1.0 | 1.0 | 740 | $975 | $1.32 | 3d | 1 | 0.40mi |
| 201 S Camino Seco Tucson, AZ | 1.0 | 1.0 | 740 | $875 | $1.18 | 44d | 1 | 0.40mi |
| 8750 E Cooper St Tucson, AZ | 1.0 | 1.0 | 750 | $750 | $1.00 | 44d | 1 | 0.42mi |
| 8750 E Cooper St Unit COP8750-102 Tucson, AZ | 1.0 | 1.0 | 750 | $750 | $1.00 | 12d | 1 | 0.42mi |
| 8750 E Cooper St Unit COP8750-118 Tucson, AZ | 1.0 | 1.0 | 650 | $750 | $1.15 | 20d | 1 | 0.42mi |
| 550 S Camino Seco Tucson, AZ | 2.0 | 1.0–2.0 | 850 | $1,006 | $1.18 | 2d | 11 | 0.45mi |
| 207 N Maguire Ave Tucson, AZ | 1.0–2.0 | 1.0–2.0 | 782 | $1,007 | $1.29 | 2d | 12 | 0.53mi |
| 8880 E Broadway Blvd Tucson, AZ | 1.0–2.0 | 1.0–1.5 | 637 | $750 | $1.18 | 3d | 23 | 0.59mi |
| 7887 E Uhl St Tucson, AZ | 2.0 | 2.0 | 900 | $1,149 | $1.28 | 12d | 1 | 0.68mi |
| 7887 E Uhl St Tucson, AZ | 1.0 | 1.0 | 650 | $1,125 | $1.73 | 44d | 1 | 0.68mi |
| 200 S Pantano Rd Tucson, AZ | 1.0–2.0 | 1.0–2.0 | 774 | $890 | $1.15 | 2d | 8 | 0.71mi |
| 8535 E Seabury Ct Unit 1 Tucson, AZ | 2.0 | 2.0 | 966 | $1,400 | $1.45 | 14d | 1 | 0.77mi |
| 7730 E Broadway Blvd Tucson, AZ | 2.0 | 1.0–2.0 | 666 | $1,020 | $1.53 | 2d | 45 | 0.81mi |
| 550 N Pantano Rd Tucson, AZ | 1.0–2.0 | 1.0 | 667 | $807 | $1.21 | 2d | 17 | 0.81mi |
| 9009 E Broadway Blvd Tucson, AZ | 2.0 | 1.0–2.0 | 1122 | $1,432 | $1.28 | 2d | 4 | 0.82mi |
| 8485 E 22nd St Tucson, AZ | 1.0–2.0 | 1.0–2.0 | 696 | $895 | $1.29 | 2d | 21 | 0.83mi |
| 600 N Pantano Rd Tucson, AZ | 2.0 | 1.0 | 759 | $1,073 | $1.41 | 21d | 1 | 0.87mi |
| 600 N Pantano Rd Tucson, AZ | 2.0 | 1.0 | 759 | $1,130 | $1.49 | 24d | 1 | 0.87mi |
| 716 N Hayden Dr Tucson, AZ | 2.0 | 2.0 | 1115 | $1,495 | $1.34 | 3d | 1 | 0.88mi |
| 7924 E Colette Cir #83 Tucson, AZ | 2.0 | 2.0 | 995 | $1,400 | $1.41 | 2d | 1 | 0.89mi |
| 7944 E Colette Cir Tucson, AZ | 2.0 | 1.0 | 854 | $995 | $1.17 | 24d | 1 | 0.97mi |
| 7952 E Colette Cir Unit 164 Tucson, AZ | 1.0 | 1.0 | 955 | $1,400 | $1.47 | 44d | 1 | 0.98mi |
| 9159 E Broadway Blvd Tucson, AZ | 2.0 | 2.0 | 1052 | $1,645 | $1.56 | 3d | 1 | 1.00mi |
| 8550 E Speedway Blvd Unit TBD Tucson, AZ | 2.0 | 1.0 | 624 | $624 | $1.00 | 44d | 1 | 1.02mi |
| 8550 E Speedway Blvd Tucson, AZ | 2.0 | 2.0 | 864 | $1,099 | $1.27 | 44d | 1 | 1.08mi |
| 8110 E Speedway Blvd Tucson, AZ | 1.0–2.0 | 1.0–2.0 | 694 | $645 | $0.93 | 2d | 17 | 1.11mi |
| 1050 N Camino Seco Tucson, AZ | 1.0–2.0 | 1.0 | 620 | $860 | $1.39 | 2d | 6 | 1.12mi |
| 7531 E Terrace Dr Tucson, AZ | 2.0 | 2.0 | 1032 | $1,200 | $1.16 | 14d | 1 | 1.16mi |
| 9190 E Old Spanish Trl Tucson, AZ | 2.0 | 2.0 | 1097 | $1,738 | $1.58 | 21d | 1 | 1.17mi |
| 801 S Prudence Rd Tucson, AZ | 2.0 | 1.0–2.0 | 581 | $957 | $1.65 | 3d | 32 | 1.17mi |
| 625 S Prudence Rd Tucson, AZ | 2.0 | 2.0 | 1049 | $1,424 | $1.36 | 17d | 2 | 1.17mi |
| 8080 E Speedway Blvd Unit 1 Tucson, AZ | 1.0 | 1.0 | 660 | $875 | $1.33 | 44d | 1 | 1.19mi |
HOA detail condo
- Monthly dues
- $0 · $0/yr
- Likely covers
- pool
- Assessments
- None detected in remarks — confirm with the listing agent.
Listing history 15 events
-
2026-06-18days on market $112,500 Active 73 DOM
-
2026-06-17days on market $112,500 Active 72 DOM
-
2026-06-16days on market $112,500 Active 71 DOM
-
2026-06-15days on market $112,500 Active 70 DOM
-
2026-06-13days on market $112,500 Active 68 DOM
-
2026-06-10days on market $112,500 Active 65 DOM
-
2026-06-09days on market $112,500 Active 64 DOM
-
2026-06-08days on market $112,500 Active 63 DOM
-
2026-06-07days on market $112,500 Active 62 DOM
-
2026-06-05days on market $112,500 Active 59 DOM
-
2026-06-03days on market $112,500 Active 58 DOM
-
2026-06-02days on market $112,500 Active 57 DOM
-
2026-06-01days on market $112,500 Active 56 DOM
-
2026-05-31days on market $112,500 Active 55 DOM
-
2026-04-06$112,500 Active 350-char remark
Show marketing remark (350 chars)
This newly renovated first-floor condo is ready for easy move-in! Enjoy an open concept living space with new flooring throughout, new cabinets and countertops in the kitchen and bathroom, and a brand-new AC installed in 2025! Relax outside with easy access to the beautiful, HOA-maintained pool. Two on-site laundry facilities are also available.
ⓘ Source: listings_history table (triggers on properties + properties_extension) + one-shot
backfill from property_details.listing_events for pre-trigger history.
Climate risk First Street
- Flood 1/10 Low FEMA zone X (unshaded) · 0% chance over 30 yrs
- Wildfire 1/10 Low
- Heat 7/10 Severe 5 d/yr ≥105°F today · 13 d/yr by 30 yrs out
- Wind 1/10 Low
- Air quality 1/10 Low 0 unhealthy d/yr today · 0 by 30 yrs out
Nearby sold comps map
Loading sold comps map…
Walkable amenities ~0.75 mi
Loading nearby amenities…
Taxation est. · year 1
- Rental income
- $11,686
- − Mortgage interest
- −$6,302
- − Property taxes
- −$1,688
- − Insurance
- −$562
- − Repairs & maintenance
- −$935
- − Management
- −$935
- − HOA
- −$1,944
- − Depreciation
- −$3,273
- Taxable loss
- −$3,952
- Est. tax savings @ 24.0%
- +$949
- After-tax cash flow
- $-1,093/yr
For passive investors: Depreciation is non-cash, so a rental often shows a tax loss while cash-flowing — sheltering income. Rental losses are passive: they offset passive income freely, and up to $25,000/yr can offset ordinary (W-2) income if you actively participate and your MAGI is under $100k (phasing out to $0 by $150k); unused losses carry forward. On sale, claimed depreciation is recaptured at up to 25%, and gains may owe capital-gains tax (a 1031 exchange can defer both). Figures are a year-1 estimate at your 24.0% rate — not tax advice; consult a CPA.
Condition & rehab AI · 12 photos
This newly renovated first-floor condo is move-in ready with new flooring, cabinets, countertops, and a new AC. Enhance curb appeal and add value with landscaping and painting.
Value-add opportunities
- Both landscaping — enhances curb appeal and adds value
- Both painting — refreshes the interior and exterior
- Both new flooring — improves aesthetics and durability
Renovation cost estimate screening
Value-add ROI direction
- Both landscaping — enhances curb appeal and adds value ↑
- Both painting — refreshes the interior and exterior ↑
- Both new flooring — improves aesthetics and durability ↑
ⓘ Cost ranges are severity-bucket heuristics (US national rule-of-thumb). Get contractor quotes + a written scope before underwriting a rehab budget.
Schools (NCES district)
- District
- Tucson Unified District (4403)
- NCES district ID
- 0408800
- Math proficiency
- 14% ▼ -17.00%
- Reading proficiency
- 23% ▼ -11.00%
- Median HH income
- $40,962
- Composite
- 15.78/100
- National rank
- #9270
- State rank
- #190 of 249 in AZ
Livability — Tucson
- Score
- 74/100
- State rank
- #17
- US rank
- #4502
Category grades
Schools grade is shown separately in the Schools card above.
Census & demographics
- Census place
- Tucson, AZ
- County
- Pima County · 1,012,107 people
- City population
- 839,336
- Metro
- Tucson, AZ
- Population (ZIP)
- 56,125
- Household income
- $57,175
- Rent vs Own
- Severe rent burden
- 3888.0
Population outlook (Pima County) Hauer SSP2
- Today (2025)
- 1,066,056 people
- By 2030
- 1,086,684 · +1.9%
- By 2040
- 1,117,160 · +4.8%
- By 2050
- 1,149,778 · +7.9%
- By 2075
- 1,271,480 · +19.3%
- By 2100
- 1,321,160 · +23.9%
Race, ethnicity, and origin ACS 2023
- Neighborhood character
- Diverse neighborhood (Simpson 0.56)
- Race & ethnicity
- White 62% Hispanic / Latino 25% Two or more races 13% Black 5% Asian 2% Native American 1%
- Hispanic origin (detail)
- Mexican 22%
- Common ancestry
- Lithuanian 3% Romanian 2% Italian 2%
- Foreign-born
- 9% · Canada, South Korea
- Languages at home
- 83% English-only · Spanish 11% Arabic 1% Other Indo-European 1%
Political lean MEDSL · Pima
- 2024 margin
- D (+15.2) · D 57.0% · R 41.8% · Other 1.2%
- 2008→2024 swing
- +9.1pp toward D · 2008: 6.1pp · 2024: 15.2pp
- All cycles
- 2024: D+15.2 2020: D+18.7 2016: D+13.5 2012: D+5.8 2008: D+6.1
Not yet ingested
- Civics
- —
Market trends
- HPI YoY
- ▼ -287.68%
- Current HPI
- 291.8039
- Rent YoY
- ▲ 1.61%
- Metro
- Tucson, AZ
- State GDP YoY
- ▲ 4.54%
- F500 in state
- 20
Industry mix (Fortune 500 HQ in AZ)
| Industry | F500 HQs | Revenue |
|---|---|---|
| Technology | 2 | $13B |
|
||
| Mining / Metals | 1 | $23B |
|
||
| Environmental Services | 1 | $16B |
|
||
| Metals / Steel | 1 | $14B |
|
||
| Technology Distribution | 1 | $9B |
|
||
| Homebuilding | 1 | $8B |
|
||
Price history
1 event — show timeline
- 2026-04-06 Listed $112,500 MLSSAZ
Cash-flow waterfall
monthlySold comps — $/sqft
last 12 mo · ≤1 miLoading sold comps…