25 Fleming Pl · Buckhead, GA
Flood risk 1/10 · Minimal
- FEMA flood zone
- X (unshaded)
- Chance of flooding over 30 yrs
- 0.0%
- Est. flood insurance / yr
- $507 – $1,088
Fire risk 3/10 · Minor
- Est. fire insurance / yr
- $963 – $1,789
Heat risk 10/10 · Severe
- Hot days now (above 106°F)
- 7 days/yr
- Hot days in 30 yrs
- 19 days/yr
Wind risk 9/10 · Severe
- Chance of severe wind over 30 yrs
- 99.0%
Air-quality risk 2/10 · Minimal
- Unhealthy air days now
- 2 days/yr
- Unhealthy air days in 30 yrs
- 2 days/yr
Risk factors via First Street. Map © Google.
Why this score? — see what drove the C grade
The composite is a weighted blend of 9 inputs, each scored 0–100. Each bar is that input's sub-score; the figure is the points it added to the 100-point composite (weight × sub-score).
- Cash flow +25.0/30.0
- DSCR +8.2/10.0
- ARV discount +7.5/15.0
- 1% rule +5.6/10.0
- Schools +4.5/10.0
- Livability +3.1/5.0
- Rent growth +3.0/5.0
- Condition / age +2.5/5.0
- Appreciation +0.0/10.0
$249,900
🖨 Deal sheet 📄 Offer letter ✓ Due diligence
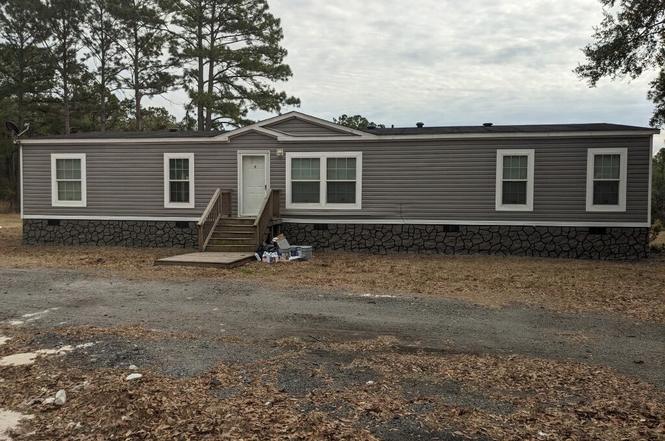
Listing remarks
Stunning 4 bedroom 2 bath 2021 Live Oak doublewide with masonry skirting. This lovely home has an eat in kitchen, great room, primary bedroom and bathroom and spacious bedrooms. Updated and renovated like new. The house has trey ceilings, 42" grand decor cabinets, and kitchen island. Home overlooks a beautiful small lake. The small portion of the lake goes with this property. There is approximately 1.78 acres of land. Great location and conveniently located to everything. Come see this move in ready home. Private financing available to qualified buyers.
Key facts
- 1.78 acres of land
- Eat in kitchen
- Great room
Tags
Neighborhood map
What this means for you Summary
Snapshot
- This is a 4-bed/2.0-bath manufactured listed at $250k.
Deal economics
- At list price, monthly cash flow is $547 ($7k/yr) — positive.
- The deal already cash-flows at list — no discount required.
- Meets the 1% rule at list price ($3k rent vs $250k).
- Recommended offer: $242k (3.0% below list) — sets the bar for market timing.
- Cap rate 8.9% vs local median 3.3% in Buckhead — top-decile yield for the area; either an underpriced asset or a hidden risk that comps aren't pricing in. Stress-test before assuming the spread holds.
Location & tenants
- Location reads 61/100 on livability (#334 in GA) — a middle-class / working-renter tenant base. Strengths: crime A+, employment A+, housing A+; Watch: schools F, amenities F, commute F.
- Bryan County (rural): math 49% / reading 53% proficiency, ranked #14 of 174 in GA (top 8%) — acceptable for families but not a draw, mixed tenant base, ~2y average lease.
- Market conditions: Rents rising (+2.2%/yr); 482 active listings in the ZIP; high-income renter base; 510 units permitted in Bryan County in 2024 (68 in 5+ unit buildings).
Forward outlook
- Local home prices are declining (-3.0%/yr); year-one equity from $2k of loan paydown is wiped out by about $7k of value loss. Plan a longer hold.
- Bryan County population projected at +64% by 2050 — long-run rental-demand tailwind backs the buy-and-hold thesis.
Negotiation context
- It's been on market 55 days — a 3% lower offer ($242k) is reasonable based on typical stale-listing flexibility.
- 2 sale attempts; this cycle's ask has dropped $20k (7%) from the opening price — seller is motivated, your offer sets the floor, not the list.
- Current owner paid $60k; list at $250k implies a 316% gain — meaningful room to come down on a strong offer.
Risks & watch-outs
- Climate carrying-cost: severe wind risk, 99% chance of damaging wind over 30y; extreme-heat days projected 7→19/yr by 2055 (HVAC capex compounding) — expect insurance premiums to compound above CPI over the hold.
Questions for the listing agent
- It's been on market 55 days. Have you received any prior offers? Is the seller open to a 3% concession, seller financing, or rate buy-down credit?
- Is there a deadline driving the sale (1031 exchange, divorce, estate, relocation)? That informs how much negotiation room exists.
- Schools are F-rated, which usually means shorter tenancies and higher turnover. Who's the typical renter profile here, and what's been the actual vacancy rate?
- What's the average days-on-market for RENTAL listings here right now (not sales)? A rising rental-DOM trend means longer vacancies and softer asking-rent achievability than the comps imply.
- What's the recent tenant-quality profile in this submarket — average credit score on applications, eviction rate, late-payment / NSF rate, and stable-employment percentage? A property-management company in the area should have these aggregated.
- How much new for-sale + rental construction is in the pipeline within 1–3 miles? Heavy new supply typically softens prices + rents 12–24 months out; constrained supply supports both.
Investment metrics
- 1% rule
- 1.06% ✓
- Cap rate
- 8.92%
- Cash-on-cash
- 9.38%
- DSCR
- 1.42
- GRM
- 7.8
CMA / ARV
No comps found within radius.
Projected returns pro-forma
-3.0% appreciation · 2.17% rent growth · sell at horizon
- IRR
- -3.0%
- Equity multiple
- 0.89×
- Total profit
- $-7,918
- Equity at exit
- $37,261
- IRR
- 5.8%
- Equity multiple
- 1.41×
- Total profit
- $28,815
- Equity at exit
- $21,607
Cash invested: $69,972 (down + closing). Projections, not guarantees.
Landlord ↔ Tenant lean methodology
- Overall (STATE)
- 90 Strongly Landlord-Friendly
- State Georgia
- 90 Strongly Landlord-Friendly · R+3
- County
- — inherits STATE
- City
- — inherits STATE
ZIP-level market 31324
- Home prices YoY
- -30.8%
- Rents YoY
- 2.2%
- Active inventory
- 482
- Price-to-rent
- 7.8×
Monthly cashflow live
- Estimated rent
- $2,661 medium interval (Pro) →
- Mortgage (P&I)
- −$1,311
- Tax from tax record
- −$140 /mo · $1,682/yr
- Insurance
- −$104
- HOA
- −$0
- Vacancy / Maint / Mgmt
- −$559
- Net cashflow
- $547
Break-even live
UW: 25.0% down · 7.5% · 30yr · 1.5% tax · 5.0% vac · 8.0% maint · 8.0% mgmt
Financing live
Cash to close
- Down payment
- $62,475
- Closing costs
- $7,497
- Reserves months
- —
- Total cash needed
- —
Loan-product check · same deal, 3 products live
Conventional
25% down · 7.5% · 30yr
- Down + closing
- —
- Monthly P&I
- —
- Monthly cashflow
- —
- DSCR
- —
- Eligible?
- —
Personal DTI + credit; lowest rate.
DSCR
20% down · 8.5% · 30yr
- Down + closing
- —
- Monthly P&I
- —
- Monthly cashflow
- —
- DSCR
- —
- Eligible?
- —
No personal income docs; deal must DSCR.
Hard money
10% down · 12.0% · 12mo
- Down + closing
- —
- Monthly P&I
- —
- Monthly cashflow
- —
- DSCR
- —
- Eligible?
- —
Short-term bridge; refi at stabilization.
Listing history 7 events
-
2026-03-20status Under Contract
-
2026-03-12status Back On Market
-
2026-03-07historical Active Under Contract
-
2026-02-09price $249,900
-
2026-02-05price $259,900
-
2026-01-23$269,900 New
-
2021-02-11soldstatus $60,000
ⓘ Source: listings_history table (triggers on properties + properties_extension) + one-shot
backfill from property_details.listing_events for pre-trigger history.
Tax reassessment forecast GA · Resets to sale price
- Current annual tax
- $1,682 · $140/mo
- Projected year-2 tax
- $2,299 · $192/mo
- Expected delta
- +$617/yr (+$51/mo · 36.7%)
ⓘ Screening estimate from a state-policy table — verify with the county assessor before closing.
Climate risk First Street
- Flood 1/10 Low FEMA zone X (unshaded) · 0% chance over 30 yrs
- Wildfire 3/10 Moderate
- Heat 10/10 Extreme 7 d/yr ≥106°F today · 19 d/yr by 30 yrs out
- Wind 9/10 Extreme 99% chance of damaging wind over 30 yrs
- Air quality 2/10 Low 2 unhealthy d/yr today · 2 by 30 yrs out
Nearby sold comps map
Loading sold comps map…
Walkable amenities ~0.75 mi
Loading nearby amenities…
Taxation est. · year 1
- Rental income
- $31,928
- − Mortgage interest
- −$13,998
- − Property taxes
- −$1,682
- − Insurance
- −$1,250
- − Repairs & maintenance
- −$2,554
- − Management
- −$2,554
- − Depreciation
- −$7,270
- Taxable income
- $2,620
- Est. tax owed @ 24.0%
- −$629
- After-tax cash flow
- $5,937/yr
For passive investors: Depreciation is non-cash, so a rental often shows a tax loss while cash-flowing — sheltering income. Rental losses are passive: they offset passive income freely, and up to $25,000/yr can offset ordinary (W-2) income if you actively participate and your MAGI is under $100k (phasing out to $0 by $150k); unused losses carry forward. On sale, claimed depreciation is recaptured at up to 25%, and gains may owe capital-gains tax (a 1031 exchange can defer both). Figures are a year-1 estimate at your 24.0% rate — not tax advice; consult a CPA.
Schools (NCES district)
- District
- Bryan County
- NCES district ID
- 1300570
- Math proficiency
- 49% ▼ -2.00%
- Reading proficiency
- 53% ▼ -2.00%
- Median HH income
- $64,465
- Composite
- 44.99/100
- National rank
- #2701
- State rank
- #14 of 174 in GA
Livability — Buckhead
- Score
- 61/100
- State rank
- #334
- US rank
- #17547
Category grades
Schools grade is shown separately in the Schools card above.
Census & demographics
- County
- Bryan County · 37,406 people
- City population
- 35,668
- Metro
- Savannah, GA
- Population (ZIP)
- 37,406
- Household income
- $122,378
- Rent vs Own
- Severe rent burden
- 562.0
Population outlook (Bryan County) Hauer SSP2
- Today (2025)
- 45,980 people
- By 2030
- 51,583 · +12.2%
- By 2040
- 63,184 · +37.4%
- By 2050
- 75,400 · +64.0%
- By 2075
- 105,363 · +129.1%
- By 2100
- 124,959 · +171.8%
Race, ethnicity, and origin ACS 2023
- Neighborhood character
- Predominantly White (70%)
- Race & ethnicity
- White 70% Black 12% Hispanic / Latino 9% Two or more races 8% Asian 3%
- Hispanic origin (detail)
- Mexican 2% Puerto Rican 5%
- Common ancestry
- Lithuanian 3% Romanian 2% Slovak 2%
- Foreign-born
- 6% · Canada, Jamaica
- Languages at home
- 89% English-only · Spanish 7% Other Indo-European 2% German/W. Germanic 1%
Political lean MEDSL · Bryan
- 2024 margin
- Solid R (+36.3) · D 31.6% · R 67.9%
- 2008→2024 swing
- +6.3pp toward D · 2008: -42.6pp · 2024: -36.3pp
- All cycles
- 2024: R+36.3 2020: R+35.2 2016: R+43.2 2012: R+43.6 2008: R+42.6
Not yet ingested
- Civics
- —
Market trends
- HPI YoY
- ▼ -95.54%
- Current HPI
- 215.1789
- Rent YoY
- ▲ 2.17%
- Metro
- Savannah, GA
- State GDP YoY
- ▲ 2.66%
- F500 in state
- 28
Industry mix (Fortune 500 HQ in GA)
| Industry | F500 HQs | Revenue |
|---|---|---|
| Paper / Packaging | 2 | $29B |
|
||
| Retail | 1 | $160B |
|
||
| Transportation / Logistics | 1 | $91B |
|
||
| Airlines | 1 | $62B |
|
||
| Consumer Goods | 1 | $47B |
|
||
| Utilities | 1 | $25B |
|
||
Price history
+316.5% since first listed7 events — show timeline
- 2026-03-20 Pending — GAMLS
- 2026-03-12 Relisted — GAMLS
- 2026-03-07 Contingent — GAMLS
- 2026-02-09 Price Changed $249,900 GAMLS
- 2026-02-05 Price Changed $259,900 GAMLS
- 2026-01-23 Listed $269,900 GAMLS
- 2021-02-11 Sold (Public Records) $60,000 Public Records
Property tax history
+9.7%/yrLatest (2025): $1,682 · +11.5% YoY. Source: county tax records.
Cash-flow waterfall
monthlySold comps — $/sqft
last 12 mo · ≤1 miLoading sold comps…