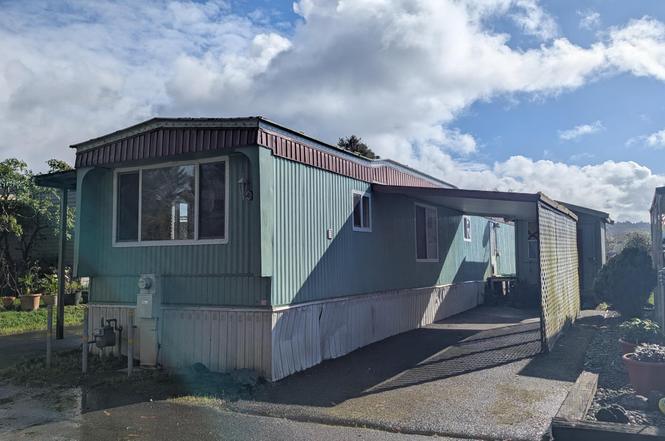
2080 Horizon Dr #14 · Humboldt Hill, CA
Flood risk 1/10 · Minimal
- FEMA flood zone
- X (unshaded)
- Chance of flooding over 30 yrs
- 0.0%
- Est. flood insurance / yr
- $507 – $1,088
Fire risk 3/10 · Minor
- Est. fire insurance / yr
- $659 – $1,223
Heat risk 1/10 · Minimal
- Hot days now (above 75°F)
- 7 days/yr
- Hot days in 30 yrs
- 17 days/yr
Wind risk 1/10 · Minimal
- Chance of severe wind over 30 yrs
- —
Air-quality risk 5/10 · Moderate
- Unhealthy air days now
- 6 days/yr
- Unhealthy air days in 30 yrs
- 6 days/yr
Risk factors via First Street. Map © Google.
Why this score? — see what drove the B+ grade
The composite is a weighted blend of 9 inputs, each scored 0–100. Each bar is that input's sub-score; the figure is the points it added to the 100-point composite (weight × sub-score).
- Cash flow +30.0/30.0
- ARV discount +14.8/15.0
- 1% rule +10.0/10.0
- DSCR +10.0/10.0
- Schools +5.0/10.0
- Livability +3.2/5.0
- Rent growth +2.5/5.0
- Condition / age +2.5/5.0
- Appreciation +0.0/10.0
$45,000
🖨 Deal sheet 📄 Offer letter ✓ Due diligence
Listing remarks
Affordable housing in a beautiful family park on Humboldt Hill. 2 bed 1 bath mobile home. Recently upgraded with fresh paint and luxury vinyl flooring. Very nice appliances including dishwasher and washer/dryer. Open living room with sunroom and sliding glass door to the backyard. Dual pane windows, forced air heat, and newer water heater. Carport with shed and additional parking space, fenced yard with Cherry Tree. Space rent $669 includes water, sewer, and garbage. One pet allowed. Legal owner can assign a ''registered owner-tenant'' with park manager approval. Amazing club house with pool, hot tub, kitchen, games. Great neighbors. Peak of the bay from the kitchen. Easy access to Eureka.
Key facts
- Open living room
- Sunroom
- Sliding glass door
Tags
Property features AI
Exterior
- Parking: 1-car garage
- Utilities: Public water; Public sewer; Electricity connected with circuit breakers; Natural gas connected/available; Underground utilities; Phone available
- Home design: Single family residence (mobile home); Located in a mobile home park (Humboldt Mobile Est); Fleetwood Broadmore model
- Construction: Block foundation; Membrane roof; Built as a manufactured/mobile home
- Exterior features: Full fencing; Views; Level lot; Concrete and paved road access; Private maintained road
Interior
- Kitchen: Dishwasher; Range; Refrigerator
- Flooring: Vinyl
- Heating & cooling: Forced air heating; Natural gas heating
- Interior features: Double pane windows; Insulation for energy efficiency; 5 total rooms
- Laundry & utility: Washer; Dryer
Neighborhood map
What this means for you Summary
Snapshot
- This is a 2-bed/1.0-bath single-family listed at $45k.
Deal economics
- At list price, monthly cash flow is $941 ($11k/yr) — positive.
- The deal already cash-flows at list — no discount required.
- Meets the 1% rule at list price ($2k rent vs $45k).
- Recommended offer: $41k (9.0% below list) — sets the bar for market timing.
- Cap rate 31.4% vs local median 2.7% in Humboldt Hill — top-decile yield for the area; either an underpriced asset or a hidden risk that comps aren't pricing in. Stress-test before assuming the spread holds.
Location & tenants
- Location reads 64/100 on livability (#423 in CA) — a middle-class / working-renter tenant base. Strengths: housing A+, crime B, employment B; Watch: health & safety C-, schools D-, amenities F.
- Market conditions: 155 active listings in the ZIP; 188 units permitted in Humboldt County in 2024 (17 in 5+ unit buildings).
Forward outlook
- Local home prices are declining (-3.0%/yr); year-one equity from $311 of loan paydown is wiped out by about $1k of value loss. Plan a longer hold.
- Humboldt County population projected to shrink 4% by 2050 — rents likely to lag national; underwrite the cash flow, not the appreciation.
- At projected returns (-3.0% appreciation + 3.0% rent growth), your $13k cash investment doubles in ~2 years — after that, you're playing with house money.
Negotiation context
- It's been on market 104 days — a 9% lower offer ($41k) is reasonable based on typical stale-listing flexibility.
- 2 sale attempts; this cycle's ask has dropped $4k (7%) from the opening price — seller is motivated, your offer sets the floor, not the list.
Questions for the listing agent
- It's been on market 104 days. Have you received any prior offers? Is the seller open to a 9% concession, seller financing, or rate buy-down credit?
- Built in 1972 — when were the roof, HVAC, electrical panel, plumbing, and water heater last replaced?
- Why hasn't it sold? Are there any deal-killer items the seller is aware of (foundation, flood, title, zoning, code violations)?
- Is there a deadline driving the sale (1031 exchange, divorce, estate, relocation)? That informs how much negotiation room exists.
- Schools are D-rated, which usually means shorter tenancies and higher turnover. Who's the typical renter profile here, and what's been the actual vacancy rate?
- What's the average days-on-market for RENTAL listings here right now (not sales)? A rising rental-DOM trend means longer vacancies and softer asking-rent achievability than the comps imply.
- What's the recent tenant-quality profile in this submarket — average credit score on applications, eviction rate, late-payment / NSF rate, and stable-employment percentage? A property-management company in the area should have these aggregated.
- How much new for-sale + rental construction is in the pipeline within 1–3 miles? Heavy new supply typically softens prices + rents 12–24 months out; constrained supply supports both.
Investment metrics
- 1% rule
- 3.52% ✓
- Cap rate
- 31.38%
- Cash-on-cash
- 89.59%
- DSCR
- 4.99
- GRM
- 2.4
CMA / ARV
- ARV (on-the-fly)
- $53,676
- Comps found
- 4
Show comp detail 4 sales within ~0.75 mi
| Address | Dist | Beds/Ba | Sqft | Sold | Price | $/sf | Match |
|---|---|---|---|---|---|---|---|
| 2333 Meadowbrook Dr #66 | 0.23mi | 2/— | 845 (-1%) | 4mo | $37,500 | $44 | 84 |
| 2398 Meadowbrook Dr #80 | 0.15mi | 2/1.0 | 800 (-6%) | 5mo | $50,000 | $63 | 79 |
| 2220 Riverview Way #44 | 0.13mi | 2/2.0 | 800 (-6%) | 11mo | $35,000 | $44 | 71 |
| 2348 Meadowbrook Dr #69 | 0.15mi | 2/2.0 | 938 (+10%) | 12mo | $148,000 | $158 | 62 |
Match score weights: distance 35% · size 25% · config 20% · recency 20%. Top-matched comps best support the ARV.
Projected returns pro-forma
-3.0% appreciation · 3.0% rent growth · sell at horizon
- IRR
- 90.2%
- Equity multiple
- 5.18×
- Total profit
- $52,647
- Equity at exit
- $6,710
- IRR
- 93.2%
- Equity multiple
- 10.77×
- Total profit
- $123,091
- Equity at exit
- $3,891
Cash invested: $12,600 (down + closing). Projections, not guarantees.
Landlord ↔ Tenant lean methodology
- Overall (STATE)
- 18 Strongly Tenant-Friendly
- State California
- 18 Strongly Tenant-Friendly · D+13
- County
- — inherits STATE
- City
- — inherits STATE
ZIP-level market 95503
- Active inventory
- 155
- Price-to-rent
- 2.4×
Monthly cashflow live
- Estimated rent
- $1,584 medium interval (Pro) →
- Mortgage (P&I)
- −$236
- Tax est. 1.5%
- −$56 /mo · $675/yr
- Insurance
- −$19
- HOA
- −$0
- Vacancy / Maint / Mgmt
- −$333
- Net cashflow
- $941
Break-even live
UW: 25.0% down · 7.5% · 30yr · 1.5% tax · 5.0% vac · 8.0% maint · 8.0% mgmt
Financing live
Cash to close
- Down payment
- $11,250
- Closing costs
- $1,350
- Reserves months
- —
- Total cash needed
- —
Loan-product check · same deal, 3 products live
Conventional
25% down · 7.5% · 30yr
- Down + closing
- —
- Monthly P&I
- —
- Monthly cashflow
- —
- DSCR
- —
- Eligible?
- —
Personal DTI + credit; lowest rate.
DSCR
20% down · 8.5% · 30yr
- Down + closing
- —
- Monthly P&I
- —
- Monthly cashflow
- —
- DSCR
- —
- Eligible?
- —
No personal income docs; deal must DSCR.
Hard money
10% down · 12.0% · 12mo
- Down + closing
- —
- Monthly P&I
- —
- Monthly cashflow
- —
- DSCR
- —
- Eligible?
- —
Short-term bridge; refi at stabilization.
Listing history 20 events
-
2026-06-19days on market $45,000 Active 104 DOM
-
2026-06-18days on market $45,000 Active 103 DOM
-
2026-06-17days on market $45,000 Active 102 DOM
-
2026-06-16days on market $45,000 Active 101 DOM
-
2026-06-15days on market $45,000 Active 100 DOM
-
2026-06-14days on market $45,000 Active 98 DOM
-
2026-06-13days on market $45,000 Active 97 DOM
-
2026-06-10days on market $45,000 Active 95 DOM
-
2026-06-09days on market $45,000 Active 94 DOM
-
2026-06-08days on market $45,000 Active 93 DOM
-
2026-06-07days on market $45,000 Active 92 DOM
-
2026-06-03days on market $45,000 Active 88 DOM
-
2026-06-02days on market $45,000 Active 87 DOM
-
2026-06-01days on market $45,000 Active 86 DOM
-
2026-05-31days on market $45,000 Active 85 DOM
-
2026-05-30days on market $45,000 Active 84 DOM
-
2026-05-02status Active
-
2026-04-14status Pending
-
2026-04-07price $45,000
-
2026-02-16$48,500 Active
ⓘ Source: listings_history table (triggers on properties + properties_extension) + one-shot
backfill from property_details.listing_events for pre-trigger history.
Climate risk First Street
- Flood 1/10 Low FEMA zone X (unshaded) · 0% chance over 30 yrs
- Wildfire 3/10 Moderate
- Heat 1/10 Low 7 d/yr ≥75°F today · 17 d/yr by 30 yrs out
- Wind 1/10 Low
- Air quality 5/10 Major 6 unhealthy d/yr today · 6 by 30 yrs out
Nearby sold comps map
Loading sold comps map…
Walkable amenities ~0.75 mi
Loading nearby amenities…
Taxation est. · year 1
- Rental income
- $19,013
- − Mortgage interest
- −$2,521
- − Property taxes
- −$675
- − Insurance
- −$225
- − Repairs & maintenance
- −$1,521
- − Management
- −$1,521
- − Depreciation
- −$1,309
- Taxable income
- $11,241
- Est. tax owed @ 24.0%
- −$2,698
- After-tax cash flow
- $8,591/yr
For passive investors: Depreciation is non-cash, so a rental often shows a tax loss while cash-flowing — sheltering income. Rental losses are passive: they offset passive income freely, and up to $25,000/yr can offset ordinary (W-2) income if you actively participate and your MAGI is under $100k (phasing out to $0 by $150k); unused losses carry forward. On sale, claimed depreciation is recaptured at up to 25%, and gains may owe capital-gains tax (a 1031 exchange can defer both). Figures are a year-1 estimate at your 24.0% rate — not tax advice; consult a CPA.
Schools (NCES district)
No district data.
Livability — Humboldt Hill
- Score
- 64/100
- State rank
- #423
- US rank
- #14428
Category grades
Schools grade is shown separately in the Schools card above.
Census & demographics
- Census place
- Humboldt Hill, CA
- County
- Humboldt County · 88,652 people
- Metro
- Eureka-Arcata, CA
- Population (ZIP)
- 25,054
- Household income
- $71,855
- Rent vs Own
- Severe rent burden
- 780.0
Population outlook (Humboldt County) Hauer SSP2
- Today (2025)
- 135,550 people
- By 2030
- 134,798 · -0.6%
- By 2040
- 132,222 · -2.5%
- By 2050
- 130,850 · -3.5%
- By 2075
- 128,656 · -5.1%
- By 2100
- 120,238 · -11.3%
Race, ethnicity, and origin ACS 2023
- Neighborhood character
- Predominantly White (72%)
- Race & ethnicity
- White 72% Hispanic / Latino 14% Two or more races 11% Asian 4% Native American 2%
- Hispanic origin (detail)
- Mexican 10% Cuban 1%
- Common ancestry
- Italian 4% Portuguese 2% Slovak 2%
- Foreign-born
- 8% · Canada, Vietnam
- Languages at home
- 90% English-only · Spanish 5% Other Asian/Pacific 2% Vietnamese 1%
Political lean MEDSL · Humboldt
- 2024 margin
- Strong D (+28.4) · D 62.0% · R 33.6% · Other 4.5%
- 2008→2024 swing
- +0.2pp no change · 2008: 28.2pp · 2024: 28.4pp
- All cycles
- 2024: D+28.4 2020: D+33.4 2016: D+25.9 2012: D+26.2 2008: D+28.2
Not yet ingested
- Civics
- —
Market trends
- HPI YoY
- ▼ -268.60%
- Current HPI
- 235.5679
- Rent YoY
- —
- Metro
- Eureka-Arcata, CA
- State GDP YoY
- ▲ 3.21%
- F500 in state
- 116
Industry mix (Fortune 500 HQ in CA)
| Industry | F500 HQs | Revenue |
|---|---|---|
| Technology | 27 | $1,492B |
|
||
| Financial Services | 3 | $174B |
|
||
| Retail | 3 | $44B |
|
||
| Insurance | 3 | $26B |
|
||
| Media / Entertainment | 2 | $115B |
|
||
| Pharmaceuticals / Biotech | 2 | $62B |
|
||
Price history
-7.2% since first listed4 events — show timeline
- 2026-05-02 Relisted — HAR
- 2026-04-14 Pending — HAR
- 2026-04-07 Price Changed $45,000 HAR
- 2026-02-16 Listed $48,500 HAR
Cash-flow waterfall
monthlySold comps — $/sqft
last 12 mo · ≤1 miLoading sold comps…