 Fourplex
2705 Jasime Ave · Hidalgo, TX
Flood risk No data
- FEMA flood zone
- —
- Chance of flooding over 30 yrs
- —
- Est. flood insurance / yr
- —
Fire risk No data
- Est. fire insurance / yr
- —
Heat risk No data
- Hot days now (above threshold)
- —
- Hot days in 30 yrs
- —
Wind risk No data
- Chance of severe wind over 30 yrs
- —
Air-quality risk No data
- Unhealthy air days now
- —
- Unhealthy air days in 30 yrs
- —
Risk factors via First Street. Map © Google.
Why this score? — see what drove the B- grade
The composite is a weighted blend of 9 inputs, each scored 0–100. Each bar is that input's sub-score; the figure is the points it added to the 100-point composite (weight × sub-score).
- Cash flow +22.9/30.0
- Appreciation +10.0/10.0
- ARV discount +7.5/15.0
- DSCR +7.4/10.0
- 1% rule +6.0/10.0
- Condition / age +5.0/5.0
- Livability +3.4/5.0
- Rent growth +2.5/5.0
- Schools +2.5/10.0
$525,000
🖨 Deal sheet 📄 Offer letter ✓ Due diligence
Multi-family units
County records classify this as Multi-Family (5+ Unit). Listing-text estimate: 4 units. estimate disagrees with records
5+ unit building — per-unit beds/baths from public records are typically unavailable; the breakdown below (if shown) is an estimate from the listing text.
Listing remarks
This 4-Plex is a charm. It is located in a fast-growing section of city of Hidalgo. Mostly all developed units have been leased as it is an area which is thirsting for family rentals. Under construction, 4 units on two buildings and a quarter acre lot. Each building has a 2/2 and a 3/2 to facilitate leasing of the units. Kitchen appliances (range and refrigerator) are included in the sale. Floors will be tiled with porcelain floors.
Key facts
- Porcelain floors
- Quarter acre lot
- 0.25 acre lot
Tags
Property features AI
Finance
- Other: Lot approximately 11,071 sq. ft. (0.2542 acres)
- HOA & community: No homeowners association; Community features include curbs and sidewalks; Community of 4 units
Exterior
- Parking: Two covered parking spaces; Two carport spaces; Detached parking/other garage or carport
- Utilities: City sewer; Cable available; Multiple water meters (4)
- Home design: Not new construction; Living area per blueprints; Green energy/efficiency features (unspecified)
- Construction: Stucco exterior; Composition shingle roof; Slab foundation; Built area approximately 3,986
- Exterior features: Landscaped fencing; Curb and gutters; Sidewalks; Other exterior features; Paved road access; Outbuilding (none)
Interior
- Kitchen: Electric cooktop; Double oven; Disposal; Refrigerator; Electric water heater
- Flooring: Porcelain tile
- Heating & cooling: Central heating (electric); Central air conditioning (electric)
- Interior features: Built-in features; Ceiling fans; Split-bedroom layout
- Laundry & utility: Laundry area with washer/dryer connections
Neighborhood map
What this means for you Summary
Snapshot
- This is a 2×2bd/2ba + 2×3bd/2ba units multifamily listed at $525k. Condition is rated excellent.
Deal economics
- At list price, monthly cash flow is $923 ($11k/yr) — positive. Per door: $231/mo.
- The deal already cash-flows at list — no discount required.
- Meets the 1% rule at list price ($6k rent vs $525k).
- Recommended offer: $517k (1.5% below list) — sets the bar for market timing.
- Cap rate 8.4% vs local median 4.2% in Hidalgo — top-decile yield for the area; either an underpriced asset or a hidden risk that comps aren't pricing in. Stress-test before assuming the spread holds.
Location & tenants
- Location reads 68/100 on livability (#488 in TX) — a middle-class / working-renter tenant base. Strengths: cost of living A+, housing A+, crime A-; Watch: amenities F, commute F, employment F.
- Valley View ISD (suburban): math 24% / reading 38% proficiency, ranked #631 of 826 in TX (top 76%) — families likely to look elsewhere, expect single-tenant / working-renter base with shorter leases; 85% free/reduced lunch — lower-income household profile, screen leases tightly.
- Zoned schools: Valley View El (math 32% / reading 37%, grade F, #1,995 of 4,322 statewide, top 50%, 412 students, 96% FRL); Valley View J H (math 23% / reading 35%, grade F, #1,103 of 1,662 statewide, top 67%, 483 students, 95% FRL); Valley View H S (math 12% / reading 47%, grade F, #1,112 of 1,632 statewide, top 70%, 1,170 students, 96% FRL).
- Market conditions: 98 active listings in the ZIP; 7,378 units permitted in Hidalgo County in 2024 (641 in 5+ unit buildings).
Forward outlook
- In year one you build about $56k of equity ($4k loan paydown + $52k appreciation (10.0% local appreciation)).
- Hidalgo County population projected at +28% by 2050 — long-run rental-demand tailwind backs the buy-and-hold thesis.
- At projected returns (10.0% appreciation + 3.0% rent growth), your $147k cash investment doubles in ~3 years — after that, you're playing with house money.
- By year 2, paydown + projected appreciation supports a ~$90k cash-out refi (75% LTV) — recoverable capital for the next deal without selling this one.
Negotiation context
- It's been on market 15 days — a 2% lower offer ($517k) is reasonable based on typical stale-listing flexibility.
Questions for the listing agent
- Can we see the unit-by-unit rent roll, current vacancy, and any below-market leases? What's the average tenancy length?
- What capital expenditures (roof, boiler, parking lot, exteriors) have been made in the last 5 years, and what's planned in the next 2?
- Is there a deadline driving the sale (1031 exchange, divorce, estate, relocation)? That informs how much negotiation room exists.
- Schools are D-rated, which usually means shorter tenancies and higher turnover. Who's the typical renter profile here, and what's been the actual vacancy rate?
- What's the average days-on-market for RENTAL listings here right now (not sales)? A rising rental-DOM trend means longer vacancies and softer asking-rent achievability than the comps imply.
- What's the recent tenant-quality profile in this submarket — average credit score on applications, eviction rate, late-payment / NSF rate, and stable-employment percentage? A property-management company in the area should have these aggregated.
- How much new apartment / multifamily construction is in the pipeline within 1–3 miles? Heavy new supply (>2% of stock underway) typically softens rents 12–24 months out; light construction supports rent growth.
Investment metrics
- 1% rule
- 1.10% ✓
- Cap rate
- 8.40%
- Cash-on-cash
- 7.53%
- DSCR
- 1.34
- GRM
- 7.6
CMA / ARV
No comps found within radius.
Projected returns pro-forma
10.0% appreciation · 3.0% rent growth · sell at horizon
- IRR
- 29.8%
- Equity multiple
- 3.35×
- Total profit
- $344,804
- Equity at exit
- $472,962
- IRR
- 25.8%
- Equity multiple
- 7.59×
- Total profit
- $969,334
- Equity at exit
- $1,019,960
Cash invested: $147,000 (down + closing). Projections, not guarantees.
Landlord ↔ Tenant lean methodology
- Overall (STATE)
- 87 Strongly Landlord-Friendly
- State Texas
- 87 Strongly Landlord-Friendly · R+5
- County
- — inherits STATE
- City
- — inherits STATE
ZIP-level market 78557
- Home prices YoY
- 17.9%
- Active inventory
- 98
- Price-to-rent
- 32.2×
Monthly cashflow live
- Estimated rent
- $5,761 medium interval (Pro) →
- Mortgage (P&I)
- −$2,753
- Tax est. 1.5%
- −$656 /mo · $7,875/yr
- Insurance
- −$219
- HOA
- −$0
- Vacancy / Maint / Mgmt
- −$1,210
- Net cashflow
- $923
Break-even live
4-unit breakdown (identical units grouped — click to expand)
| Units | Beds | Baths | Est. rent |
|---|---|---|---|
| 2× units | 2 | 2 | $2,714 |
| #1 | 2 | 2 | $1,357 |
| #2 | 2 | 2 | $1,357 |
| 2× units | 3 | 2 | $3,048 |
| #3 | 3 | 2 | $1,524 |
| #4 | 3 | 2 | $1,524 |
| Total (4 units) | $5,761 | ||
UW: 25.0% down · 7.5% · 30yr · 1.5% tax · 5.0% vac · 8.0% maint · 8.0% mgmt
Financing live
Cash to close
- Down payment
- $131,250
- Closing costs
- $15,750
- Reserves months
- —
- Total cash needed
- —
Loan-product check · same deal, 3 products live
Conventional
25% down · 7.5% · 30yr
- Down + closing
- —
- Monthly P&I
- —
- Monthly cashflow
- —
- DSCR
- —
- Eligible?
- —
Personal DTI + credit; lowest rate.
DSCR
20% down · 8.5% · 30yr
- Down + closing
- —
- Monthly P&I
- —
- Monthly cashflow
- —
- DSCR
- —
- Eligible?
- —
No personal income docs; deal must DSCR.
Hard money
10% down · 12.0% · 12mo
- Down + closing
- —
- Monthly P&I
- —
- Monthly cashflow
- —
- DSCR
- —
- Eligible?
- —
Short-term bridge; refi at stabilization.
Listing history 12 events
-
2026-06-19days on market $525,000 Active 15 DOM
-
2026-06-18days on market $525,000 Active 14 DOM
-
2026-06-17days on market $525,000 Active 13 DOM
-
2026-06-16days on market $525,000 Active 12 DOM
-
2026-06-15days on market $525,000 Active 11 DOM
-
2026-06-14days on market $525,000 Active 9 DOM
-
2026-06-12days on market $525,000 Active 8 DOM
-
2026-06-09days on market $525,000 Active 5 DOM
-
2026-06-08days on market $525,000 Active 4 DOM
-
2026-06-07days on market $525,000 Active 3 DOM
-
2026-06-05remarks 436-char remark
-
2026-06-05$525,000 Active 1 DOM
ⓘ Source: listings_history table (triggers on properties + properties_extension) + one-shot
backfill from property_details.listing_events for pre-trigger history.
Nearby sold comps map
Loading sold comps map…
Walkable amenities ~0.75 mi
Loading nearby amenities…
Taxation est. · year 1
- Rental income
- $69,132
- − Mortgage interest
- −$29,408
- − Property taxes
- −$7,875
- − Insurance
- −$2,625
- − Repairs & maintenance
- −$5,531
- − Management
- −$5,531
- − Depreciation
- −$15,273
- Taxable income
- $2,890
- Est. tax owed @ 24.0%
- −$694
- After-tax cash flow
- $10,383/yr
For passive investors: Depreciation is non-cash, so a rental often shows a tax loss while cash-flowing — sheltering income. Rental losses are passive: they offset passive income freely, and up to $25,000/yr can offset ordinary (W-2) income if you actively participate and your MAGI is under $100k (phasing out to $0 by $150k); unused losses carry forward. On sale, claimed depreciation is recaptured at up to 25%, and gains may owe capital-gains tax (a 1031 exchange can defer both). Figures are a year-1 estimate at your 24.0% rate — not tax advice; consult a CPA.
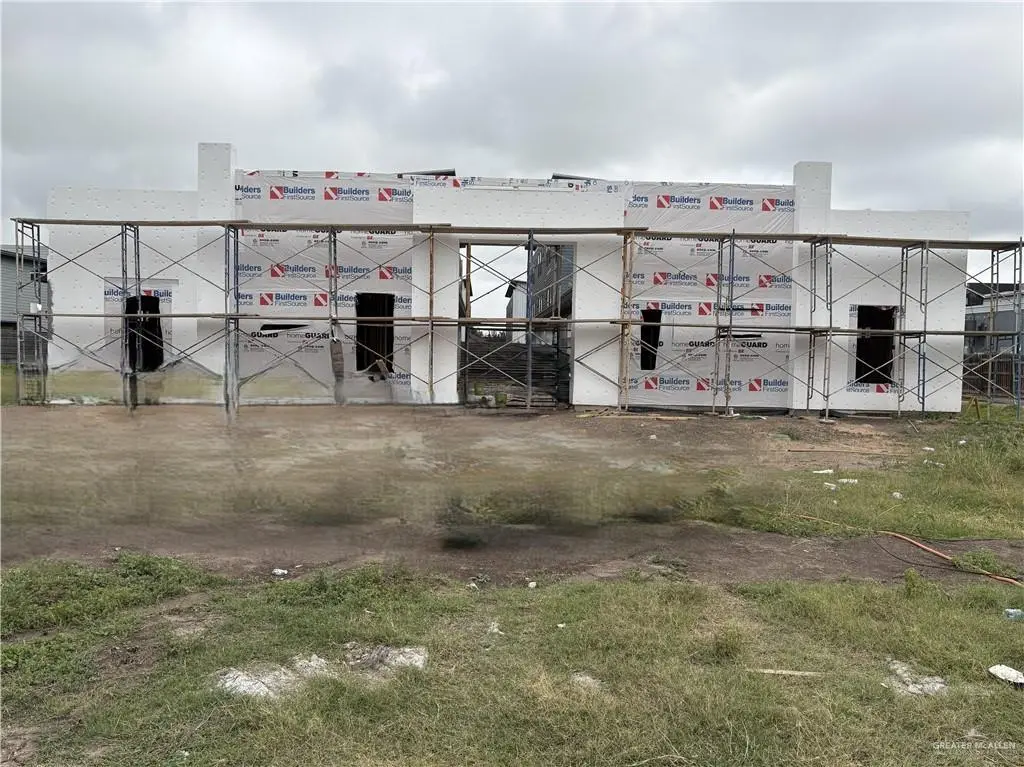
Condition & rehab AI · 2 photos
This 4-Plex is under construction with new roofs, exteriors, and interiors. It is located in a fast-growing area and is ready for move-in with minimal additional work needed.
Value-add opportunities
- Both Complete interior finishes — Finishing the interiors will make the property move-in ready and attractive to both buyers and renters.
- Both Landscaping and curb appeal improvements — Enhancing the landscaping and curb appeal will increase the property's visual appeal and marketability.
Renovation cost estimate screening
Value-add ROI direction
- Both Complete interior finishes — Finishing the interiors will make the property move-in ready and attractive to both buyers and renters. ↑
- Both Landscaping and curb appeal improvements — Enhancing the landscaping and curb appeal will increase the property's visual appeal and marketability. ↑
ⓘ Cost ranges are severity-bucket heuristics (US national rule-of-thumb). Get contractor quotes + a written scope before underwriting a rehab budget.
Schools (NCES district)
- District
- Valley View ISD
- NCES district ID
- 4843800
- Math proficiency
- 24% ▼ -42.00%
- Reading proficiency
- 38% ▼ -16.00%
- Median HH income
- $33,158
- Composite
- 25.37/100
- National rank
- #7473
- State rank
- #631 of 826 in TX
Livability — Hidalgo
- Score
- 68/100
- State rank
- #488
- US rank
- #9681
Category grades
Schools grade is shown separately in the Schools card above.
Census & demographics
- Census place
- Hidalgo, TX
- City population
- 14,250
- Population (ZIP)
- 14,250
Population outlook (Hidalgo County) Hauer SSP2
- Today (2025)
- 955,232 people
- By 2030
- 1,009,774 · +5.7%
- By 2040
- 1,120,332 · +17.3%
- By 2050
- 1,225,036 · +28.2%
- By 2075
- 1,439,189 · +50.7%
- By 2100
- 1,533,429 · +60.5%
Race, ethnicity, and origin ACS 2023
- Neighborhood character
- Predominantly Hispanic (99%)
- Race & ethnicity
- Hispanic / Latino 99% Two or more races 47%
- Hispanic origin (detail)
- Mexican 93%
- Foreign-born
- 39% · Canada
- Languages at home
- 6% English-only · Spanish 94%
Political lean MEDSL · Hidalgo
- 2024 margin
- Toss-up / Even · D 48.1% · R 51.0%
- 2008→2024 swing
- -41.6pp toward R · 2008: 38.7pp · 2024: -2.9pp
- All cycles
- 2024: R+2.9 2020: D+17.1 2016: D+40.5 2012: D+41.8 2008: D+38.7
Not yet ingested
- Civics
- —
Market trends
- HPI YoY
- ▲ 34.26%
- Current HPI
- 225.701
- Rent YoY
- —
- Metro
- —
- State GDP YoY
- ▲ 3.95%
- F500 in state
- 110
Industry mix (Fortune 500 HQ in TX)
| Industry | F500 HQs | Revenue |
|---|---|---|
| Energy | 16 | $1,198B |
|
||
| Technology | 5 | $198B |
|
||
| Engineering / Construction | 4 | $72B |
|
||
| Energy Services | 3 | $60B |
|
||
| Utilities | 3 | $41B |
|
||
| Healthcare | 2 | $330B |
|
||
Price history
1 event — show timeline
- 2026-06-01 Listed $525,000 MCALLENMLS
Cash-flow waterfall
monthlySold comps — $/sqft
last 12 mo · ≤1 miLoading sold comps…