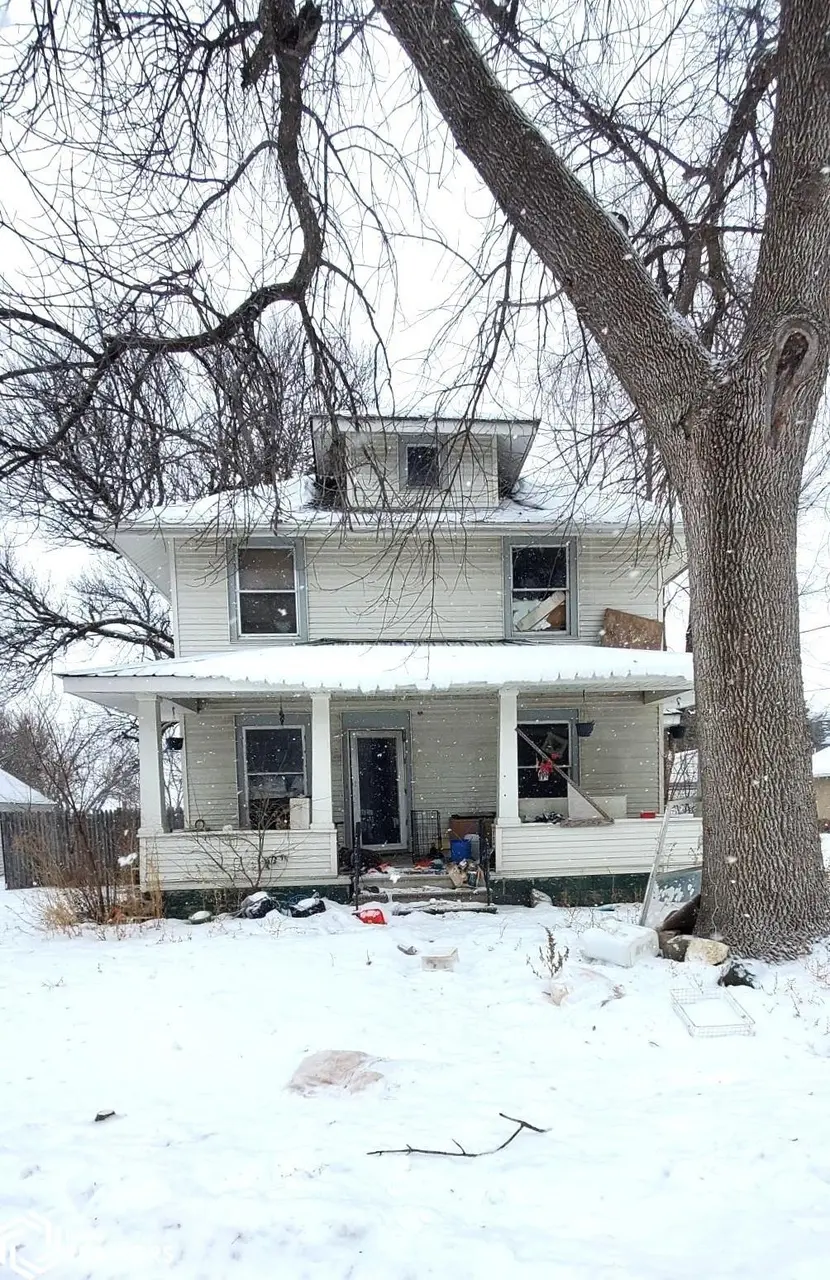
103 W 4th St · Bode, IA
Flood risk 1/10 · Minimal
- FEMA flood zone
- X (unshaded)
- Chance of flooding over 30 yrs
- 0.0%
- Est. flood insurance / yr
- $473 – $860
Fire risk 1/10 · Minimal
- Est. fire insurance / yr
- $902 – $1,676
Heat risk 2/10 · Minimal
- Hot days now (above 101°F)
- 7 days/yr
- Hot days in 30 yrs
- 16 days/yr
Wind risk 2/10 · Minimal
- Chance of severe wind over 30 yrs
- —
Air-quality risk 1/10 · Minimal
- Unhealthy air days now
- 0 days/yr
- Unhealthy air days in 30 yrs
- 0 days/yr
Risk factors via First Street. Map © Google.
Why this score? — see what drove the C- grade
The composite is a weighted blend of 9 inputs, each scored 0–100. Each bar is that input's sub-score; the figure is the points it added to the 100-point composite (weight × sub-score).
- Cash flow +15.0/30.0
- ARV discount +7.5/15.0
- Appreciation +6.2/10.0
- 1% rule +5.0/10.0
- DSCR +5.0/10.0
- Schools +4.4/10.0
- Livability +3.3/5.0
- Rent growth +2.5/5.0
- Condition / age +2.5/5.0
$17,500
🖨 Deal sheet 📄 Offer letter ✓ Due diligence
Listing remarks MLS
This property is an excellent opportunity for fix and flip, rental, or make it your own. The pictures don't lie- there is a lot of random junk to be cleaned out, and repairs to be done. Plan on replacing some windows. The bones are solid, big lot, EXCELLENT location. Instant equity in this bargain. Don't wait around, just call or text today and get this one bought!!
Key facts
- Big lot
- Excellent location
- 0.23 acre lot
Tags
Neighborhood map
What this means for you Summary
Snapshot
- This is a 4-bed/1.0-bath single-family listed at $18k.
Deal economics
- At list price, monthly cash flow is $858 ($10k/yr) — positive.
- The deal already cash-flows at list — no discount required.
- Meets the 1% rule at list price ($1k rent vs $18k).
- Recommended offer: $15k (12.0% below list) — sets the bar for market timing.
Location & tenants
- Location reads 66/100 on livability (#513 in IA) — a middle-class / working-renter tenant base. Strengths: cost of living A+, housing A+; Watch: health & safety C-, amenities F, commute F.
- Twin Rivers Community School District (rural): math 60% / reading 40% proficiency, ranked #323 of 330 in IA (top 98%) — acceptable for families but not a draw, mixed tenant base, ~2y average lease.
- Market conditions: 4 active listings in the ZIP; 13 units permitted in Humboldt County in 2024 (0 in 5+ unit buildings).
Forward outlook
- In year one you build about $531 of equity ($121 loan paydown + $410 appreciation (2.3% local appreciation)).
- Humboldt County population projected to shrink 9% by 2050 — rents likely to lag national; underwrite the cash flow, not the appreciation.
- At projected returns (2.3% appreciation + 3.0% rent growth), your $5k cash investment doubles in ~1 year — after that, you're playing with house money.
Negotiation context
- It's been on market 185 days — a 12% lower offer ($15k) is reasonable based on typical stale-listing flexibility.
Risks & watch-outs
- Watch-outs: built in 1918 — expect roof / HVAC / electrical / plumbing capex.
Questions for the listing agent
- It's been on market 185 days. Have you received any prior offers? Is the seller open to a 12% concession, seller financing, or rate buy-down credit?
- Built in 1918 — when were the roof, HVAC, electrical panel, plumbing, and water heater last replaced?
- Why hasn't it sold? Are there any deal-killer items the seller is aware of (foundation, flood, title, zoning, code violations)?
- Is there a deadline driving the sale (1031 exchange, divorce, estate, relocation)? That informs how much negotiation room exists.
- What's the average days-on-market for RENTAL listings here right now (not sales)? A rising rental-DOM trend means longer vacancies and softer asking-rent achievability than the comps imply.
- What's the recent tenant-quality profile in this submarket — average credit score on applications, eviction rate, late-payment / NSF rate, and stable-employment percentage? A property-management company in the area should have these aggregated.
- How much new for-sale + rental construction is in the pipeline within 1–3 miles? Heavy new supply typically softens prices + rents 12–24 months out; constrained supply supports both.
Investment metrics
- 1% rule
- 7.08% ✓
- Cap rate
- 65.12%
- Cash-on-cash
- 210.11%
- DSCR
- 10.35
- GRM
- 1.2
CMA / ARV
- ARV (median comp)
- $111,873
- List price
- $17,500
- Delta
- -84.36%
- Verdict
- UNDERPRICED
- Comps
- 5 within 1.0 mi
Show comp detail 3 sales within ~0.75 mi
| Address | Dist | Beds/Ba | Sqft | Sold | Price | $/sf | Match |
|---|---|---|---|---|---|---|---|
| 206 Oleson Ave Ave | 0.28mi | 3/2.0 (-1) | 1,414 (+4%) | 2mo | $115,000 | $81 | 69 |
| 204 Christiana Ave. Ave | 0.12mi | 3/1.5 (-1) | 1,432 (+5%) | 21mo | $90,000 | $63 | 61 |
| 607 7th St. St | 0.43mi | 5/2.0 (+1) | 1,304 (-4%) | 20mo | $150,000 | $115 | 48 |
Match score weights: distance 35% · size 25% · config 20% · recency 20%. Top-matched comps best support the ARV.
Projected returns pro-forma
2.34% appreciation · 3.0% rent growth · sell at horizon
- IRR
- —
- Equity multiple
- 12.46×
- Total profit
- $56,169
- Equity at exit
- $7,228
- IRR
- —
- Equity multiple
- 26.34×
- Total profit
- $124,173
- Equity at exit
- $10,665
Cash invested: $4,900 (down + closing). Projections, not guarantees.
Landlord ↔ Tenant lean methodology
- Overall (STATE)
- 83 Strongly Landlord-Friendly
- State Iowa
- 83 Strongly Landlord-Friendly · R+6
- County
- — inherits STATE
- City
- — inherits STATE
ZIP-level market 50519
- Home prices YoY
- 2.0%
- Active inventory
- 4
- Price-to-rent
- 1.2×
Monthly cashflow live
- Estimated rent
- $1,239 medium interval (Pro) →
- Mortgage (P&I)
- −$92
- Tax est. 1.5%
- −$22 /mo · $262/yr
- Insurance
- −$7
- HOA
- −$0
- Vacancy / Maint / Mgmt
- −$260
- Net cashflow
- $858
Break-even live
UW: 25.0% down · 7.5% · 30yr · 1.5% tax · 5.0% vac · 8.0% maint · 8.0% mgmt
Financing live
Cash to close
- Down payment
- $4,375
- Closing costs
- $525
- Reserves months
- —
- Total cash needed
- —
Loan-product check · same deal, 3 products live
Conventional
25% down · 7.5% · 30yr
- Down + closing
- —
- Monthly P&I
- —
- Monthly cashflow
- —
- DSCR
- —
- Eligible?
- —
Personal DTI + credit; lowest rate.
DSCR
20% down · 8.5% · 30yr
- Down + closing
- —
- Monthly P&I
- —
- Monthly cashflow
- —
- DSCR
- —
- Eligible?
- —
No personal income docs; deal must DSCR.
Hard money
10% down · 12.0% · 12mo
- Down + closing
- —
- Monthly P&I
- —
- Monthly cashflow
- —
- DSCR
- —
- Eligible?
- —
Short-term bridge; refi at stabilization.
Listing history 17 events
-
2026-06-18days on market $17,500 Active 185 DOM
-
2026-06-17days on market $17,500 Active 184 DOM
-
2026-06-16days on market $17,500 Active 183 DOM
-
2026-06-15days on market $17,500 Active 182 DOM
-
2026-06-13days on market $17,500 Active 180 DOM
-
2026-06-12days on market $17,500 Active 179 DOM
-
2026-06-09days on market $17,500 Active 176 DOM
-
2026-06-08days on market $17,500 Active 175 DOM
-
2026-06-07days on market $17,500 Active 174 DOM
-
2026-06-05days on market $17,500 Active 172 DOM
-
2026-06-04days on market $17,500 Active 170 DOM
-
2026-06-02days on market $17,500 Active 169 DOM
-
2026-06-01days on market $17,500 Active 168 DOM
-
2026-05-31days on market $17,500 Active 167 DOM
-
2026-05-31days on market $17,500 Active 166 DOM
-
2025-12-15$17,500 Active 368-char remark
Show marketing remark (368 chars)
This property is an excellent opportunity for fix and flip, rental, or make it your own. The pictures don't lie- there is a lot of random junk to be cleaned out, and repairs to be done. Plan on replacing some windows. The bones are solid, big lot, EXCELLENT location. Instant equity in this bargain. Don't wait around, just call or text today and get this one bought!!
-
2006-07-17soldstatus $52,507
ⓘ Source: listings_history table (triggers on properties + properties_extension) + one-shot
backfill from property_details.listing_events for pre-trigger history.
Climate risk First Street
- Flood 1/10 Low FEMA zone X (unshaded) · 0% chance over 30 yrs
- Wildfire 1/10 Low
- Heat 2/10 Low 7 d/yr ≥101°F today · 16 d/yr by 30 yrs out
- Wind 2/10 Low
- Air quality 1/10 Low 0 unhealthy d/yr today · 0 by 30 yrs out
Nearby sold comps map
Loading sold comps map…
Walkable amenities ~0.75 mi
Loading nearby amenities…
Taxation est. · year 1
- Rental income
- $14,869
- − Mortgage interest
- −$980
- − Property taxes
- −$262
- − Insurance
- −$88
- − Repairs & maintenance
- −$1,190
- − Management
- −$1,190
- − Depreciation
- −$509
- Taxable income
- $10,651
- Est. tax owed @ 24.0%
- −$2,556
- After-tax cash flow
- $7,739/yr
For passive investors: Depreciation is non-cash, so a rental often shows a tax loss while cash-flowing — sheltering income. Rental losses are passive: they offset passive income freely, and up to $25,000/yr can offset ordinary (W-2) income if you actively participate and your MAGI is under $100k (phasing out to $0 by $150k); unused losses carry forward. On sale, claimed depreciation is recaptured at up to 25%, and gains may owe capital-gains tax (a 1031 exchange can defer both). Figures are a year-1 estimate at your 24.0% rate — not tax advice; consult a CPA.
Schools (NCES district)
- District
- Twin Rivers Community School District
- NCES district ID
- 1928200
- Math proficiency
- 60% ▼ -20.00%
- Reading proficiency
- 40% ▼ -40.00%
- Median HH income
- $45,541
- Composite
- 44.42/100
- National rank
- #6104
- State rank
- #323 of 330 in IA
Livability — Bode
- Score
- 66/100
- State rank
- #513
- US rank
- #11425
Category grades
Schools grade is shown separately in the Schools card above.
Census & demographics
- Census place
- Bode, IA
- Population (ZIP)
- 713
Population outlook (Humboldt County) Hauer SSP2
- Today (2025)
- 9,265 people
- By 2030
- 9,141 · -1.3%
- By 2040
- 8,904 · -3.9%
- By 2050
- 8,448 · -8.8%
- By 2075
- 7,742 · -16.4%
- By 2100
- 6,414 · -30.8%
Race, ethnicity, and origin ACS 2023
- Neighborhood character
- Predominantly White (80%)
- Race & ethnicity
- White 80% Two or more races 15% Hispanic / Latino 12%
- Hispanic origin (detail)
- Mexican 1%
- Common ancestry
- Portuguese 13% Slovak 2% Iranian 1%
- Foreign-born
- 9% · Canada
- Languages at home
- 88% English-only · Spanish 12%
Political lean MEDSL · Humboldt
- 2024 margin
- Solid R (+50.0) · D 24.4% · R 74.4% · Other 1.2%
- 2008→2024 swing
- -35.7pp toward R · 2008: -14.3pp · 2024: -50.0pp
- All cycles
- 2024: R+50.0 2020: R+44.6 2016: R+46.0 2012: R+22.1 2008: R+14.3
Not yet ingested
- Civics
- —
Market trends
- HPI YoY
- ▲ 2.34%
- Current HPI
- 118.7139
- Rent YoY
- —
- Metro
- —
- State GDP YoY
- ▲ 2.48%
- F500 in state
- 4
Industry mix (Fortune 500 HQ in IA)
| Industry | F500 HQs | Revenue |
|---|---|---|
| Financial Services | 1 | $16B |
|
||
| Retail / Convenience | 1 | $15B |
|
||
Price history
-66.7% since first listed2 events — show timeline
- 2025-12-15 Listed $17,500 IAR
- 2006-07-17 Sold (Public Records) $52,507 Public Records
Property tax history
+2.2%/yrLatest (2025): $1,066 · +1.1% YoY. Source: county tax records.
Cash-flow waterfall
monthlySold comps — $/sqft
last 12 mo · ≤1 miLoading sold comps…