3170 Croftside Cmns · Powder Springs, GA
Flood risk 1/10 · Minimal
- FEMA flood zone
- X (unshaded)
- Chance of flooding over 30 yrs
- 0.0%
- Est. flood insurance / yr
- $473 – $860
Fire risk 3/10 · Minor
- Est. fire insurance / yr
- $963 – $1,789
Heat risk 5/10 · Moderate
- Hot days now (above 103°F)
- 6 days/yr
- Hot days in 30 yrs
- 16 days/yr
Wind risk 4/10 · Minor
- Chance of severe wind over 30 yrs
- 20.0%
Air-quality risk 4/10 · Minor
- Unhealthy air days now
- 5 days/yr
- Unhealthy air days in 30 yrs
- 6 days/yr
Risk factors via First Street. Map © Google.
Why this score? — see what drove the F grade
The composite is a weighted blend of 9 inputs, each scored 0–100. Each bar is that input's sub-score; the figure is the points it added to the 100-point composite (weight × sub-score).
- Cash flow +12.3/30.0
- Condition / age +4.0/5.0
- Schools +3.8/10.0
- DSCR +3.7/10.0
- Livability +3.6/5.0
- 1% rule +3.5/10.0
- Rent growth +2.7/5.0
- ARV discount +0.2/15.0
- Appreciation +0.0/10.0
$494,990
🖨 Deal sheet (PDF) 📄 Offer letter ✓ Due diligence
Listing remarks
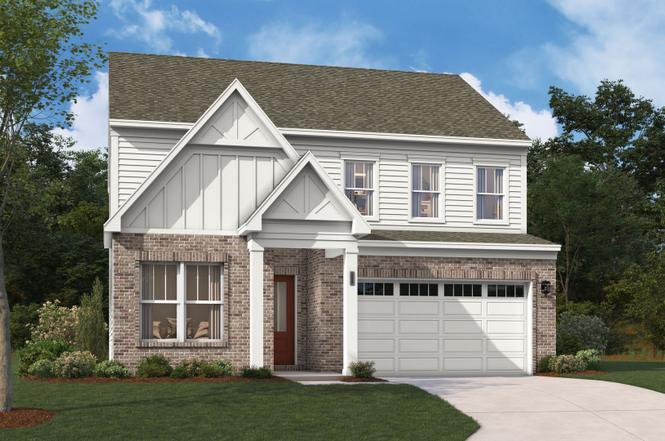
Meet the Maisie II at Croftside Single Family Homes, a vibrant neighborhood with a pool, clubhouse, trails, playground, and dog park for active living. This Maisie II spans two floors and roughly 2,750 square feet, with five bedrooms, three full baths, and a two-car garage. The main level opens through a foyer into the kitchen, where Arctic White quartz countertops sit above cabinetry with satin nickel pulls and a GE Profile built-in wall oven and electric cooktop below a stainless canopy hood. The island offers seating on one side while the breakfast area connects directly to the rear patio. Upstairs, the primary suite holds a walk-in closet and an ensuite bath with a dual-sink vanity and
Key facts
- Dog park
- Clubhouse
- Trails
Tags
Property features AI
Finance
- Other: Spec inventory (new construction); Listing provided by Zillow
- Financial info: List price $494,990
Exterior
- Parking: 2 garage spaces (2 total parking spaces)
- Home design: Single-family home, model named The Maisie II; Active listing
- Exterior features: Address: 3170 Croftside Cmns, Powder Springs, GA 30127
Interior
- Bedrooms: 5 bedrooms
- Bathrooms: 3 full bathrooms
- Interior features: Spec home (The Maisie II plan); Living area approximately 2,750
Neighborhood map
What this means for you Summary
Snapshot
- This is a 5-bed/3.0-bath single-family listed at $495k. Condition is rated good.
Deal economics
- At list price, monthly cash flow is $-88 ($-1k/yr) — negative.
- To cash-flow at today's rent, offer at most $482k (2.6% below list).
- To meet the 1% rule (rent ≥ 1% of price), the offer needs to be $422k (14.8% below list).
- Recommended offer: $422k (14.8% below list) — sets the bar for 1% rule.
- Cap rate 6.1% vs local median 3.7% in Powder Springs — top-decile yield for the area; either an underpriced asset or a hidden risk that comps aren't pricing in. Stress-test before assuming the spread holds.
Location & tenants
- Location reads 71/100 on livability (#79 in GA) — a middle-class / working-renter tenant base. Strengths: housing A+, cost of living A, employment B+; Watch: amenities F, commute F.
- Cobb County (suburban): math 39% / reading 45% proficiency, ranked #25 of 174 in GA (top 14%) — families likely to look elsewhere, expect single-tenant / working-renter base with shorter leases.
- Zoned schools: Compton Elementary School (math 17% / reading 19%, grade F, #926 of 1,228 statewide, top 76%, 591 students, 82% FRL); Tapp Middle School (math 23% / reading 39%, grade F, #237 of 470 statewide, top 51%, 873 students, 66% FRL); Mceachern High School (math 19% / reading 24%, grade F, #218 of 424 statewide, top 53%, 2,327 students, 63% FRL) — zoned schools average 70% FRL vs 39% district-wide (31 pts higher); higher-poverty schools than district average — tighter screening recommended.
- Zoned-school proficiency averages 24% at this address vs 42% district-wide (-18 pts) — the specific schools serving this property underperform the Cobb County average; the district grade overstates school quality for this exact location.
- Market conditions: Rents flat; 658 active listings in the ZIP; 2 comparable units currently listed for rent nearby; high-income renter base; 1,625 units permitted in Cobb County in 2024 (389 in 5+ unit buildings).
- At $4,219/mo this rent would consume 46% of the median local household income ($111k/yr) (locally 912% of renters already pay >50% of income on rent) — very limited rent-growth headroom before tenants either downsize or default.
Forward outlook
- Local home prices are declining (-3.0%/yr); year-one equity from $3k of loan paydown is wiped out by about $15k of value loss. Plan a longer hold.
- Cobb County population projected at +33% by 2050 — long-run rental-demand tailwind backs the buy-and-hold thesis.
Negotiation context
- Only 4 days on market — expect competitive offers; lowballing is unlikely to land.
Risks & watch-outs
- Climate carrying-cost: extreme-heat days projected 6→16/yr by 2055 (HVAC capex compounding) — expect insurance premiums to compound above CPI over the hold.
Questions for the listing agent
- What do current leases actually rent for vs. the listed asking? Can we see a recent rent roll and the last 12 months of T-12 income?
- Is there a deadline driving the sale (1031 exchange, divorce, estate, relocation)? That informs how much negotiation room exists.
- The area grade is low — what's the realistic commute time and amenity access for the typical tenant pool here? Any planned neighborhood developments (good or bad) we should know about?
- What's the average days-on-market for RENTAL listings here right now (not sales)? A rising rental-DOM trend means longer vacancies and softer asking-rent achievability than the comps imply.
- What's the recent tenant-quality profile in this submarket — average credit score on applications, eviction rate, late-payment / NSF rate, and stable-employment percentage? A property-management company in the area should have these aggregated.
- How much new for-sale + rental construction is in the pipeline within 1–3 miles? Heavy new supply typically softens prices + rents 12–24 months out; constrained supply supports both.
Investment metrics
- 1% rule
- 0.85% ✗
- Cap rate
- 6.08%
- Cash-on-cash
- -0.76%
- DSCR
- 0.97
- GRM
- 9.8
CMA / ARV
- ARV (on-the-fly)
- $426,250
- Comps found
- 9
Show comp detail 9 sales within ~0.75 mi
| Address | Dist | Beds/Ba | Sqft | Sold | Price | $/sf | Match |
|---|---|---|---|---|---|---|---|
| 3370 Knighton Rdg | 0.19mi | 4/3.5 (-1) | 2,774 (+1%) | 10mo | $385,000 | $139 | 74 |
| 3147 Oak Leaf Ct | 0.56mi | 4/2.5 (-1) | 2,732 (-1%) | 1mo | $358,000 | $131 | 65 |
| 3107 Goldenrod Ln SW | 0.35mi | 4/3.0 (-1) | 2,507 (-9%) | 2mo | $402,000 | $160 | 62 |
| 3239 Rose Petal Ln | 0.63mi | 5/3.0 | 2,836 (+3%) | 12mo | $406,000 | $143 | 55 |
| 3282 Eloise Dr | 0.48mi | 4/2.0 (-1) | 2,396 (-13%) | 0mo | $357,000 | $149 | 47 |
| 3190 Red Rose Dr | 0.61mi | 4/3.5 (-1) | 2,894 (+5%) | 11mo | $450,000 | $155 | 47 |
| 3235 Avondale Pkwy | 0.55mi | 4/3.0 (-1) | 2,432 (-12%) | 7mo | $387,000 | $159 | 44 |
| 3210 Avondale Pkwy | 0.54mi | 4/3.0 (-1) | 2,416 (-12%) | 12mo | $420,000 | $174 | 40 |
| 3185 Red Rose Dr | 0.58mi | 4/2.5 (-1) | 2,344 (-15%) | 19mo | $410,000 | $175 | 26 |
Match score weights: distance 35% · size 25% · config 20% · recency 20%. Top-matched comps best support the ARV.
Projected returns pro-forma
-3.0% appreciation · 0.74% rent growth · sell at horizon
- IRR
- -20.1%
- Equity multiple
- 0.31×
- Total profit
- $-95,117
- Equity at exit
- $73,805
- IRR
- -18.9%
- Equity multiple
- 0.09×
- Total profit
- $-126,558
- Equity at exit
- $42,798
Cash invested: $138,597 (down + closing). Projections, not guarantees.
Landlord ↔ Tenant lean methodology
- Overall (STATE)
- 90 Strongly Landlord-Friendly
- State Georgia
- 90 Strongly Landlord-Friendly · R+3
- County
- — inherits STATE
- City
- — inherits STATE
ZIP-level market 30127
- Rents YoY
- 0.7%
- Active inventory
- 658
- Price-to-rent
- 9.8×
Monthly cashflow live
- Estimated rent
- $4,219 medium interval (Pro) →
- Mortgage (P&I)
- −$2,596
- Tax est. 1.5%
- −$619 /mo · $7,425/yr
- Insurance
- −$206
- HOA
- −$0
- Vacancy / Maint / Mgmt
- −$886
- Net cashflow
- $-88
Break-even live
Sensitivity live
| Price | -10% $254 | -5% $83 | +0% $-88 | +5% $-259 | +10% $-430 |
|---|---|---|---|---|---|
| Rent | -10% $-421 | -5% $-254 | +0% $-88 | +5% $79 | +10% $246 |
| Rate | -1.0pp $162 | -0.5pp $38 | base $-88 | +0.5pp $-216 | +1.0pp $-346 |
UW: 25.0% down · 7.5% · 30yr · 1.5% tax · 5.0% vac · 8.0% maint · 8.0% mgmt
Financing live
Cash to close
- Down payment
- $123,748
- Closing costs
- $14,850
- Reserves months
- —
- Total cash needed
- —
Loan-product check · same deal, 3 products live
Conventional
25% down · 7.5% · 30yr
- Down + closing
- —
- Monthly P&I
- —
- Monthly cashflow
- —
- DSCR
- —
- Eligible?
- —
Personal DTI + credit; lowest rate.
DSCR
20% down · 8.5% · 30yr
- Down + closing
- —
- Monthly P&I
- —
- Monthly cashflow
- —
- DSCR
- —
- Eligible?
- —
No personal income docs; deal must DSCR.
Hard money
10% down · 12.0% · 12mo
- Down + closing
- —
- Monthly P&I
- —
- Monthly cashflow
- —
- DSCR
- —
- Eligible?
- —
Short-term bridge; refi at stabilization.
Rent comps 2 comps
| Address | Beds | Baths | Sqft | Rent | $/sqft | DOM | Units | Dist |
|---|---|---|---|---|---|---|---|---|
| 3125 Avondale Pt Powder Springs, GA | 4.0 | 3.0 | 2676 | $5,950 | $2.22 | 45d | 1 | 0.48mi |
| 3387 Cider Mill Ct SW Marietta, GA | 4.0 | 3.0 | 2180 | $2,595 | $1.19 | 1d | 1 | 0.84mi |
Listing history 3 events
-
2026-06-21days on market $494,990 Active 4 DOM
-
2026-06-17remarks 699-char remark
-
2026-06-17$494,990 Active 1 DOM
ⓘ Source: listings_history table (triggers on properties + properties_extension) + one-shot
backfill from property_details.listing_events for pre-trigger history.
Climate risk First Street
- Flood 1/10 Low FEMA zone X (unshaded) · 0% chance over 30 yrs
- Wildfire 3/10 Moderate
- Heat 5/10 Major 6 d/yr ≥103°F today · 16 d/yr by 30 yrs out
- Wind 4/10 Moderate 20% chance of damaging wind over 30 yrs
- Air quality 4/10 Moderate 5 unhealthy d/yr today · 6 by 30 yrs out
Nearby sold comps map
Loading sold comps map…
Walkable amenities ~0.75 mi
Loading nearby amenities…
Taxation est. · year 1
- Rental income
- $50,628
- − Mortgage interest
- −$27,727
- − Property taxes
- −$7,425
- − Insurance
- −$2,475
- − Repairs & maintenance
- −$4,050
- − Management
- −$4,050
- − Depreciation
- −$14,400
- Taxable loss
- −$9,499
- Est. tax savings @ 24.0%
- +$2,280
- After-tax cash flow
- $1,227/yr
For passive investors: Depreciation is non-cash, so a rental often shows a tax loss while cash-flowing — sheltering income. Rental losses are passive: they offset passive income freely, and up to $25,000/yr can offset ordinary (W-2) income if you actively participate and your MAGI is under $100k (phasing out to $0 by $150k); unused losses carry forward. On sale, claimed depreciation is recaptured at up to 25%, and gains may owe capital-gains tax (a 1031 exchange can defer both). Figures are a year-1 estimate at your 24.0% rate — not tax advice; consult a CPA.
Condition & rehab AI · 13 photos
This home is in good condition with a good condition score of 80. It has a cosmetic rehab level and requires minor maintenance and repairs. The highest-ROI updates that would raise its resale or rental value are painting the exterior and trimming the landscaping.
Value-add opportunities
- Resale Paint exterior — Fresh paint can enhance curb appeal and home value
- Resale Trim landscaping — Well-maintained landscaping can improve curb appeal and home value
- Both Replace carpet with hardwood — Hardwood floors are more durable and can increase both resale and rental value
Renovation cost estimate screening
Value-add ROI direction
- Resale Paint exterior — Fresh paint can enhance curb appeal and home value ↑
- Resale Trim landscaping — Well-maintained landscaping can improve curb appeal and home value ↑
- Both Replace carpet with hardwood — Hardwood floors are more durable and can increase both resale and rental value ↑
ⓘ Cost ranges are severity-bucket heuristics (US national rule-of-thumb). Get contractor quotes + a written scope before underwriting a rehab budget.
Schools (NCES district)
- District
- Cobb County
- NCES district ID
- 1301290
- Math proficiency
- 39% ▼ -15.00%
- Reading proficiency
- 45% ▼ -10.00%
- Median HH income
- $68,845
- Composite
- 37.93/100
- National rank
- #4308
- State rank
- #25 of 174 in GA
Livability — Powder Springs
- Score
- 71/100
- State rank
- #79
- US rank
- #6846
Category grades
Schools grade is shown separately in the Schools card above.
Census & demographics
- County
- Cobb County · 777,758 people
- City population
- 71,626
- Metro
- Atlanta-Sandy Springs-Alpharetta, GA
- Population (ZIP)
- 71,626
- Household income
- $110,904
- Rent vs Own
- Severe rent burden
- 912.0
Population outlook (Cobb County) Hauer SSP2
- Today (2025)
- 868,385 people
- By 2030
- 929,614 · +7.1%
- By 2040
- 1,047,533 · +20.6%
- By 2050
- 1,155,537 · +33.1%
- By 2075
- 1,405,030 · +61.8%
- By 2100
- 1,555,058 · +79.1%
Race, ethnicity, and origin ACS 2023
- Neighborhood character
- Diverse neighborhood (Simpson 0.65)
- Race & ethnicity
- Black 45% White 37% Hispanic / Latino 11% Two or more races 7% Asian 1% Native American 1%
- Hispanic origin (detail)
- Mexican 4% Puerto Rican 2%
- Common ancestry
- Hispanic 2% Italian 1% Lithuanian 1%
- Foreign-born
- 12% · Canada, Vietnam
- Languages at home
- 85% English-only · Spanish 8% French/Haitian/Cajun 2% Other Indo-European 1%
Political lean MEDSL · Cobb
- 2024 margin
- D (+14.9) · D 56.9% · R 42.0% · Other 1.1%
- 2008→2024 swing
- +24.3pp toward D · 2008: -9.4pp · 2024: 14.9pp
- All cycles
- 2024: D+14.9 2020: D+14.3 2016: D+2.1 2012: R+12.6 2008: R+9.4
Not yet ingested
- Civics
- —
Market trends
- HPI YoY
- ▼ -161.28%
- Current HPI
- 222.6123
- Rent YoY
- ▲ 0.74%
- Metro
- Atlanta-Sandy Springs-Alpharetta, GA
- State GDP YoY
- ▲ 2.66%
- F500 in state
- 28
Industry mix (Fortune 500 HQ in GA)
| Industry | F500 HQs | Revenue |
|---|---|---|
| Paper / Packaging | 2 | $29B |
|
||
| Retail | 1 | $160B |
|
||
| Transportation / Logistics | 1 | $91B |
|
||
| Airlines | 1 | $62B |
|
||
| Consumer Goods | 1 | $47B |
|
||
| Utilities | 1 | $25B |
|
||
Cash-flow waterfall
monthlySold comps — $/sqft
last 12 mo · ≤1 miLoading sold comps…